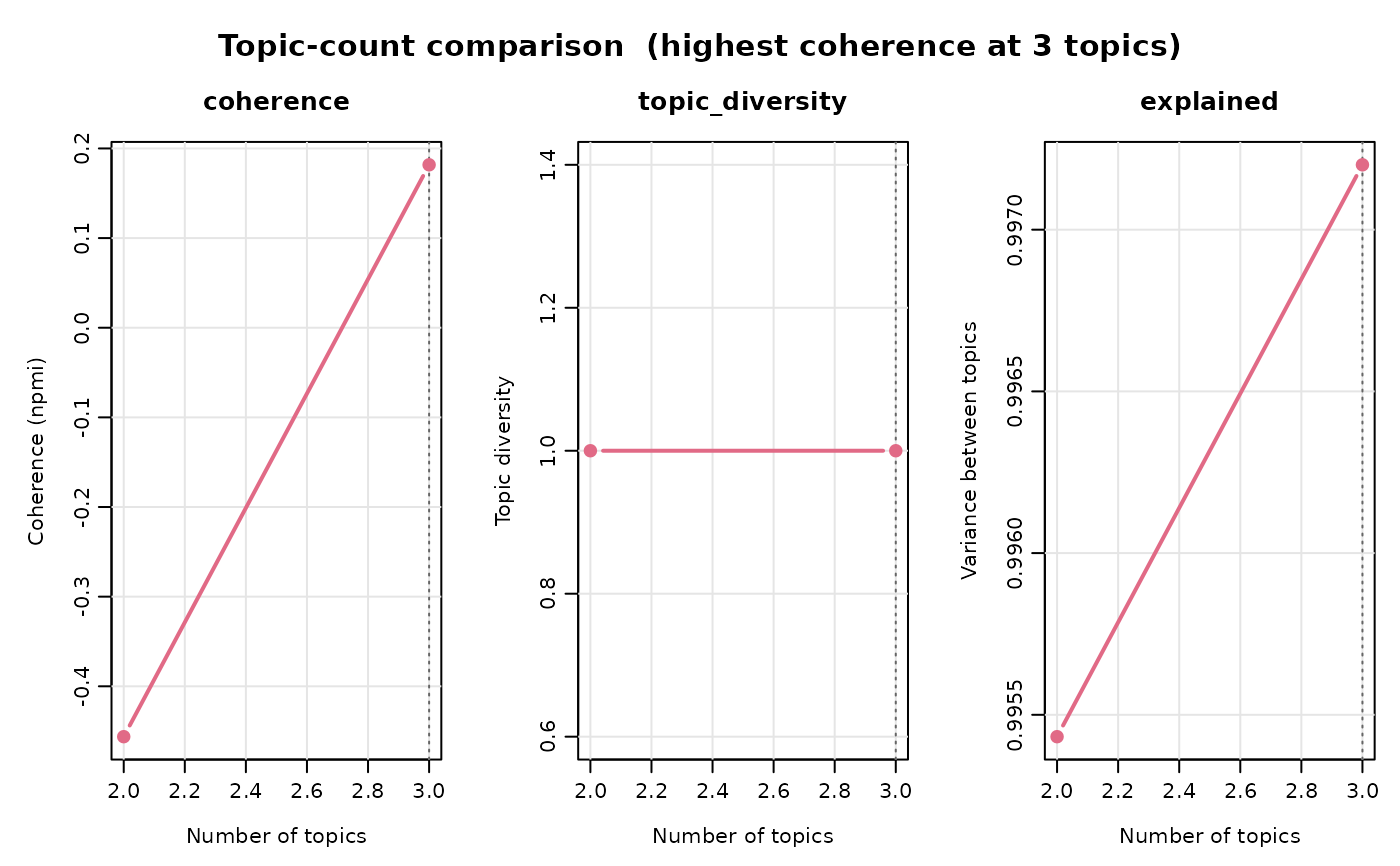
`type = "metrics"` (the default) draws coherence, topic diversity, and between-topic variance against the candidate topic counts, marking the count with the highest coherence. A comparison over several segment levels draws one line per level in each panel, told apart by color, point shape, and line type, with a legend. There is no single correct topic count; the useful signal is the count after which coherence stops improving, not a global maximum.
Arguments
- x
A comparison returned by [compare_topics()].
- type
`"metrics"` (default) or `"fit"`.
- main
Overall title for `type = "metrics"`.
- n_topics
For `type = "fit"`, the candidate count whose models are drawn. Required when the comparison holds several candidates.
- segment
For `type = "fit"`, the segment levels to draw; defaults to every level in the comparison.
- n_terms, n_representatives
For `type = "fit"`, passed to [plot.sbert_topic_model()].
- ...
Passed to the underlying plotting calls.
Details
`type = "fit"` draws the per-topic fit report of [plot.sbert_topic_model()] for the retained model at `n_topics`, one figure per segment level, so the same topic count can be read across segmentations side by side.
Examples
text <- c(
  "Cats chase mice", "Dogs chase balls", "Kittens nap in sunshine",
  "Stocks and bonds trade", "Markets price shares", "Banks report profit"
)
embeddings <- rbind(
  c(1, 0), c(0.95, 0.05), c(0.9, 0.1),
  c(0, 1), c(0.05, 0.95), c(0.1, 0.9)
)
comparison <- compare_topics(text, n_topics = 2:3, embeddings = embeddings)
plot(comparison)