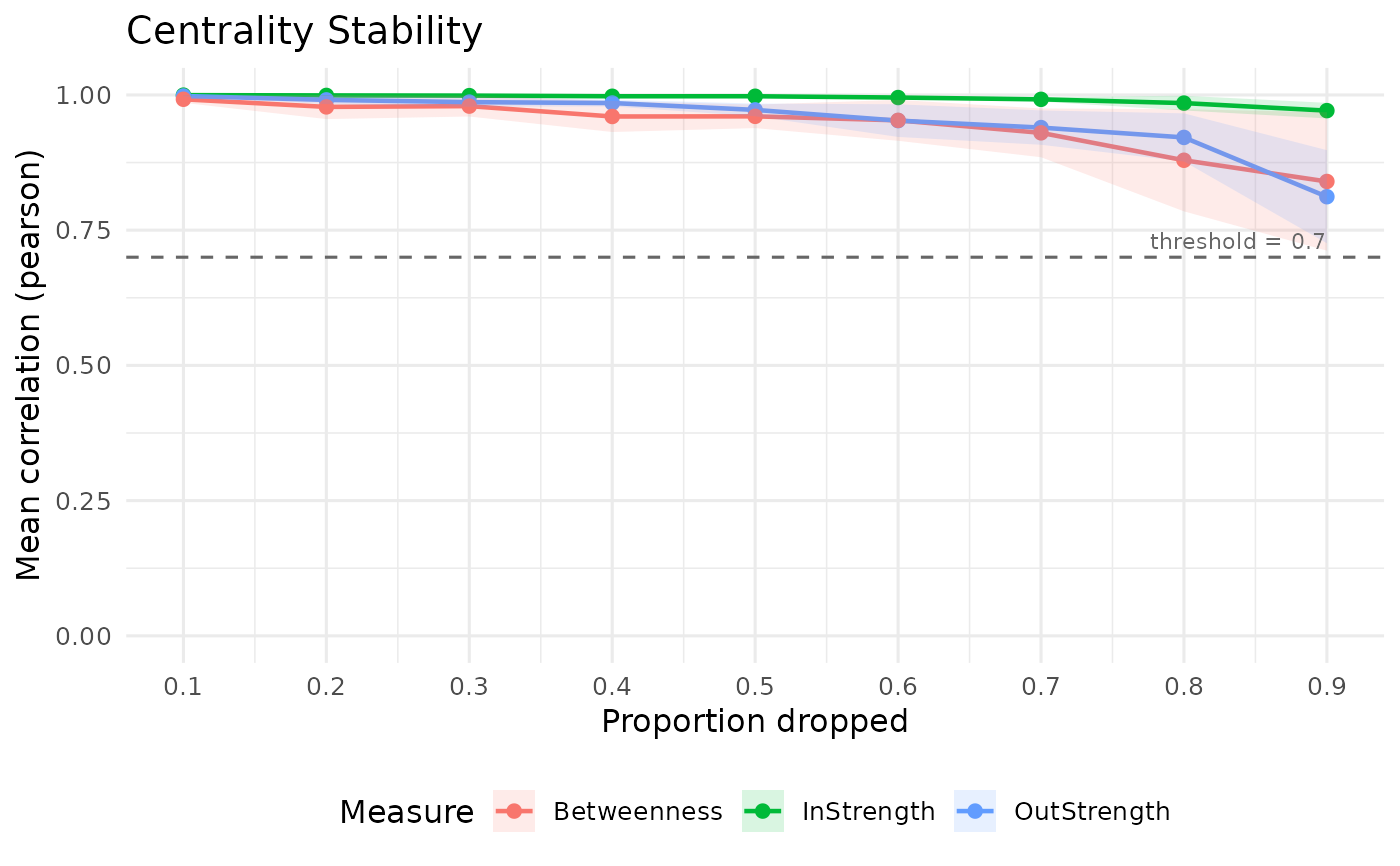
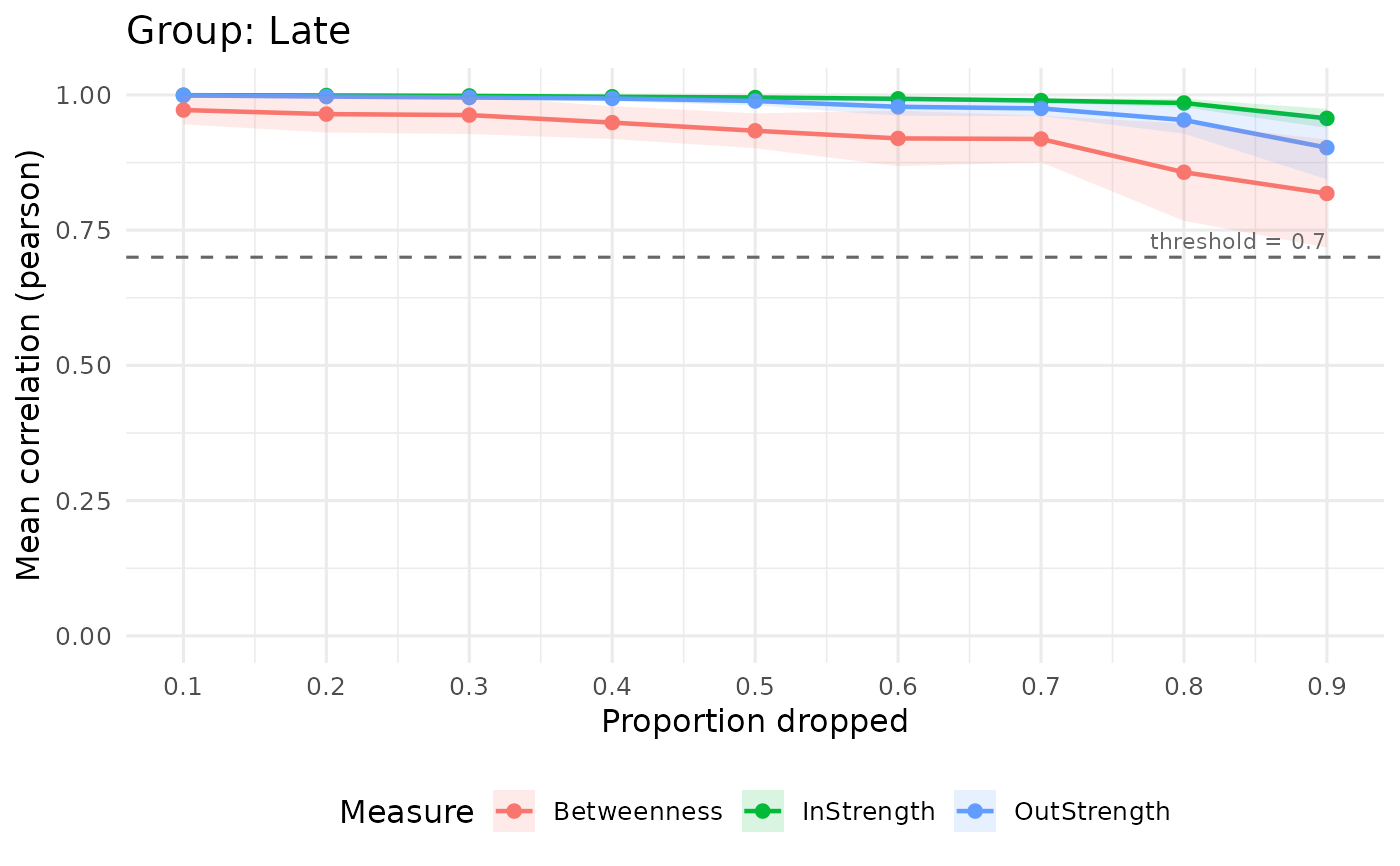
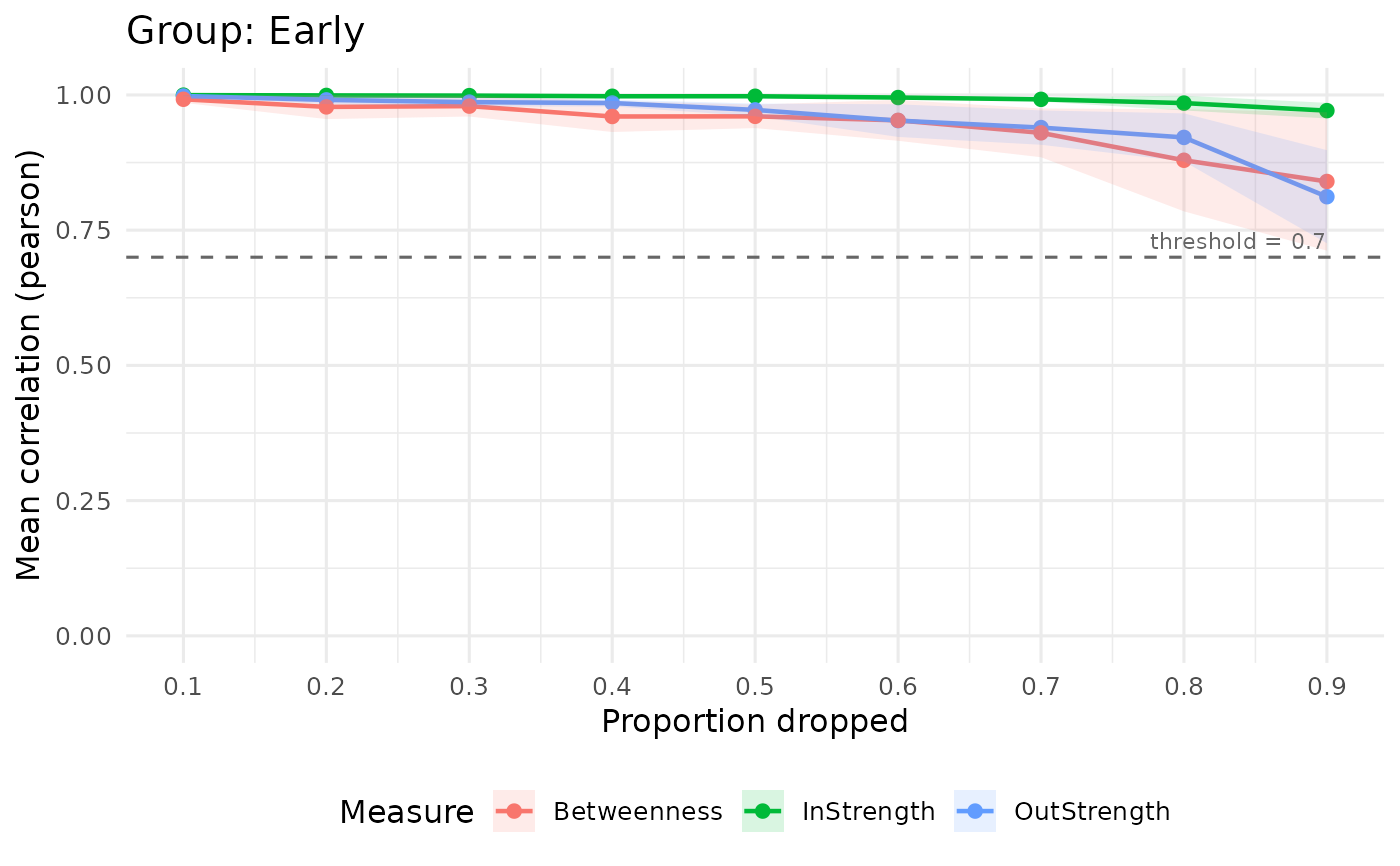
S3 method for plotting grouped htna stability results.
Usage
# S3 method for class 'htna_stability_group'
plot(x, ...)
Arguments
- x
An object of class
htna_stability_groupfromcentrality_stability_htna().- ...
Additional arguments passed to the plotting method.
Examples
# \donttest{
data(human_ai)
grp <- build_htna(human_ai, actor_type = "actor_type", group = "phase")
#> Warning: A network with one long sequence is not recommended and can't be validated using bootstrap and other confirmatory testings.
#> Metadata aggregated per session: ties resolved by first occurrence in 'cluster' (24 sessions), 'actor_type' (9 sessions)
#> Warning: A network with one long sequence is not recommended and can't be validated using bootstrap and other confirmatory testings.
#> Metadata aggregated per session: ties resolved by first occurrence in 'session_date' (1 sessions), 'cluster' (18 sessions), 'actor_type' (15 sessions)
cs <- centrality_stability_htna(grp, iter = 20, seed = 1)
plot(cs)
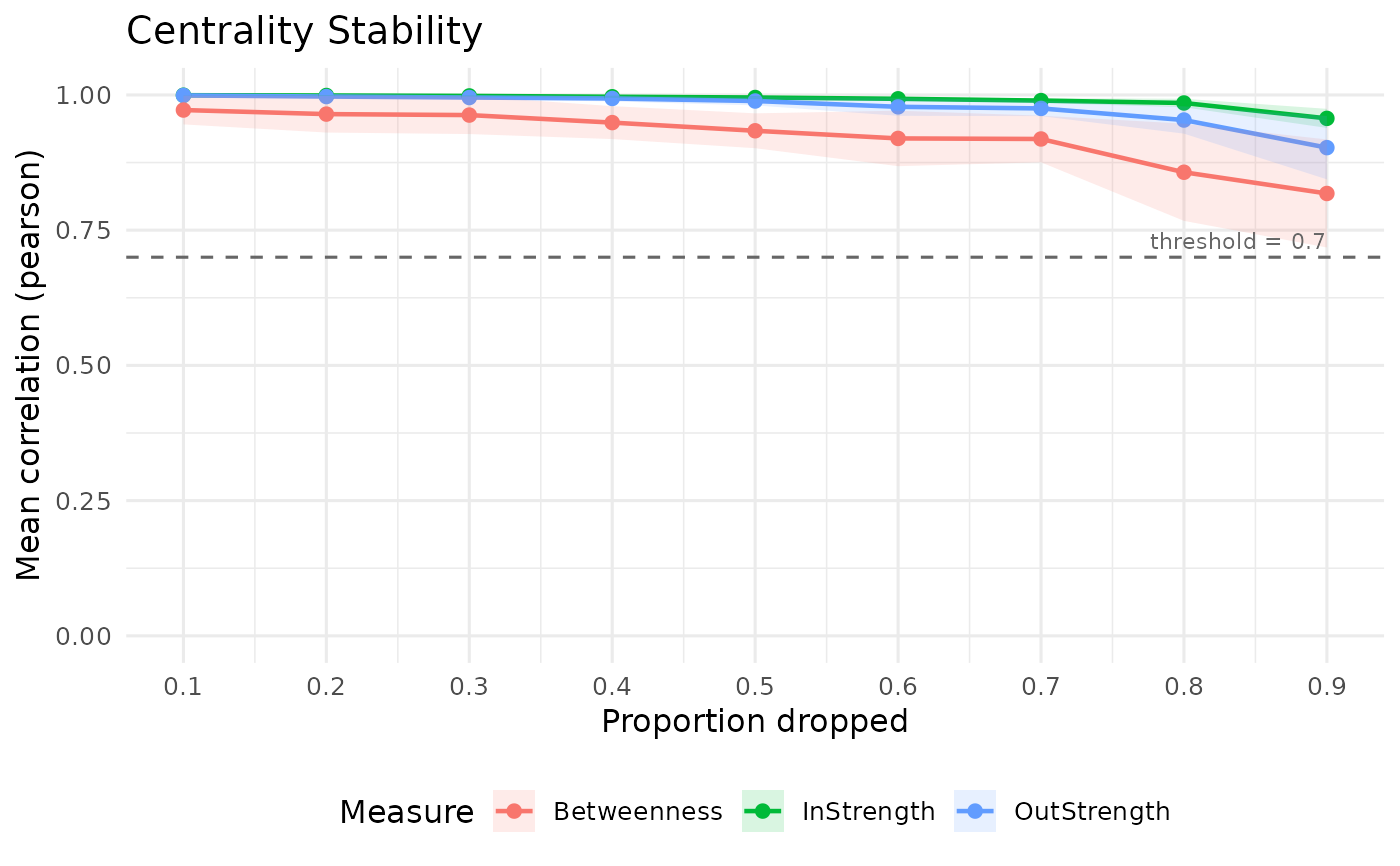
 #> $Late
 #>
#> $Early
#>
#> $Early
 #>
# }
#>
# }