Extracts each actor's events from the combined wide sequence in
net$data (using net$node_groups as the node-to-actor lookup),
compresses each session into the actor's own ordered events, pads to a
common width, and renders with Nestimate::sequence_plot() grouped by
actor. Each session contributes one row per actor that had at least one
event in it.
Usage
sequence_plot_htna(
  net,
  by = c("state", "group"),
  type = c("index", "heatmap", "distribution"),
  grouped_legend = TRUE,
  ...
)

# S3 method for class 'htna'
plot_sequences(x, ...)
Arguments
- net
An htna network from
build_htna(). Must have$dataand$node_groupspopulated.- by
"state"(default) keeps state-level colouring with one row per (session, actor) extracted fromnet$data;"group"re-colours the original combined session matrix by actor (each cell = the actor that acted at that time step).- type
Sequence plot layout:
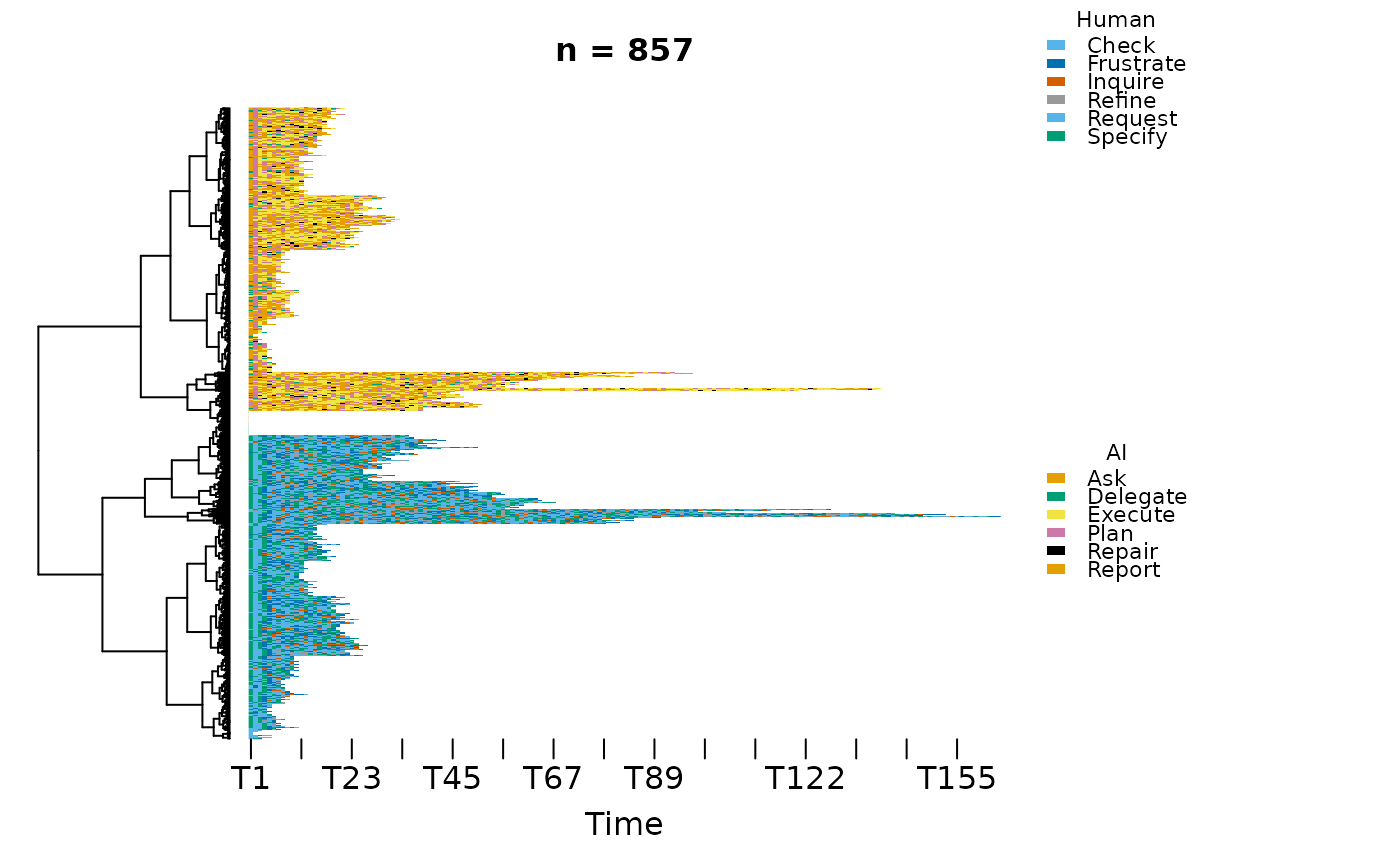
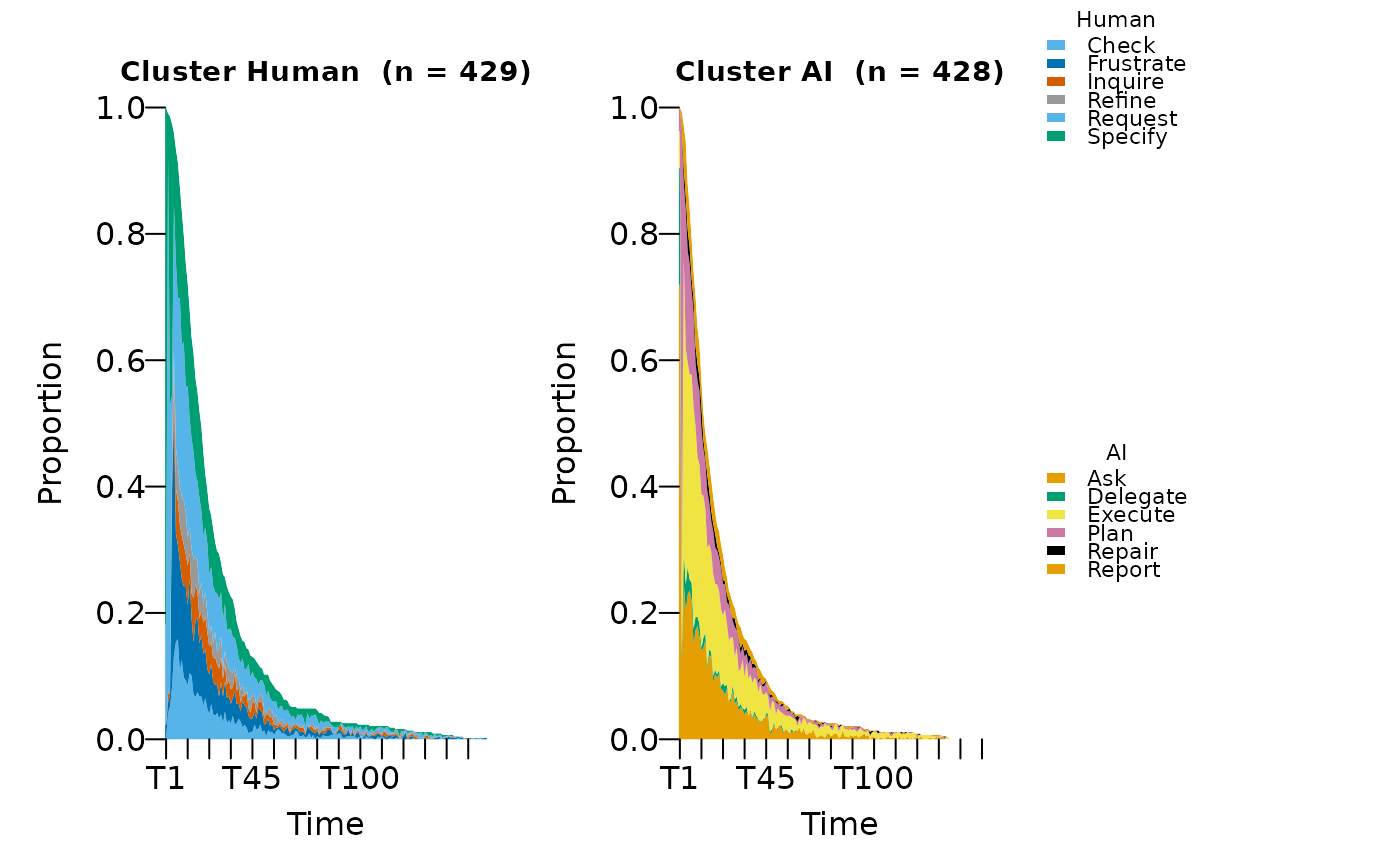
"index"(default; one panel per actor, vertically stacked),"heatmap"(single carpet with a white separator at the actor boundary, controllable viak_line_width), or"distribution"(one stacked-area panel per actor).- grouped_legend
Logical. If
TRUE(default) andby = "state", the per-state legend is split into one block per actor with the actor name as a sub-title.- ...
Forwarded to
Nestimate::sequence_plot().- x
Same as
net; used when calling via theplot_sequences()generic.
Value
Invisibly, the list returned by Nestimate::sequence_plot().
Examples
# \donttest{
data(human_ai)
net <- build_htna(human_ai, actor_type = "actor_type")
#> Warning: A network with one long sequence is not recommended and can't be validated using bootstrap and other confirmatory testings.
#> Metadata aggregated per session: ties resolved by first occurrence in 'session_date' (1 sessions), 'cluster' (42 sessions), 'actor_type' (24 sessions)
sequence_plot_htna(net) # index, faceted
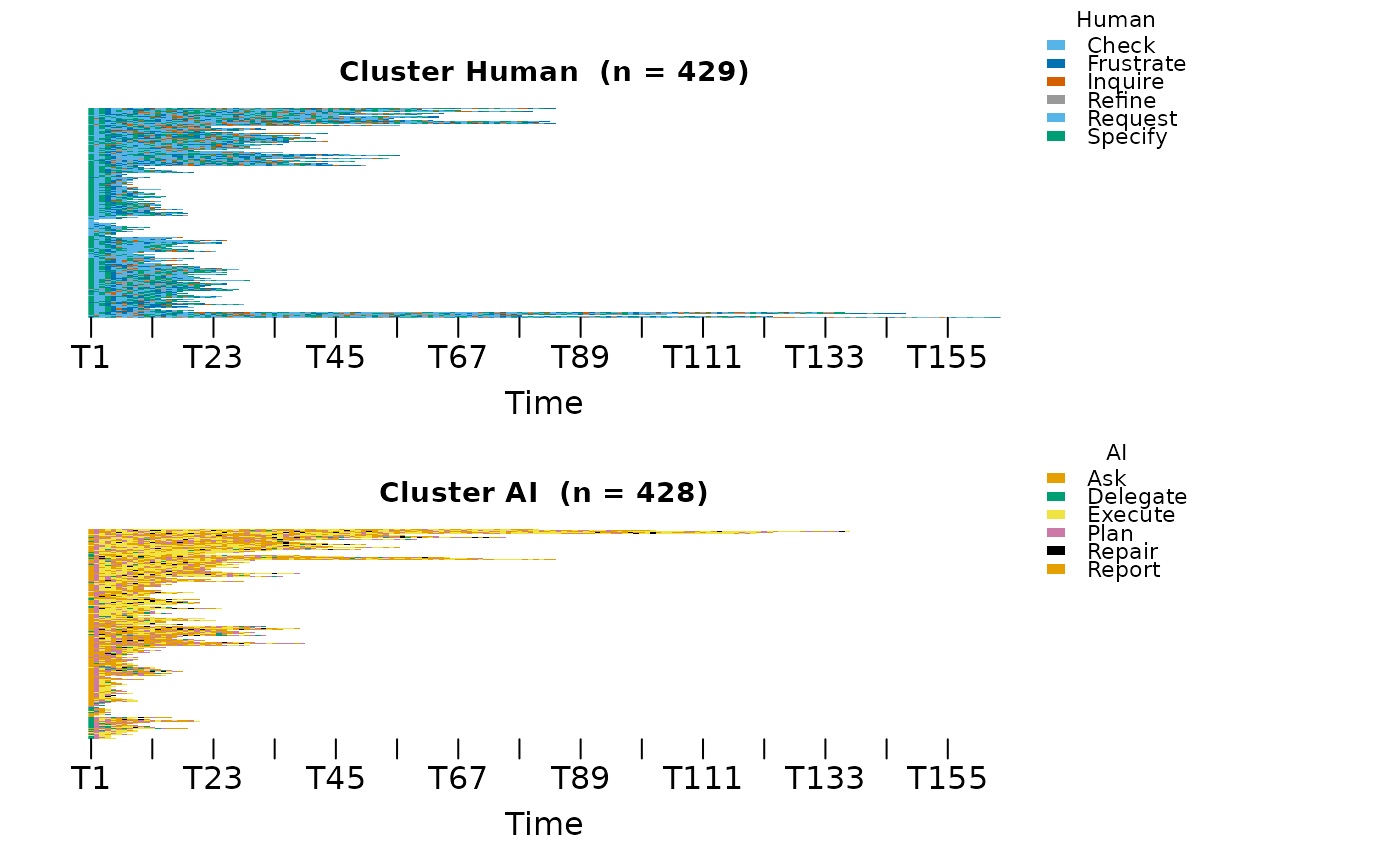 sequence_plot_htna(net, type = "heatmap") # single carpet, white gulf
 sequence_plot_htna(net, type = "distribution")
 # }
# }