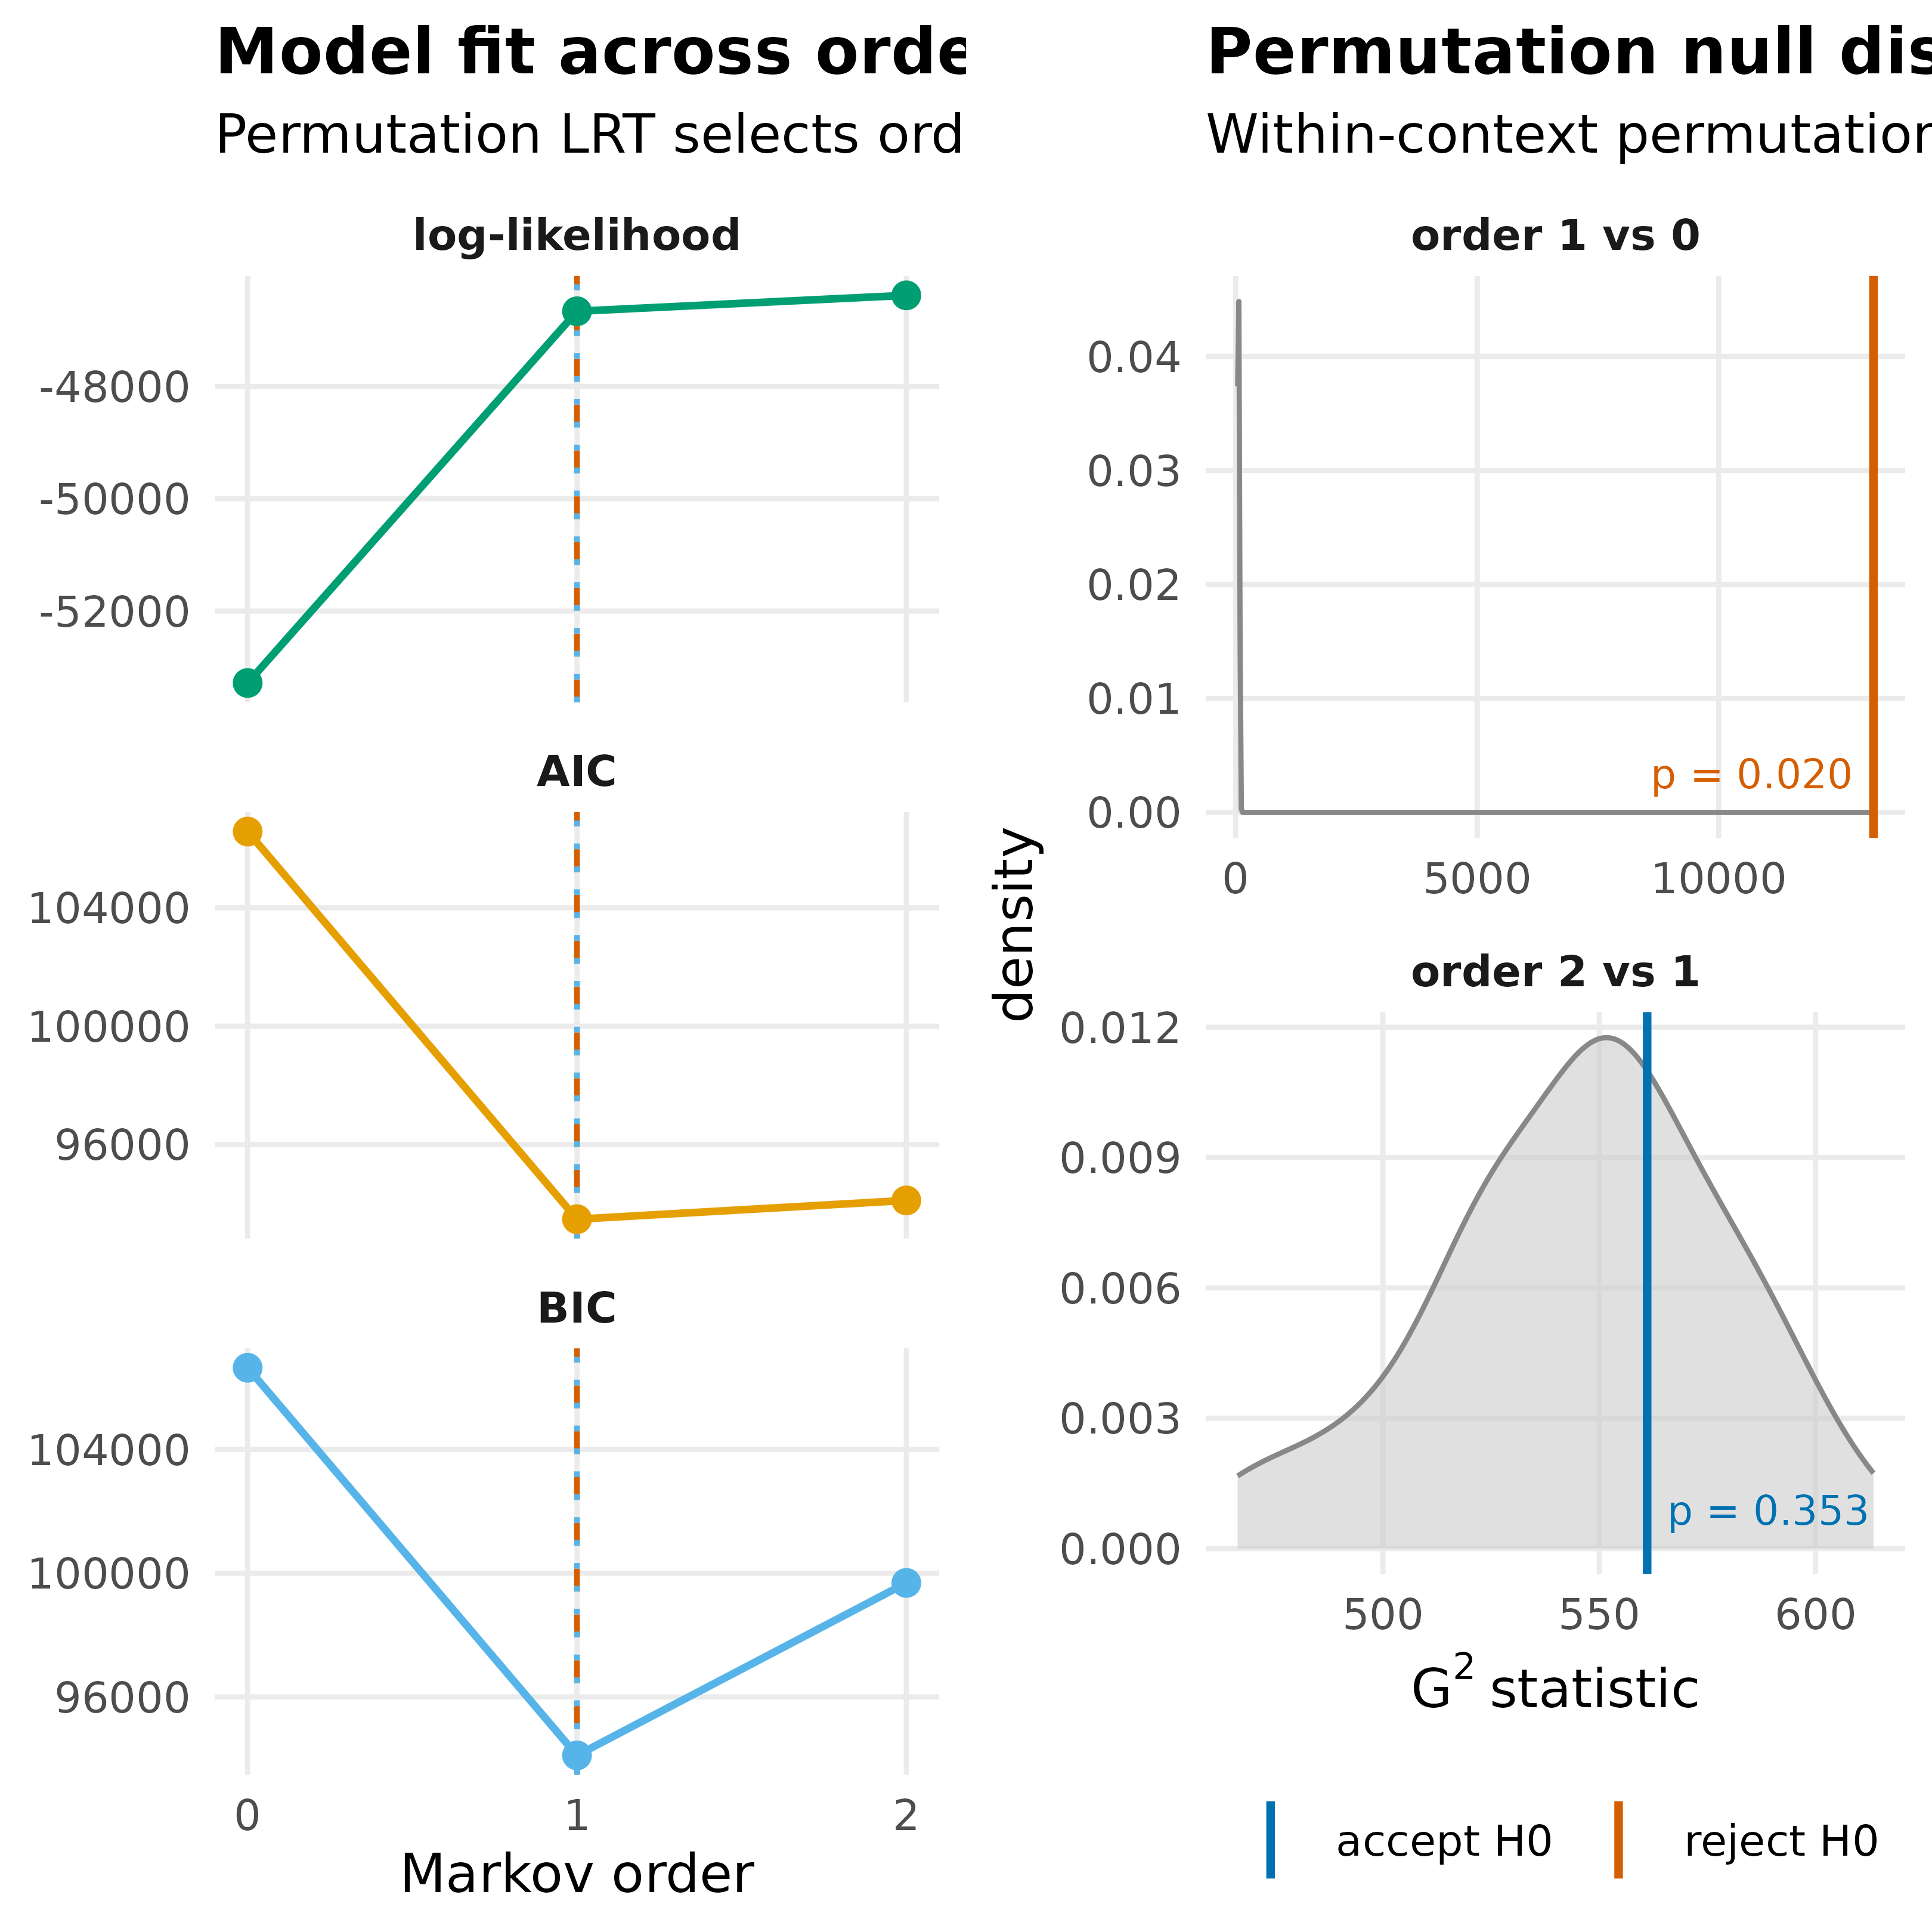
A two-panel visualization (the plot of Nestimate::markov_order_test()):
Arguments
- x
A
tna_markov_orderor agroup_tna_markov_orderobject.- panel
A
characterstring, which panels to draw:"both"(the default),"ic", or"permutation".- combined
A
logicalvalue. Whenpanel = "both"andcombinedisTRUE(the default), the two panels are drawn side by side. WhenFALSE, the twoggplotobjects are returned without drawing them. Ignored whenpanelis not"both".- title
An optional
characterstring placed before the panel titles. For agroup_tna_markov_orderobject, one per group (the group names by default).- ...
Must be empty: an unknown argument, such as a misspelled
panel, is an error.
Value
A ggplot object for panel = "ic" or panel = "permutation".
For panel = "both", a named list of the two ggplot objects (ic,
permutation), invisibly, after drawing them side by side when
combined = TRUE. For a group_tna_markov_order object, the plots of
the groups are drawn one after another, and a list with the result for
each group is returned invisibly.
Details
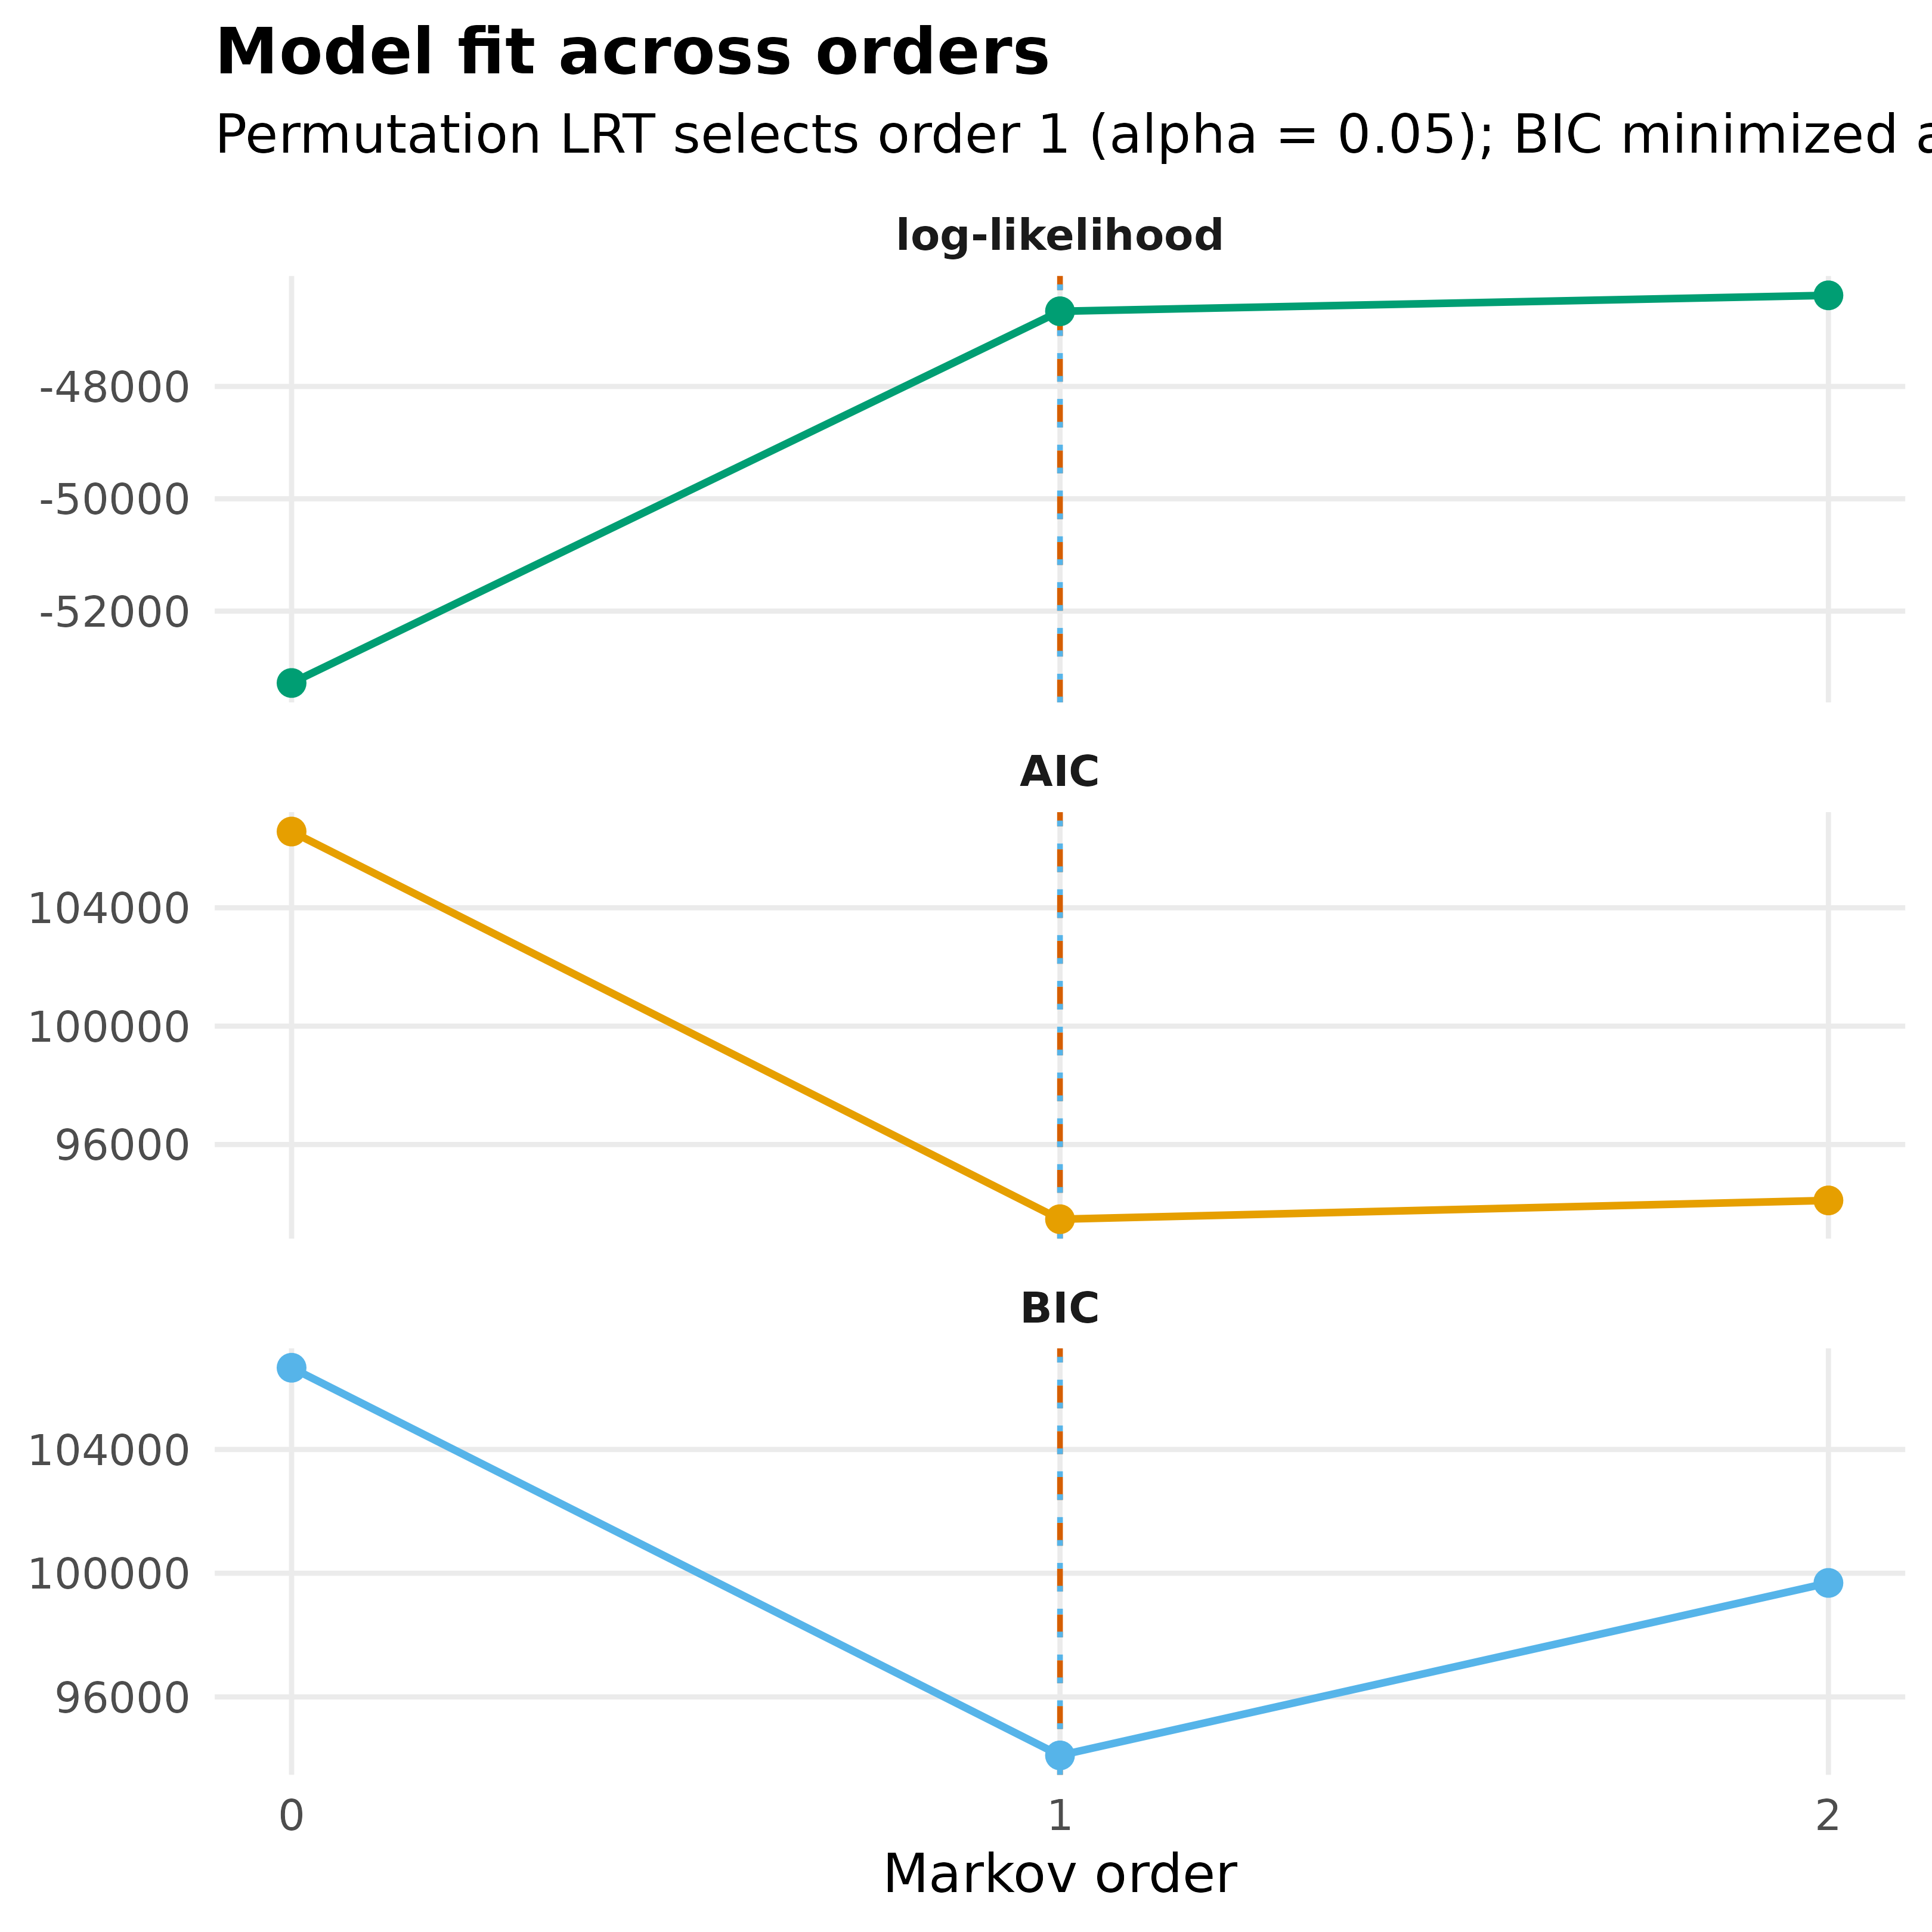
Panel A: the log-likelihood, AIC, and BIC across the tested orders, with the order selected by the permutation tests (dashed line) and the order that minimizes BIC (dotted line) marked.
Panel B: the permutation null density of each order with the observed \(G^2\) as a vertical line, colored by rejection at
leveland labelled with its p-value.
Uses the Okabe-Ito colorblind-safe palette.
See also
Validation functions
bootstrap(),
deprune(),
estimate_cs(),
markov_order(),
permutation_test(),
permutation_test.group_tna(),
plot.group_tna_bootstrap(),
plot.group_tna_permutation(),
plot.group_tna_stability(),
plot.tna_bootstrap(),
plot.tna_permutation(),
plot.tna_reliability(),
plot.tna_stability(),
print.group_tna_bootstrap(),
print.group_tna_permutation(),
print.group_tna_stability(),
print.summary.group_tna_bootstrap(),
print.summary.tna_bootstrap(),
print.summary.tna_markov_order(),
print.tna_bootstrap(),
print.tna_markov_order(),
print.tna_permutation(),
print.tna_reliability(),
print.tna_stability(),
prune(),
pruning_details(),
reliability(),
reprune(),
summary.group_tna_bootstrap(),
summary.tna_bootstrap(),
summary.tna_markov_order(),
summary.tna_permutation(),
summary.tna_reliability(),
summary.tna_stability()
Examples
model <- tna(group_regulation)
mo <- markov_order(model, max_order = 2, iter = 50)
plot(mo)
 plot(mo, panel = "ic")