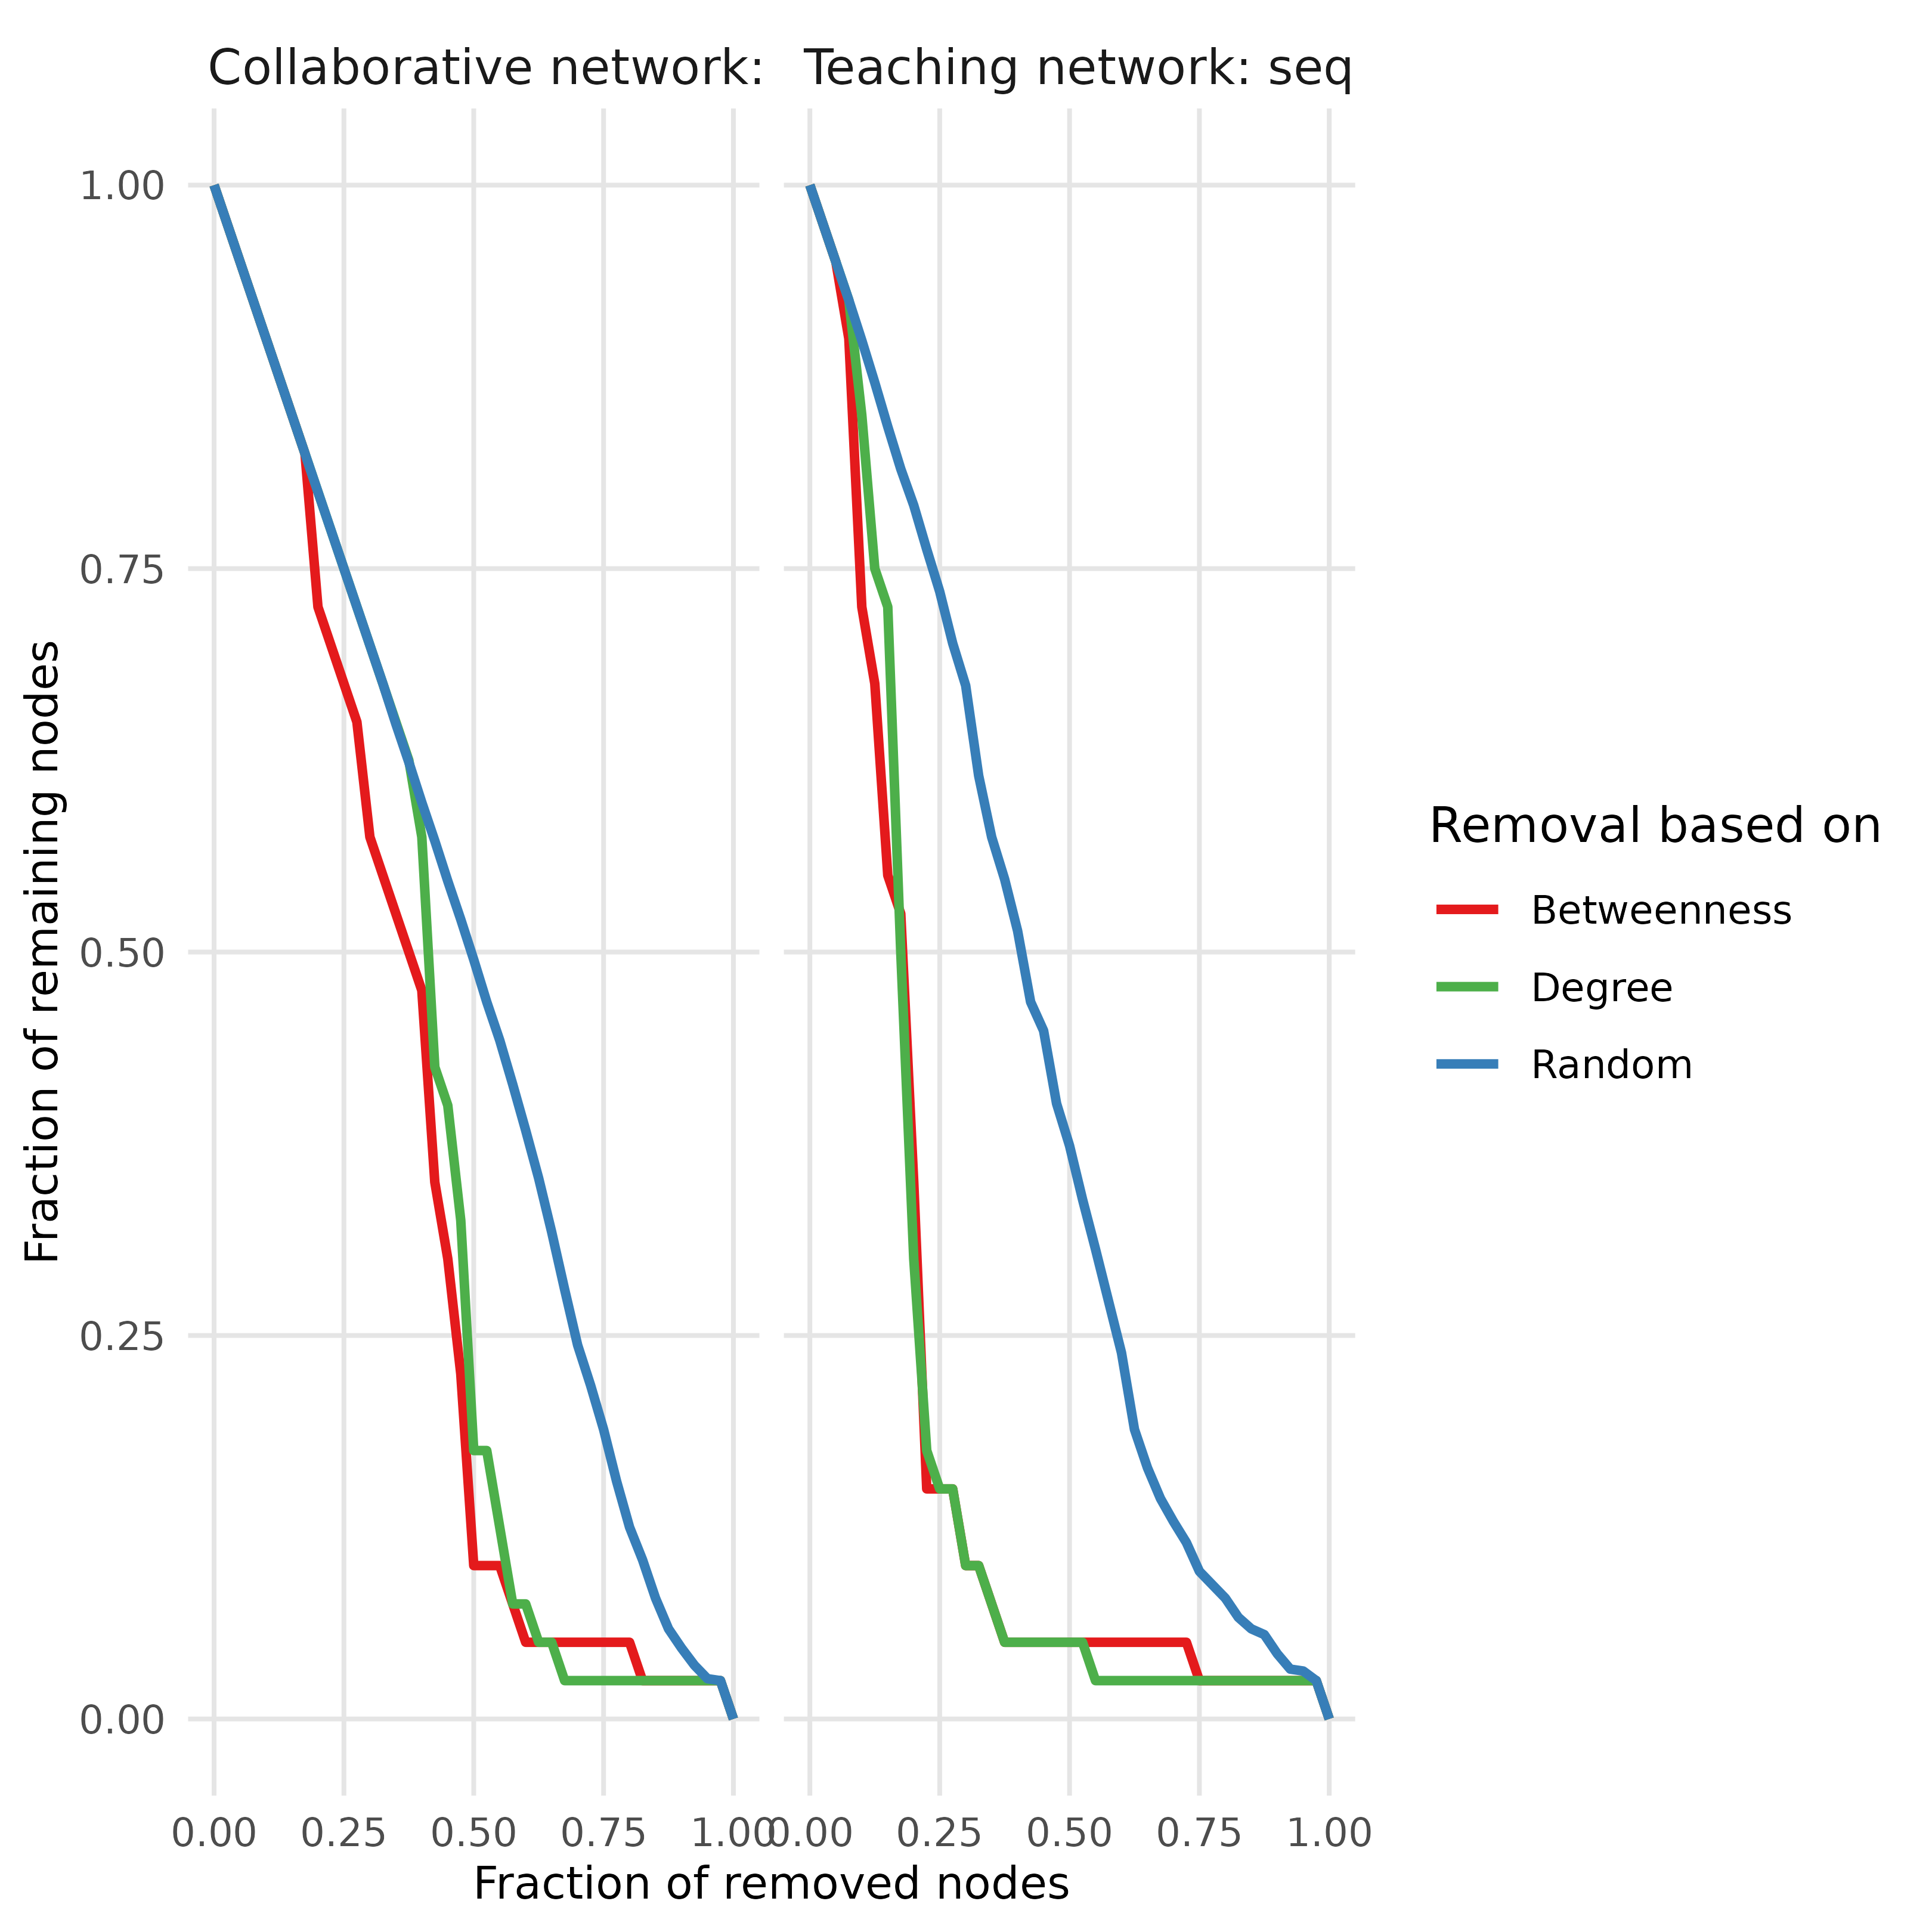
Plots robustness curves for one or more networks with ggplot2, with one facet per network and one line per attack strategy.
Usage
ggplot_robustness(
  ...,
  networks = NULL,
  measures = c("betweenness", "degree", "random"),
  strategy = "sequential",
  colors = NULL,
  title = NULL,
  n_iter = 1000,
  seed = NULL,
  type = "vertex",
  ncol = NULL,
  free_y = FALSE
)
Arguments
- ...
Networks, with network names as argument names. Unnamed networks are labelled "Network 1", "Network 2", and so on.
- networks
Named list of networks, used when
...is empty.- measures
Attack strategies to compare. Default c("betweenness", "degree", "random").
- strategy
Character string; "sequential" (default) recalculates centrality after each removal, "static" uses initial centrality ranking throughout.
- colors
Vector of colors named "Betweenness", "Degree" and "Random". Default NULL uses red, green and blue.
- title
Overall title. Default NULL. With a single network the title is replaced by "
: sequential removal of nodes". - n_iter
Iterations for random. Default 1000.
- seed
Random seed. Default NULL.
- type
Removal type. Default "vertex".
- ncol
Columns in facet. Default NULL (auto).
- free_y
If TRUE, allow different y-axis scales per facet. Default FALSE.