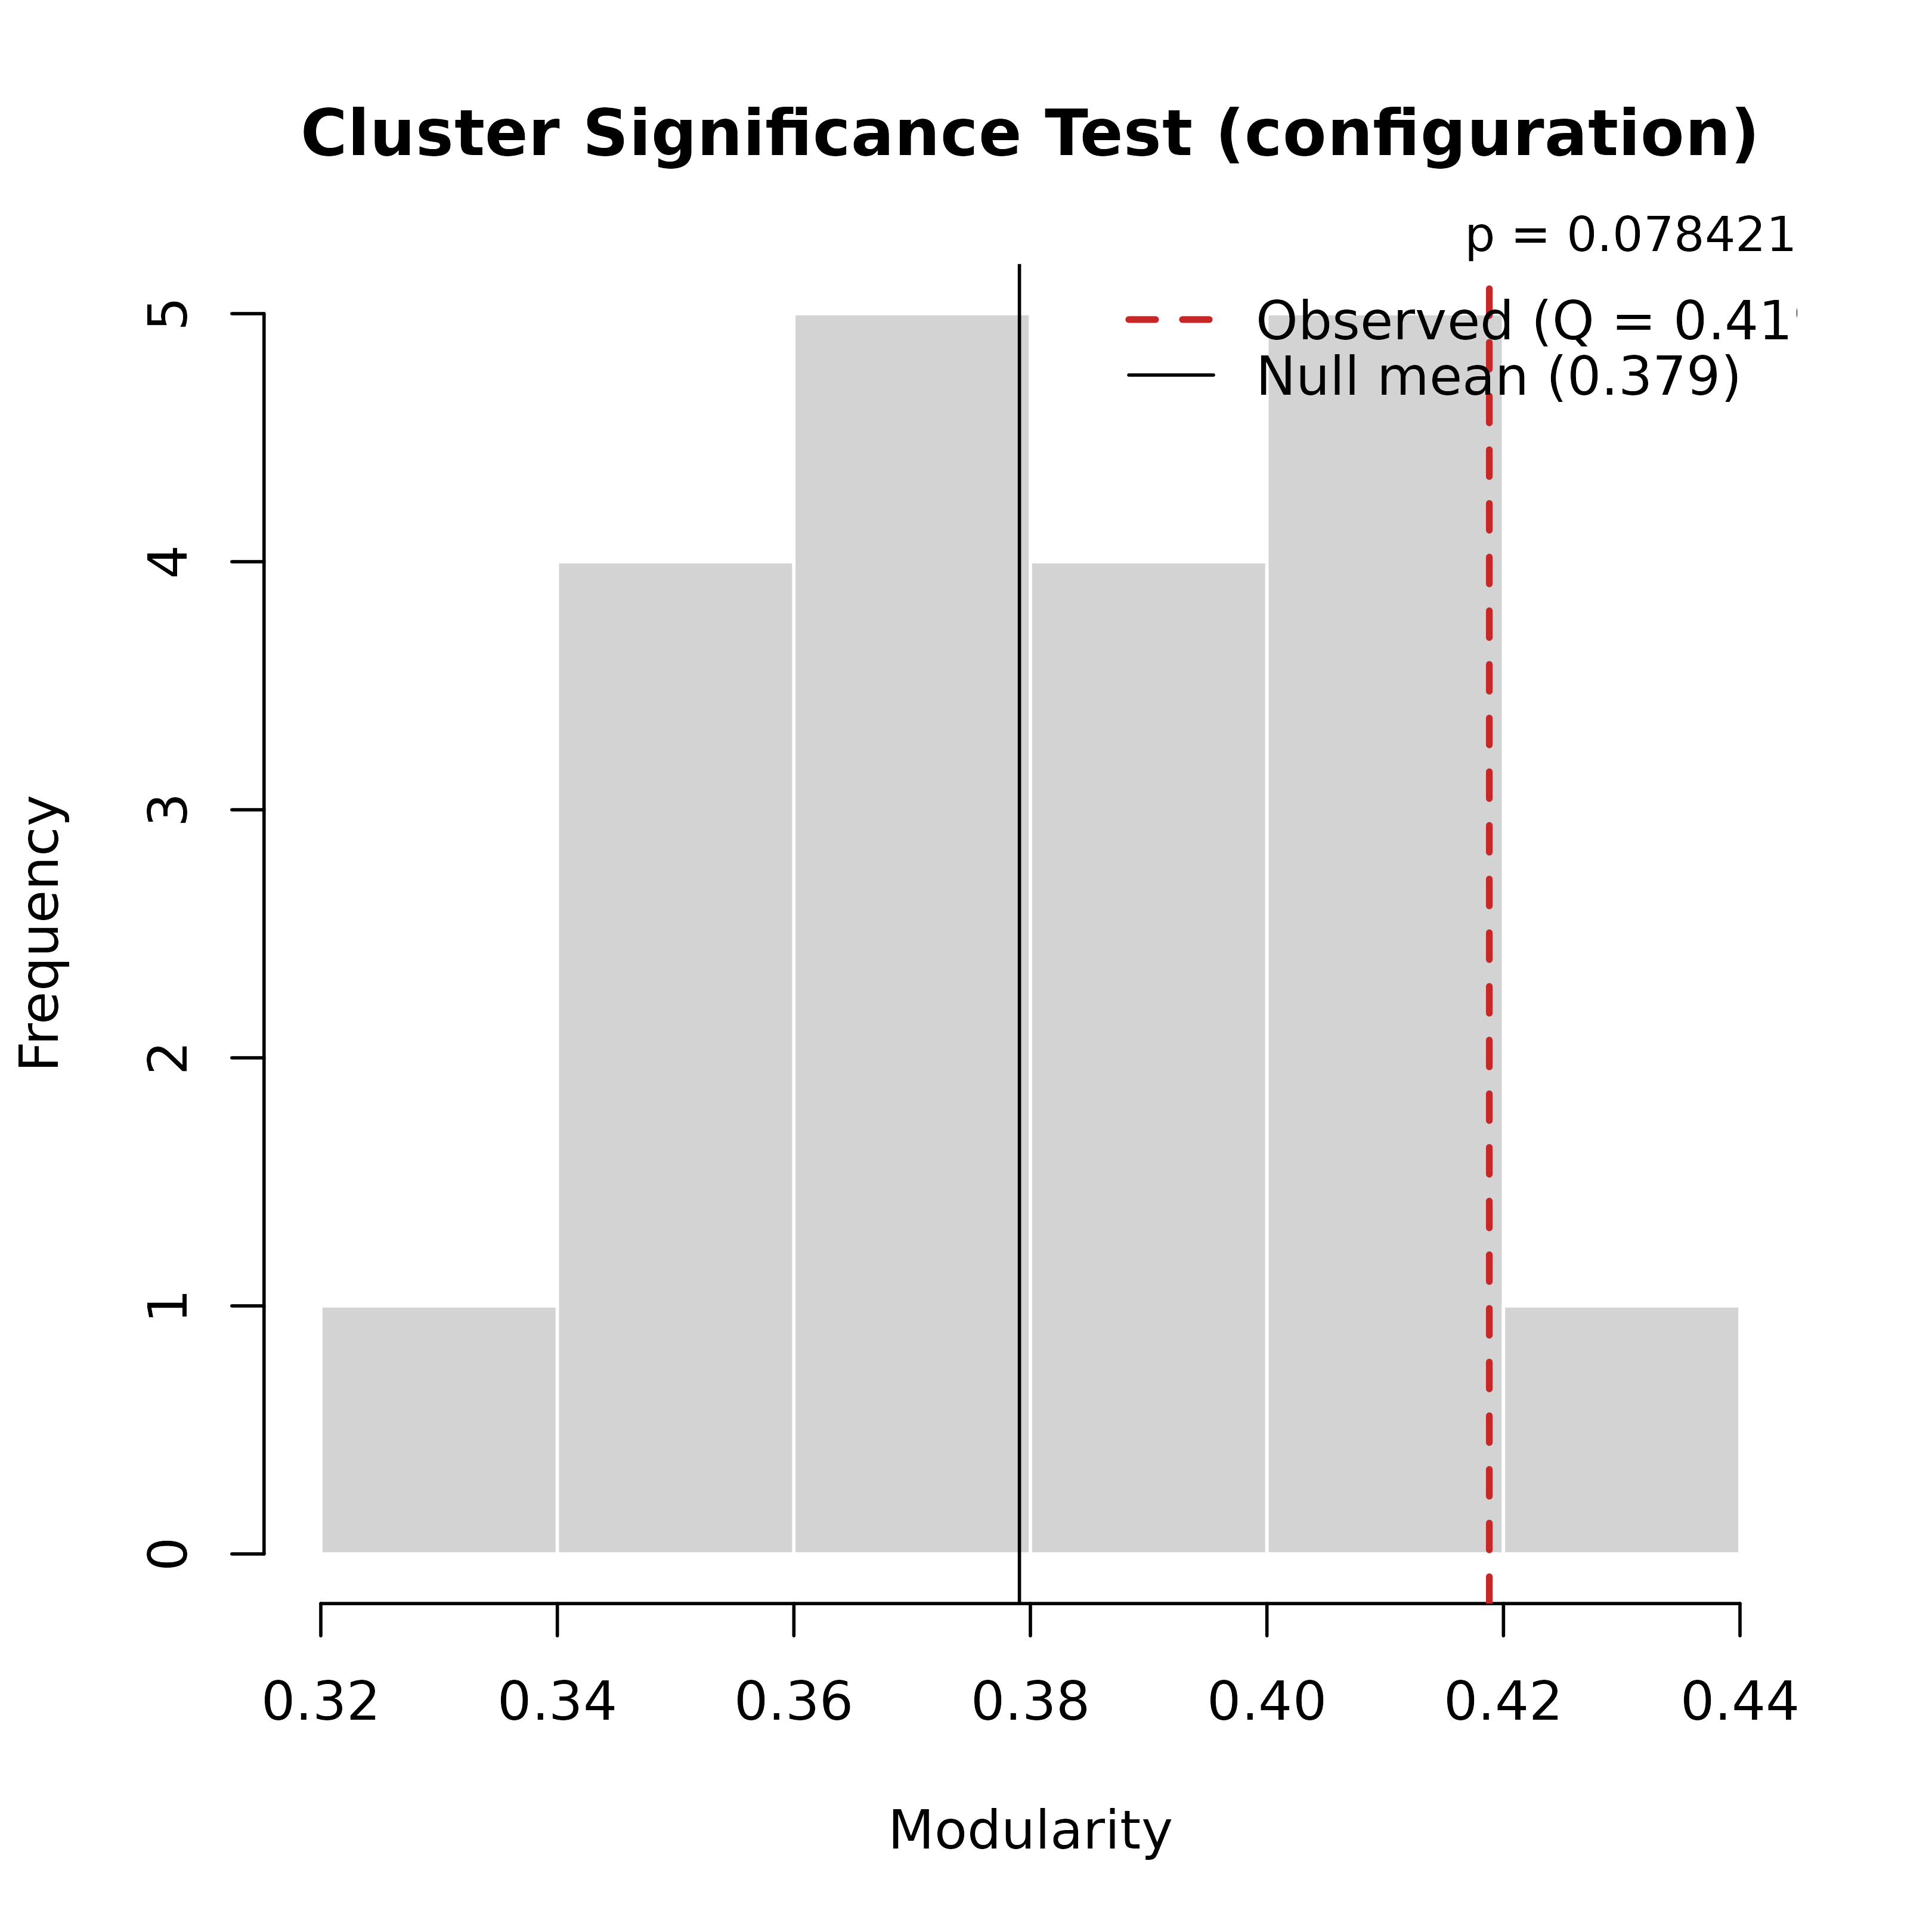
Creates a histogram of the null distribution with the observed value marked.
Usage
# S3 method for class 'cograph_cluster_significance'
plot(x, ...)Examples
g <- igraph::make_graph("Zachary")
comm <- community_louvain(g)
sig <- cluster_significance(g, comm, n_random = 20, seed = 42)
plot(sig)