Visualizes network with community coloring using splot.
Usage
# S3 method for class 'cograph_communities'
plot(x, network = NULL, ...)Examples
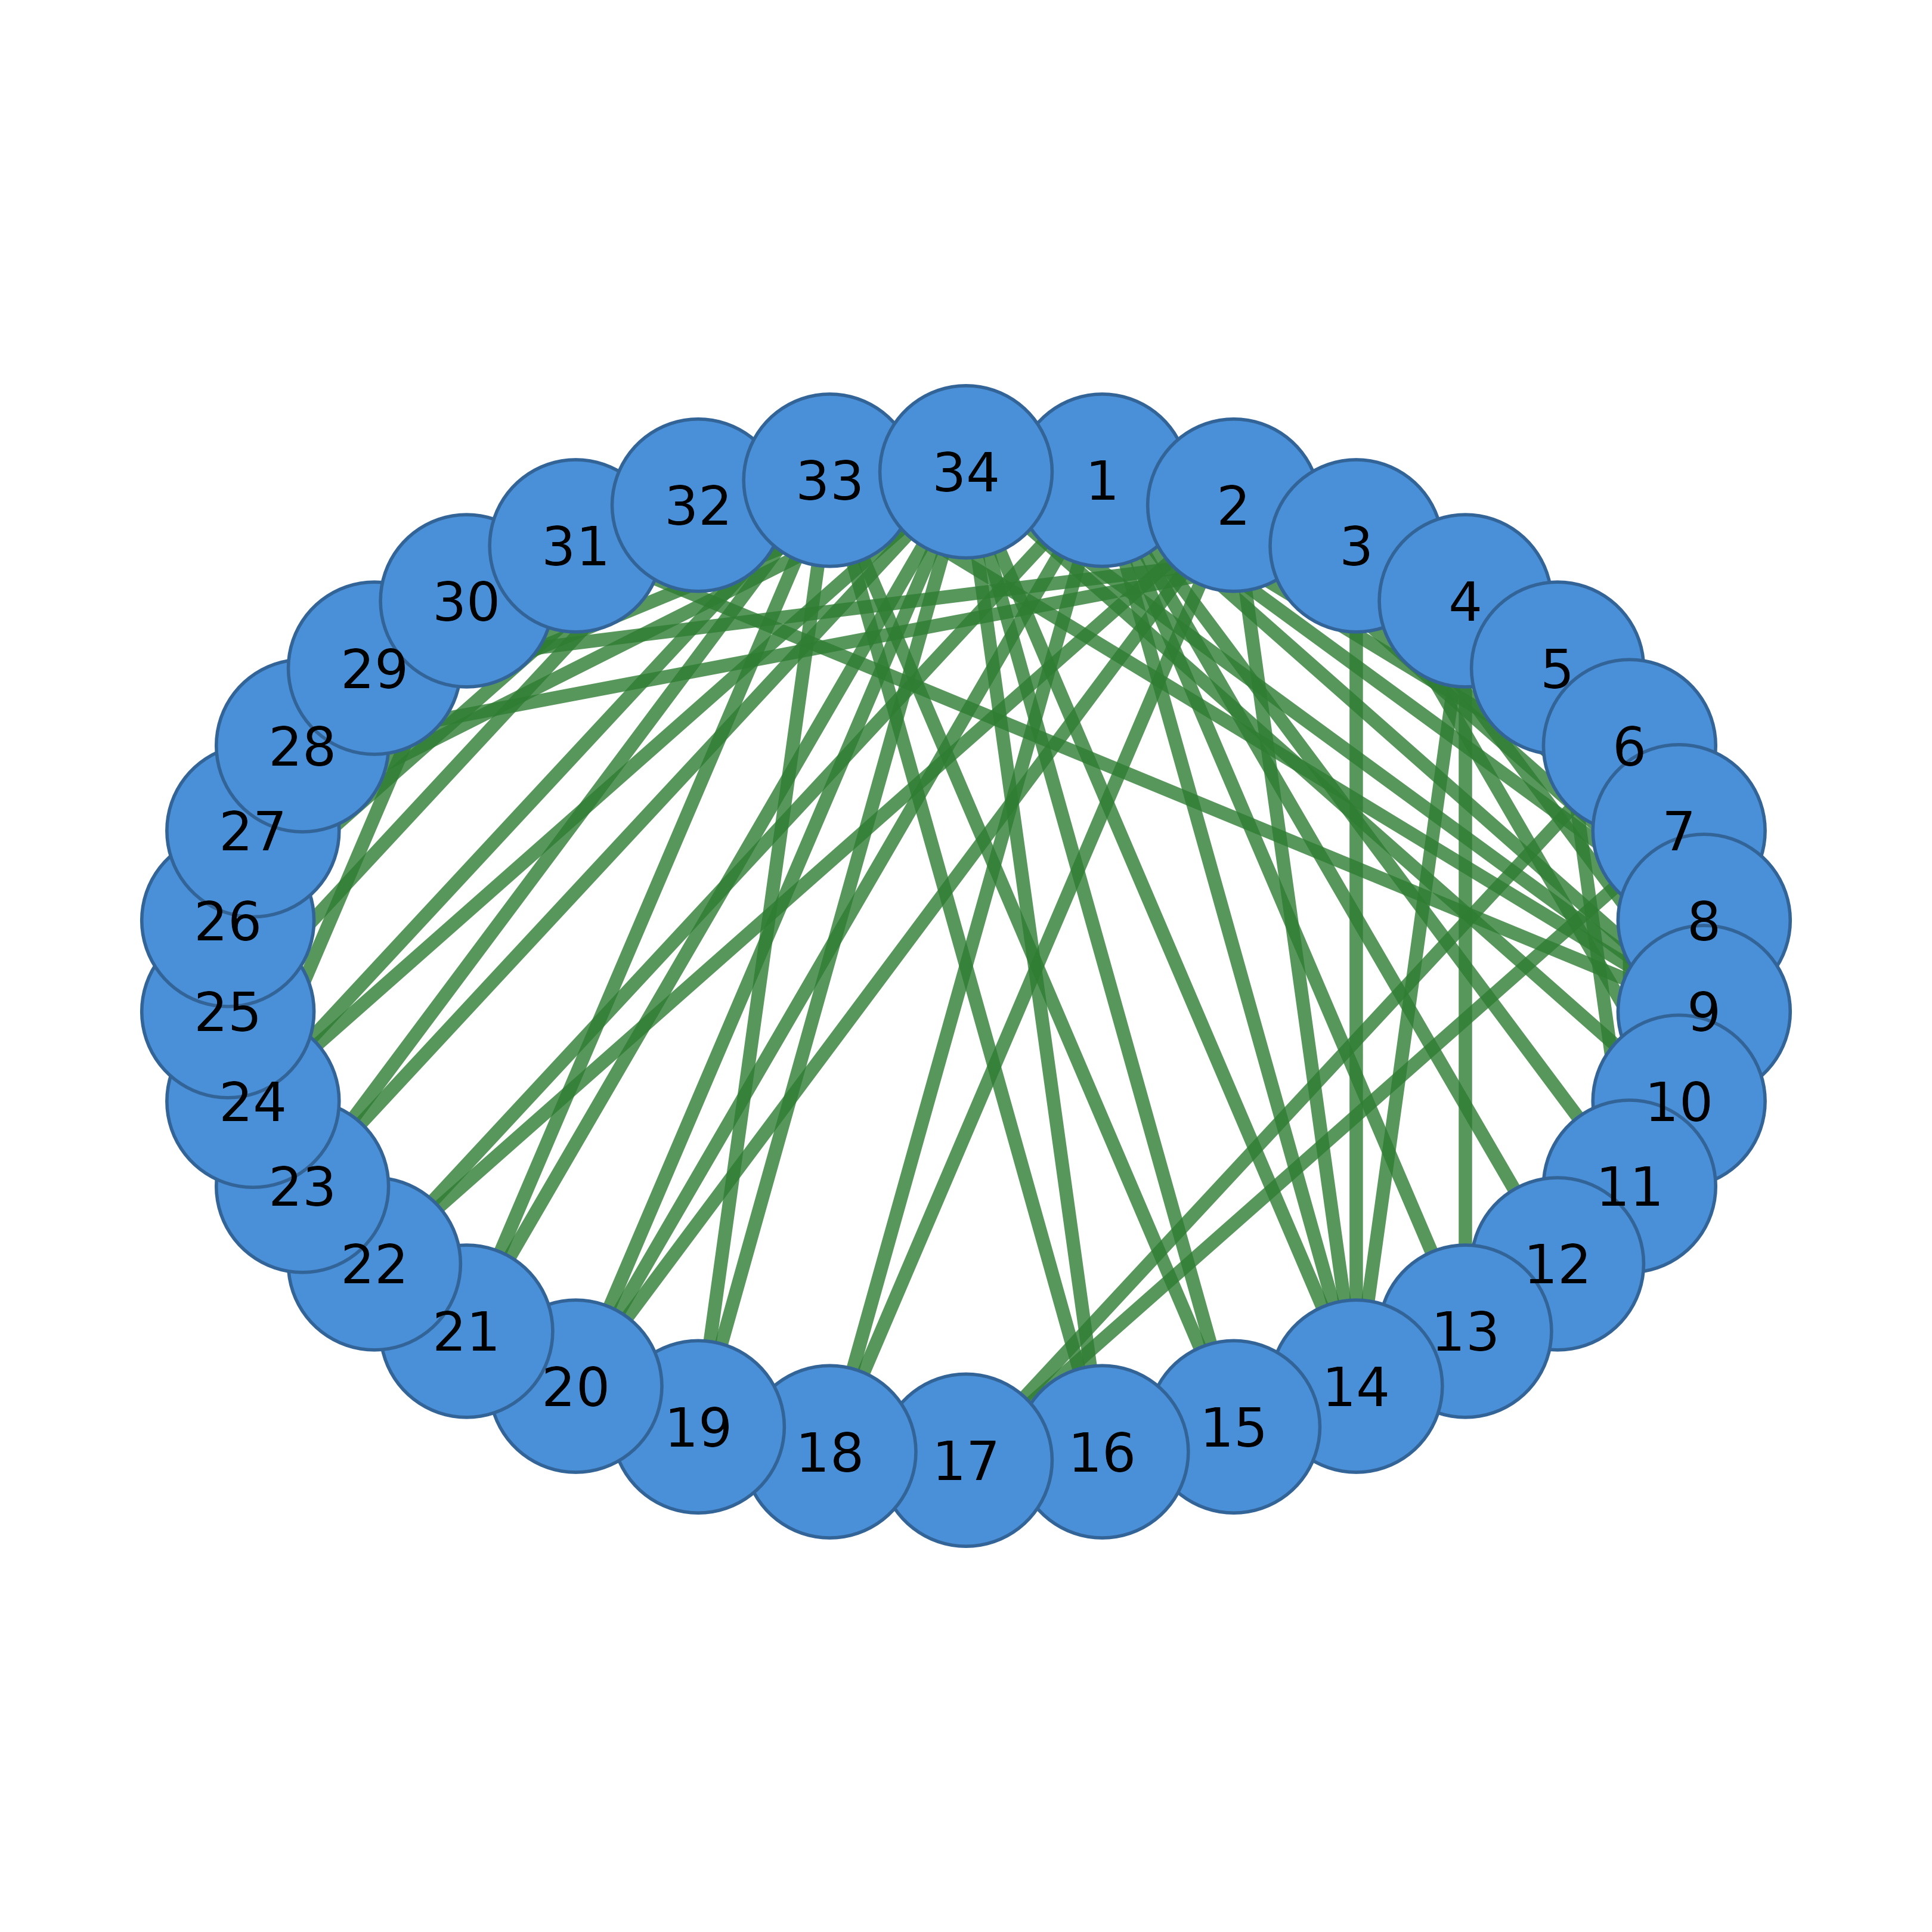
g <- igraph::make_graph("Zachary")
comm <- community_louvain(g)
mat <- igraph::as_adjacency_matrix(g, sparse = FALSE)
plot(comm, network = mat)