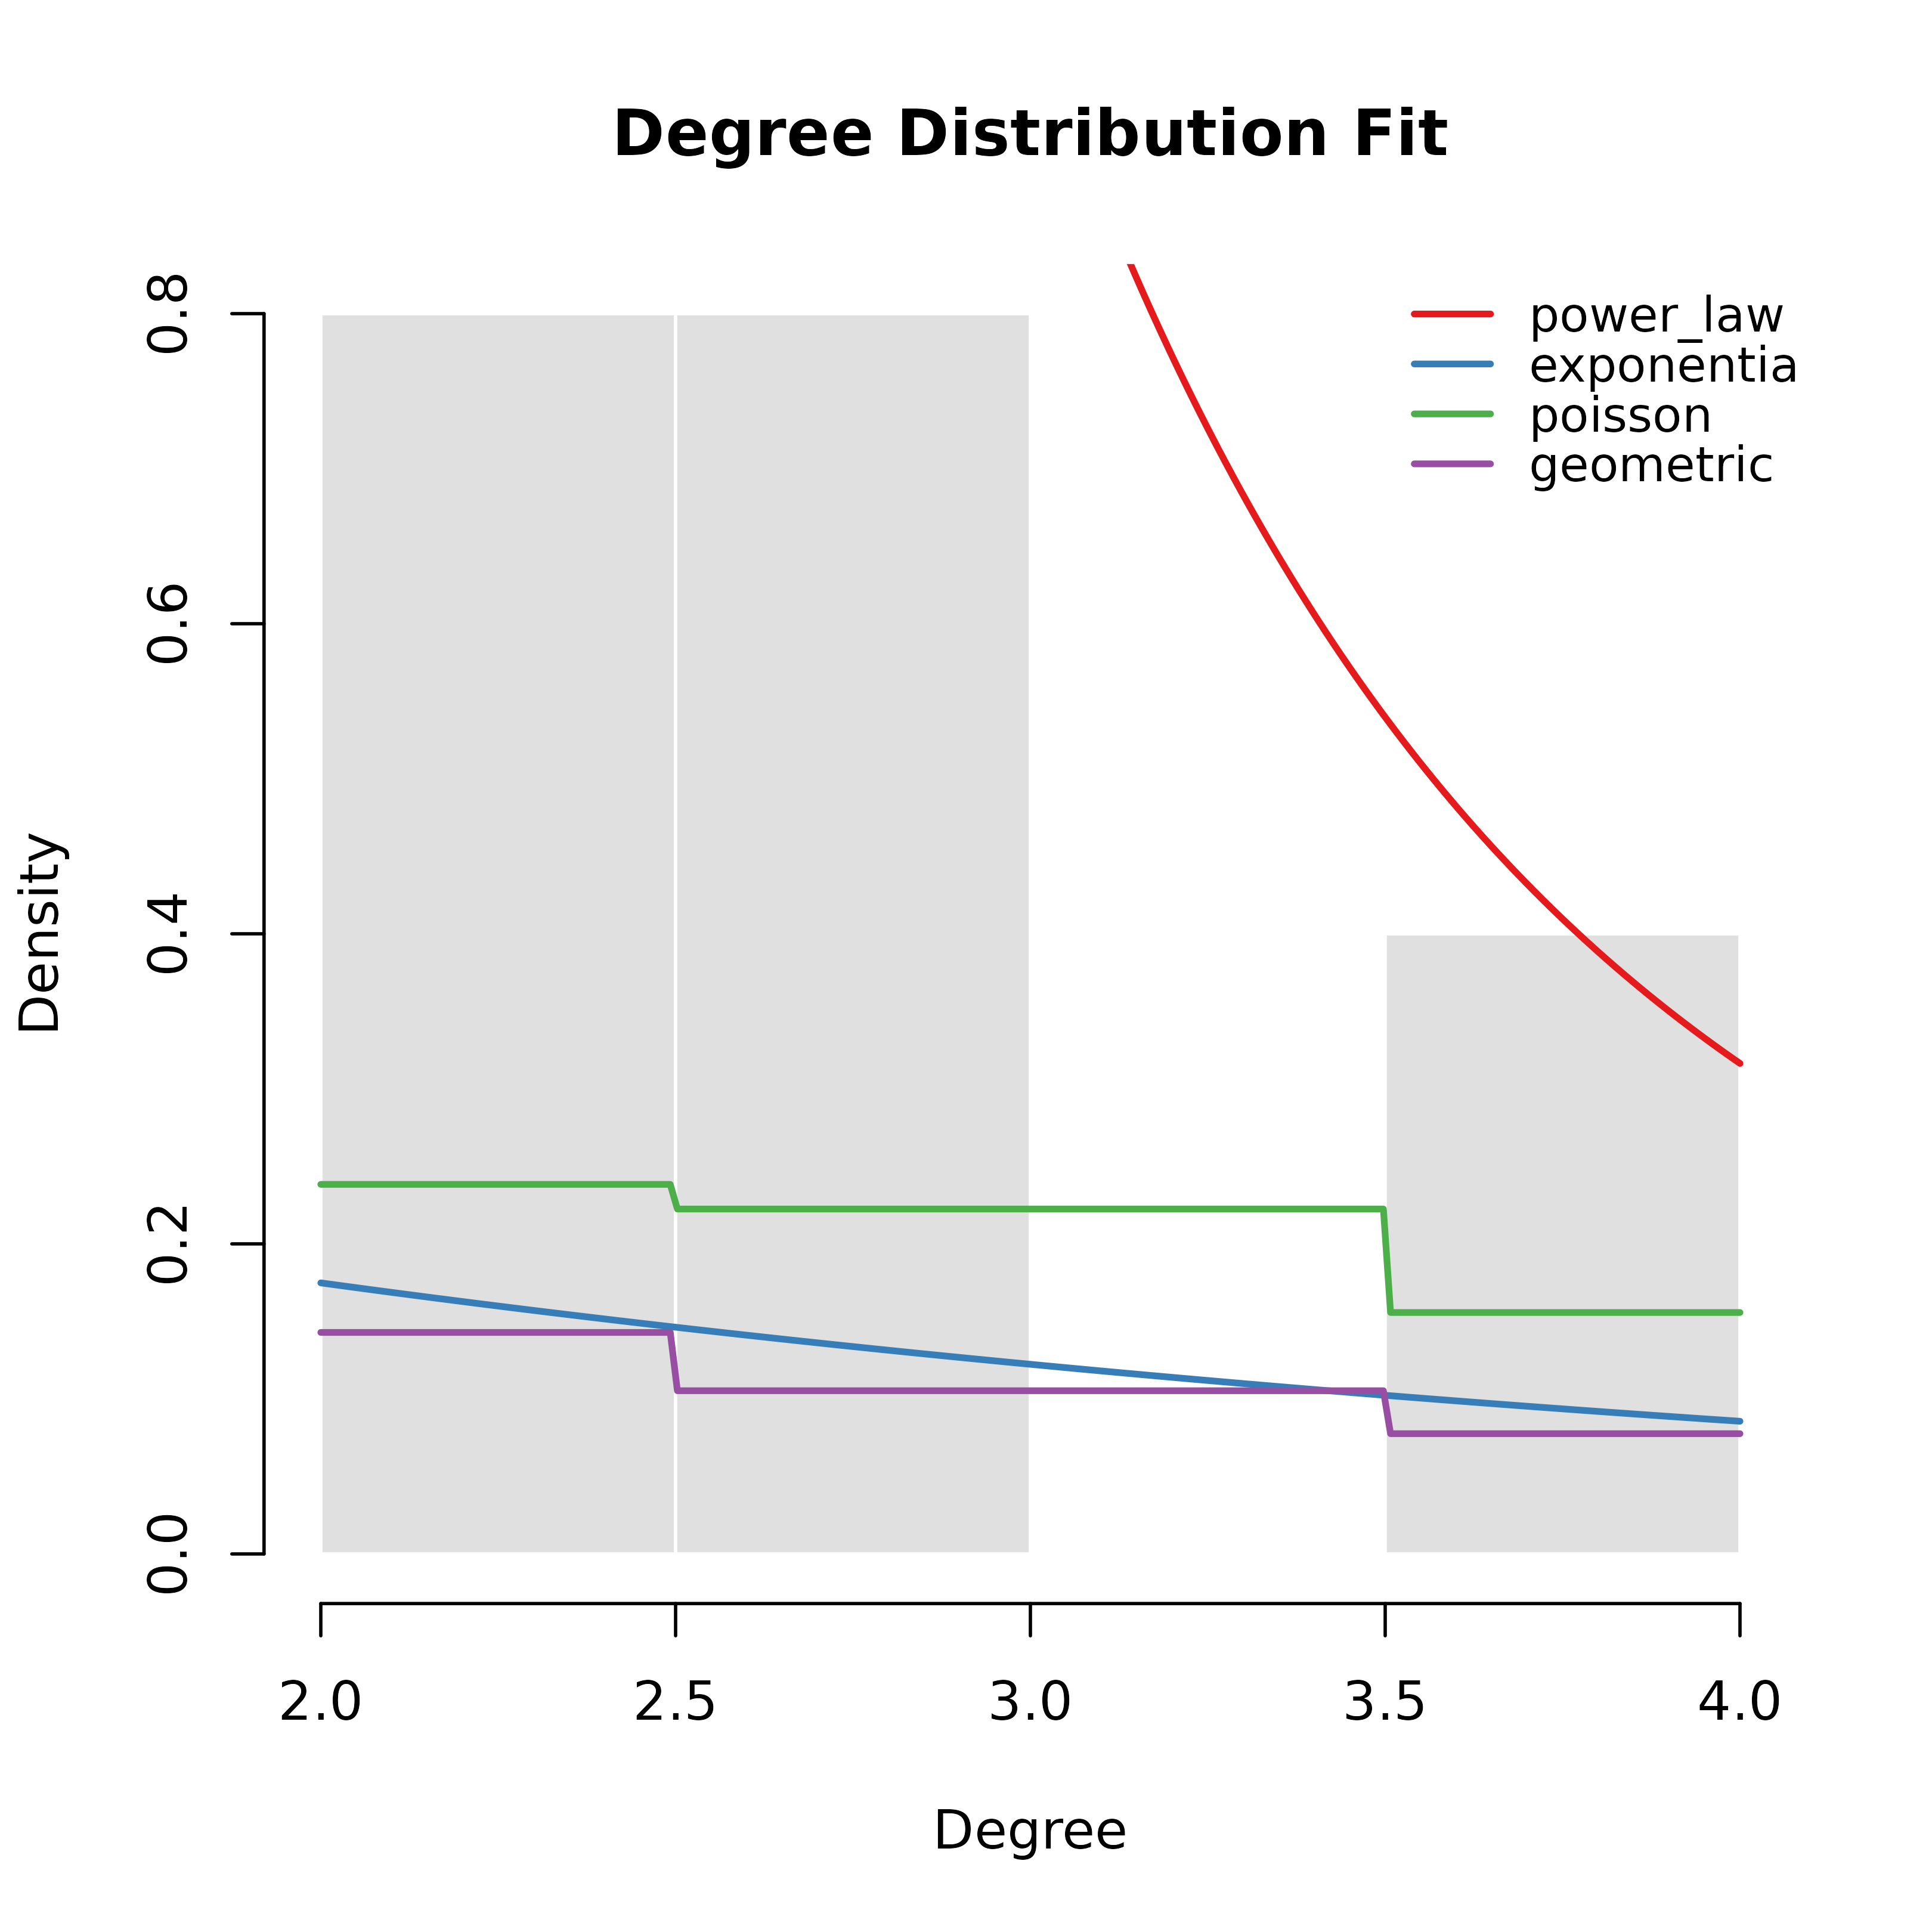
Overlays fitted distribution curves on a histogram of observed degrees.
Usage
# S3 method for class 'cograph_degree_fit'
plot(
  x,
  which = NULL,
  log = "",
  cols = NULL,
  lwd = 2,
  main = "Degree Distribution Fit",
  ...
)
Arguments
- x
A
cograph_degree_fitobject fromfit_degree_distribution.- which
Character vector of distribution names to display. Default
NULLshows all fitted distributions.- log
Character string for log-scale axes:
""(default),"y", or"xy". Values containing"x"are accepted for compatibility but only filter non-positive fitted curve values.- cols
Named or unnamed character vector of colors for distribution curves. Default uses a built-in palette.
- lwd
Line width for fitted curves. Default 2.
- main
Plot title. Default
"Degree Distribution Fit".- ...
Additional arguments passed to
hist.
Examples
adj <- matrix(c(0, 1, 1, 0, 0, 1, 0, 1, 1, 0,
                1, 1, 0, 1, 1, 0, 1, 1, 0, 1,
                0, 0, 1, 1, 0), 5, 5, byrow = TRUE)
fit <- cograph::fit_degree_distribution(adj)
#> Warning: ties should not be present for the one-sample Kolmogorov-Smirnov test
plot(fit)