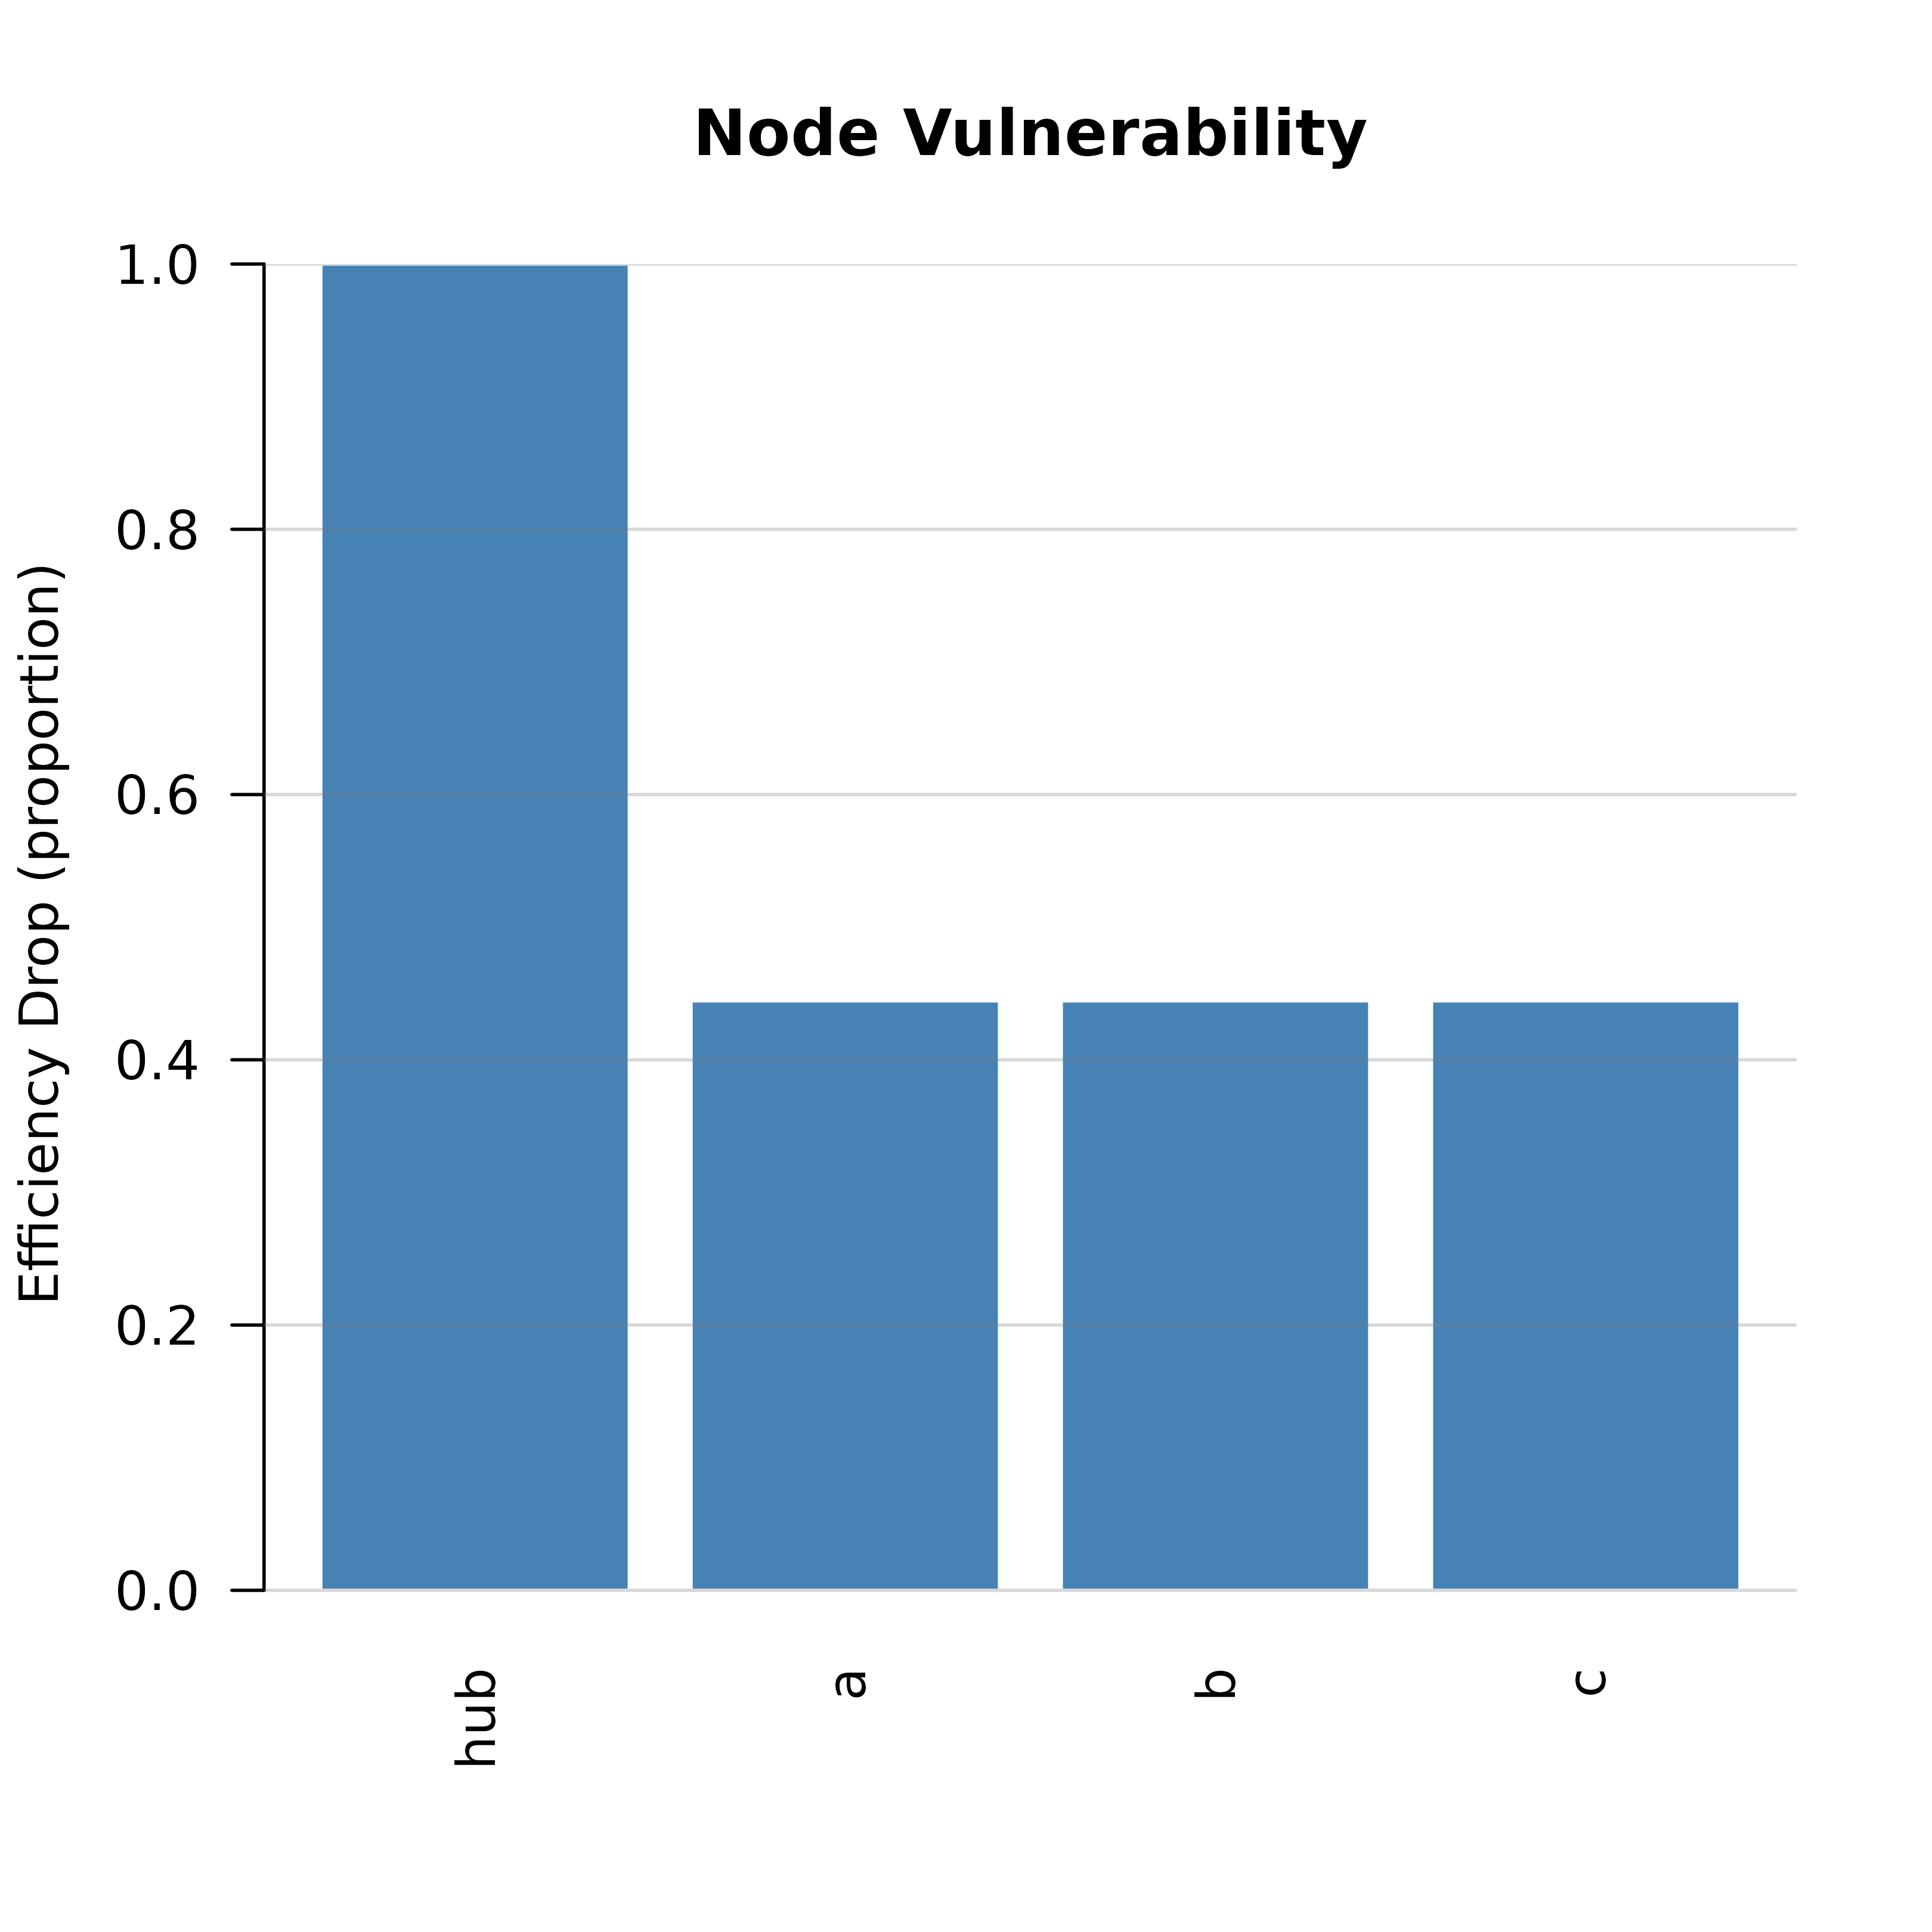
Plot Node Vulnerability
Usage
# S3 method for class 'cograph_vulnerability'
plot(x, top = NULL, col = "steelblue", ...)
Arguments
- x
A
cograph_vulnerabilityobject.- top
Integer or NULL. Show only top N nodes. Default NULL (all).
- col
Bar color. Default
"steelblue".- ...
Additional arguments passed to
barplot.