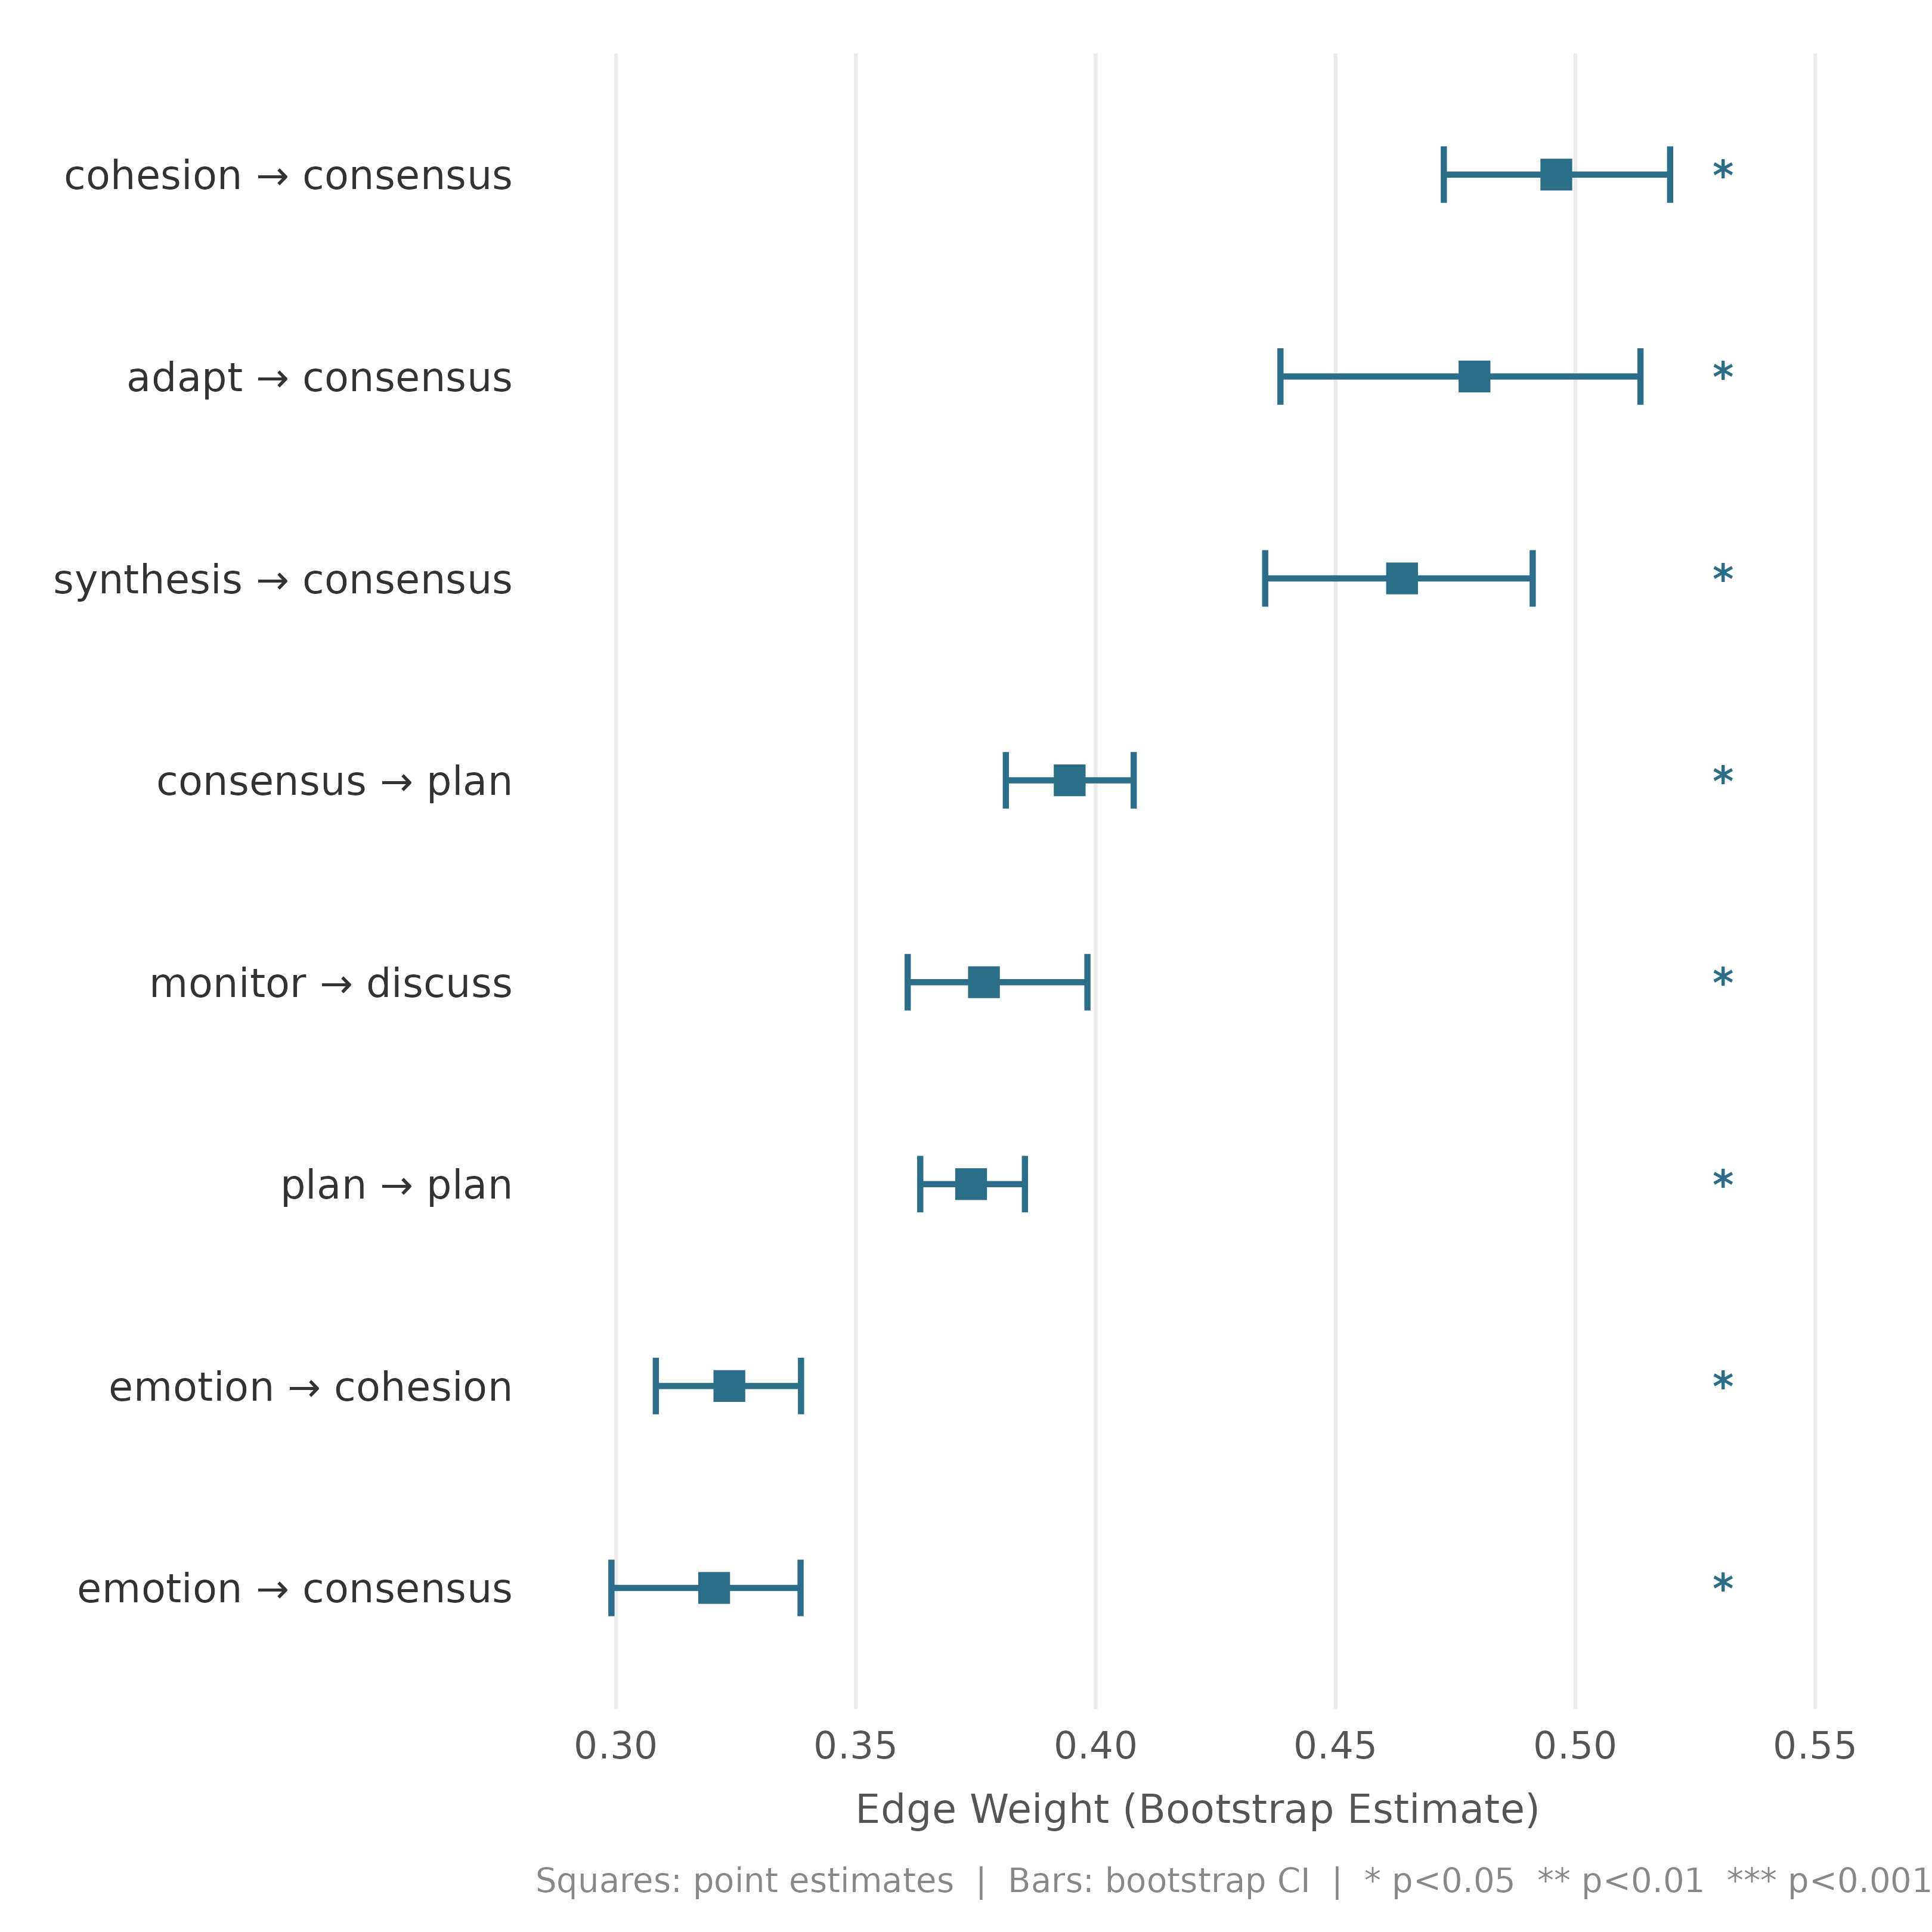
Plots bootstrap results of net_bootstrap,
net_bootstrap_group, tna_bootstrap and boot_glasso
objects as a ggplot2 forest plot. Each row is one non-zero network edge.
A square marks the point estimate, a horizontal bar spans the selected
interval, and a dashed reference line marks zero. Significant edges are
plotted in sig_color and non-significant edges in a faded
nonsig_color.
Usage
plot_bootstrap_forest(x, ...)

# S3 method for class 'net_bootstrap'
plot_bootstrap_forest(
  x,
  alpha = NULL,
  layout = c("linear", "circular", "grouped"),
  interval = c("ci", "cr", "both"),
  show_nonsig = TRUE,
  sort_by = c("estimate", "significance", "name"),
  n_top = NULL,
  node_colors = NULL,
  sig_color = "#2C6E8A",
  cr_color = "#D4829A",
  nonsig_color = "#CCCCCC",
  ring_color = "#C8C8C8",
  median_color = "#AAAAAA",
  label_size = NULL,
  label_color = NULL,
  point_size = NULL,
  r_inner = NULL,
  r_outer = NULL,
  gap_rad = NULL,
  label_offset = NULL,
  src_label_size = NULL,
  margins = c(0.1, 0.1, 0.1, 0.1),
  scale = 1,
  title = NULL,
  subtitle = NULL,
  ...
)

# S3 method for class 'tna_bootstrap'
plot_bootstrap_forest(
  x,
  alpha = NULL,
  layout = c("linear", "circular", "grouped"),
  interval = c("ci", "cr", "both"),
  show_nonsig = TRUE,
  sort_by = c("estimate", "significance", "name"),
  n_top = NULL,
  node_colors = NULL,
  sig_color = "#2C6E8A",
  cr_color = "#D4829A",
  nonsig_color = "#CCCCCC",
  ring_color = "#C8C8C8",
  median_color = "#AAAAAA",
  label_size = NULL,
  label_color = NULL,
  point_size = NULL,
  r_inner = NULL,
  r_outer = NULL,
  gap_rad = NULL,
  label_offset = NULL,
  src_label_size = NULL,
  margins = c(0.1, 0.1, 0.1, 0.1),
  scale = 1,
  title = NULL,
  subtitle = NULL,
  ...
)

# S3 method for class 'boot_glasso'
plot_bootstrap_forest(
  x,
  alpha = NULL,
  layout = c("linear", "circular", "grouped"),
  interval = c("ci", "cr", "both"),
  show_nonsig = TRUE,
  sort_by = c("estimate", "significance", "name"),
  n_top = NULL,
  node_colors = NULL,
  sig_color = "#2C6E8A",
  cr_color = "#D4829A",
  nonsig_color = "#CCCCCC",
  ring_color = "#C8C8C8",
  median_color = "#AAAAAA",
  label_size = NULL,
  label_color = NULL,
  point_size = NULL,
  r_inner = NULL,
  r_outer = NULL,
  gap_rad = NULL,
  label_offset = NULL,
  src_label_size = NULL,
  margins = c(0.1, 0.1, 0.1, 0.1),
  scale = 1,
  title = NULL,
  subtitle = NULL,
  ...
)

# S3 method for class 'net_bootstrap_group'
plot_bootstrap_forest(
  x,
  layout = c("linear", "circular"),
  interval = c("ci", "cr", "both"),
  show_nonsig = TRUE,
  n_top = NULL,
  all_edges = FALSE,
  pos_color = NULL,
  title = NULL,
  subtitle = NULL,
  label_size = 2.8,
  ...
)
Arguments
- x
A
tna_bootstrap(fromtna::bootstrap),net_bootstrap,net_bootstrap_group, orboot_glassoobject.- ...
Currently unused.
- alpha
Significance threshold. Default
NULL, which inherits from the object:$ci_levelfornet_bootstrap,$levelfortna_bootstrap,$alphaforboot_glasso, each falling back to0.05.- layout
"linear"(default) gives the standard forest plot;"circular"arranges each edge as a spoke around a circle, with the inner ring at the smallest lower bound and the outer ring just beyond the largest upper bound;"grouped"arranges edges in sectors by source node. Thenet_bootstrap_groupmethod supports"linear"and"circular"only.- interval
Which interval to display:
"ci"(bootstrap confidence interval, default),"cr"(consistency range, stability inference only), or"both"(CI as outer bar, CR as inner bar).- show_nonsig
Logical. Include non-significant edges. Default
TRUE.- sort_by
Order of edges on the y-axis in the linear layout:
"estimate"(default, ascending),"significance"(most significant at top), or"name"(alphabetical). Whenn_topis set, the retained edges are ordered by estimate. The circular layout orders edges alphabetically, clockwise from the top.- n_top
Integer. Keeps only the
n_topedges with the largest absolute estimate. Applied after significance filtering. DefaultNULL.- node_colors
Optional named vector of node colors for the grouped layout. When NULL, node colors stored in the original network or tna model are used if present.
- sig_color
Color for significant CI bars and points (linear and circular layouts). Default
"#2C6E8A"(teal-blue).- cr_color
Color for the consistency range bar (
interval = "cr"or"both"). Default"#D4829A".- nonsig_color
Color for non-significant edges (linear and circular layouts). Default
"#CCCCCC".- ring_color
Color for the reference rings (circular and grouped layouts). Default
"#C8C8C8".- median_color
Color for the dashed median ring (circular and grouped layouts). Default
"#AAAAAA".- label_size
Text size for edge labels (circular and grouped layouts). Default
NULL, which gives2.9in the circular layout and automatic sizing in the grouped layout. Thenet_bootstrap_groupmethod defaults to2.8.- label_color
Fixed color for edge labels (circular and grouped layouts).
NULL(default) uses the edge color.- point_size
Size of the estimate square. Default
NULL, which gives3(linear),2(circular), or automatic sizing (grouped).- r_inner
Inner ring radius (grouped layout). Default
NULL(auto).- r_outer
Outer ring radius (grouped layout). Default
NULL(auto).- gap_rad
Gap in radians between sectors (grouped layout). Default
NULL(auto).- label_offset
Distance between outer ring and labels (grouped layout). Default
NULL(auto).- src_label_size
Text size for source node labels in the center (grouped layout). Default
NULL(auto,label_size * 0.80).- margins
Margins as
c(bottom, left, top, right)fractions (grouped layout). Defaultc(0.1, 0.1, 0.1, 0.1).- scale
Scaling factor applied to all text and point sizes (grouped layout). Default
1. Use values > 1 for high-DPI output, < 1 for small devices.- title
Plot title. Default
NULL.- subtitle
Plot subtitle. Default
NULL.- all_edges
For
net_bootstrap_group, show the union of group edges instead of only edges common to all groups. DefaultFALSE.- pos_color
Currently unused by the
net_bootstrap_groupmethod.
Details
Objects from stability inference (net_bootstrap and
tna_bootstrap) carry both a bootstrap confidence interval and a
consistency range, and interval = "both" overlays the two. When the
consistency range is requested but absent, a message is issued and the
confidence interval is shown. For boot_glasso, an edge is
significant when its inclusion proportion is at least 1 - alpha.
The net_bootstrap_group method plots the groups side by side in
the linear layout, with the edges ordered by their mean estimate across
groups. Its interval = "both" shows the confidence interval only,
and its circular layout shows the first group only.