Publication-quality visualization of one or more centrality measures.
Accepts the data frame from centrality directly or any
network input.
Usage
plot_centrality(
  x,
  measures = NULL,
  style = c("line", "bar", "lollipop", "dot"),
  orientation = c("horizontal", "vertical"),
  scale = c("raw", "normalized", "z", "rank"),
  order_by = NULL,
  top_n = NULL,
  highlight = 0L,
  cluster = NULL,
  palette = "cograph",
  ncol = NULL,
  title = NULL,
  subtitle = NULL,
  ...
)
Arguments
- x
Output of
centrality, or any network input (matrix, igraph, cograph_network, tna, netobject).- measures
Character vector of measure names. Default pulls the classical five (degree, strength, betweenness, closeness, eigenvector) when
xis a network; defaultNULLkeeps all columns whenxis already a centrality data frame.- style
Character: "line" (default), "bar", "lollipop", or "dot".
- orientation
Character: "horizontal" (default, nodes on y-axis) or "vertical" (nodes on x-axis).
- scale
Character: "raw" (default, native units; in the "line" style this forces free y-axis per measure via faceting), "normalized" ([0, 1] within measure), "z" (standardized within measure), or "rank" (1..n, highest value = 1).
- order_by
Character. For "bar"/"lollipop": which measure sorts nodes. Defaults to the first measure. Use
"alpha"for alphabetical. For "line", this also controls node ordering unless"alpha"is requested.- top_n
Optional integer to keep only the top-N nodes (by
order_by). Useful for large graphs.- highlight
Optional integer: highlight the top-N bars/lines per measure in full color; mute the rest. Default 0 (no highlighting).
- cluster
Optional named vector or data-frame column mapping each node to a cluster/community. Colors nodes by cluster when supplied.
- palette
Character or vector.
"cograph"(default) uses cograph's teal-gold-leaf palette;"okabe"uses Okabe-Ito;"viridis"uses viridis; or supply a character vector of colors.- ncol
For faceted styles ("bar", "lollipop"): number of columns. Default
NULLchooses sensibly based on measure count.- title
Plot title. Default NULL.
- subtitle
Plot subtitle. Default NULL.
- ...
Passed to
centralitywhenxis a network.
Details
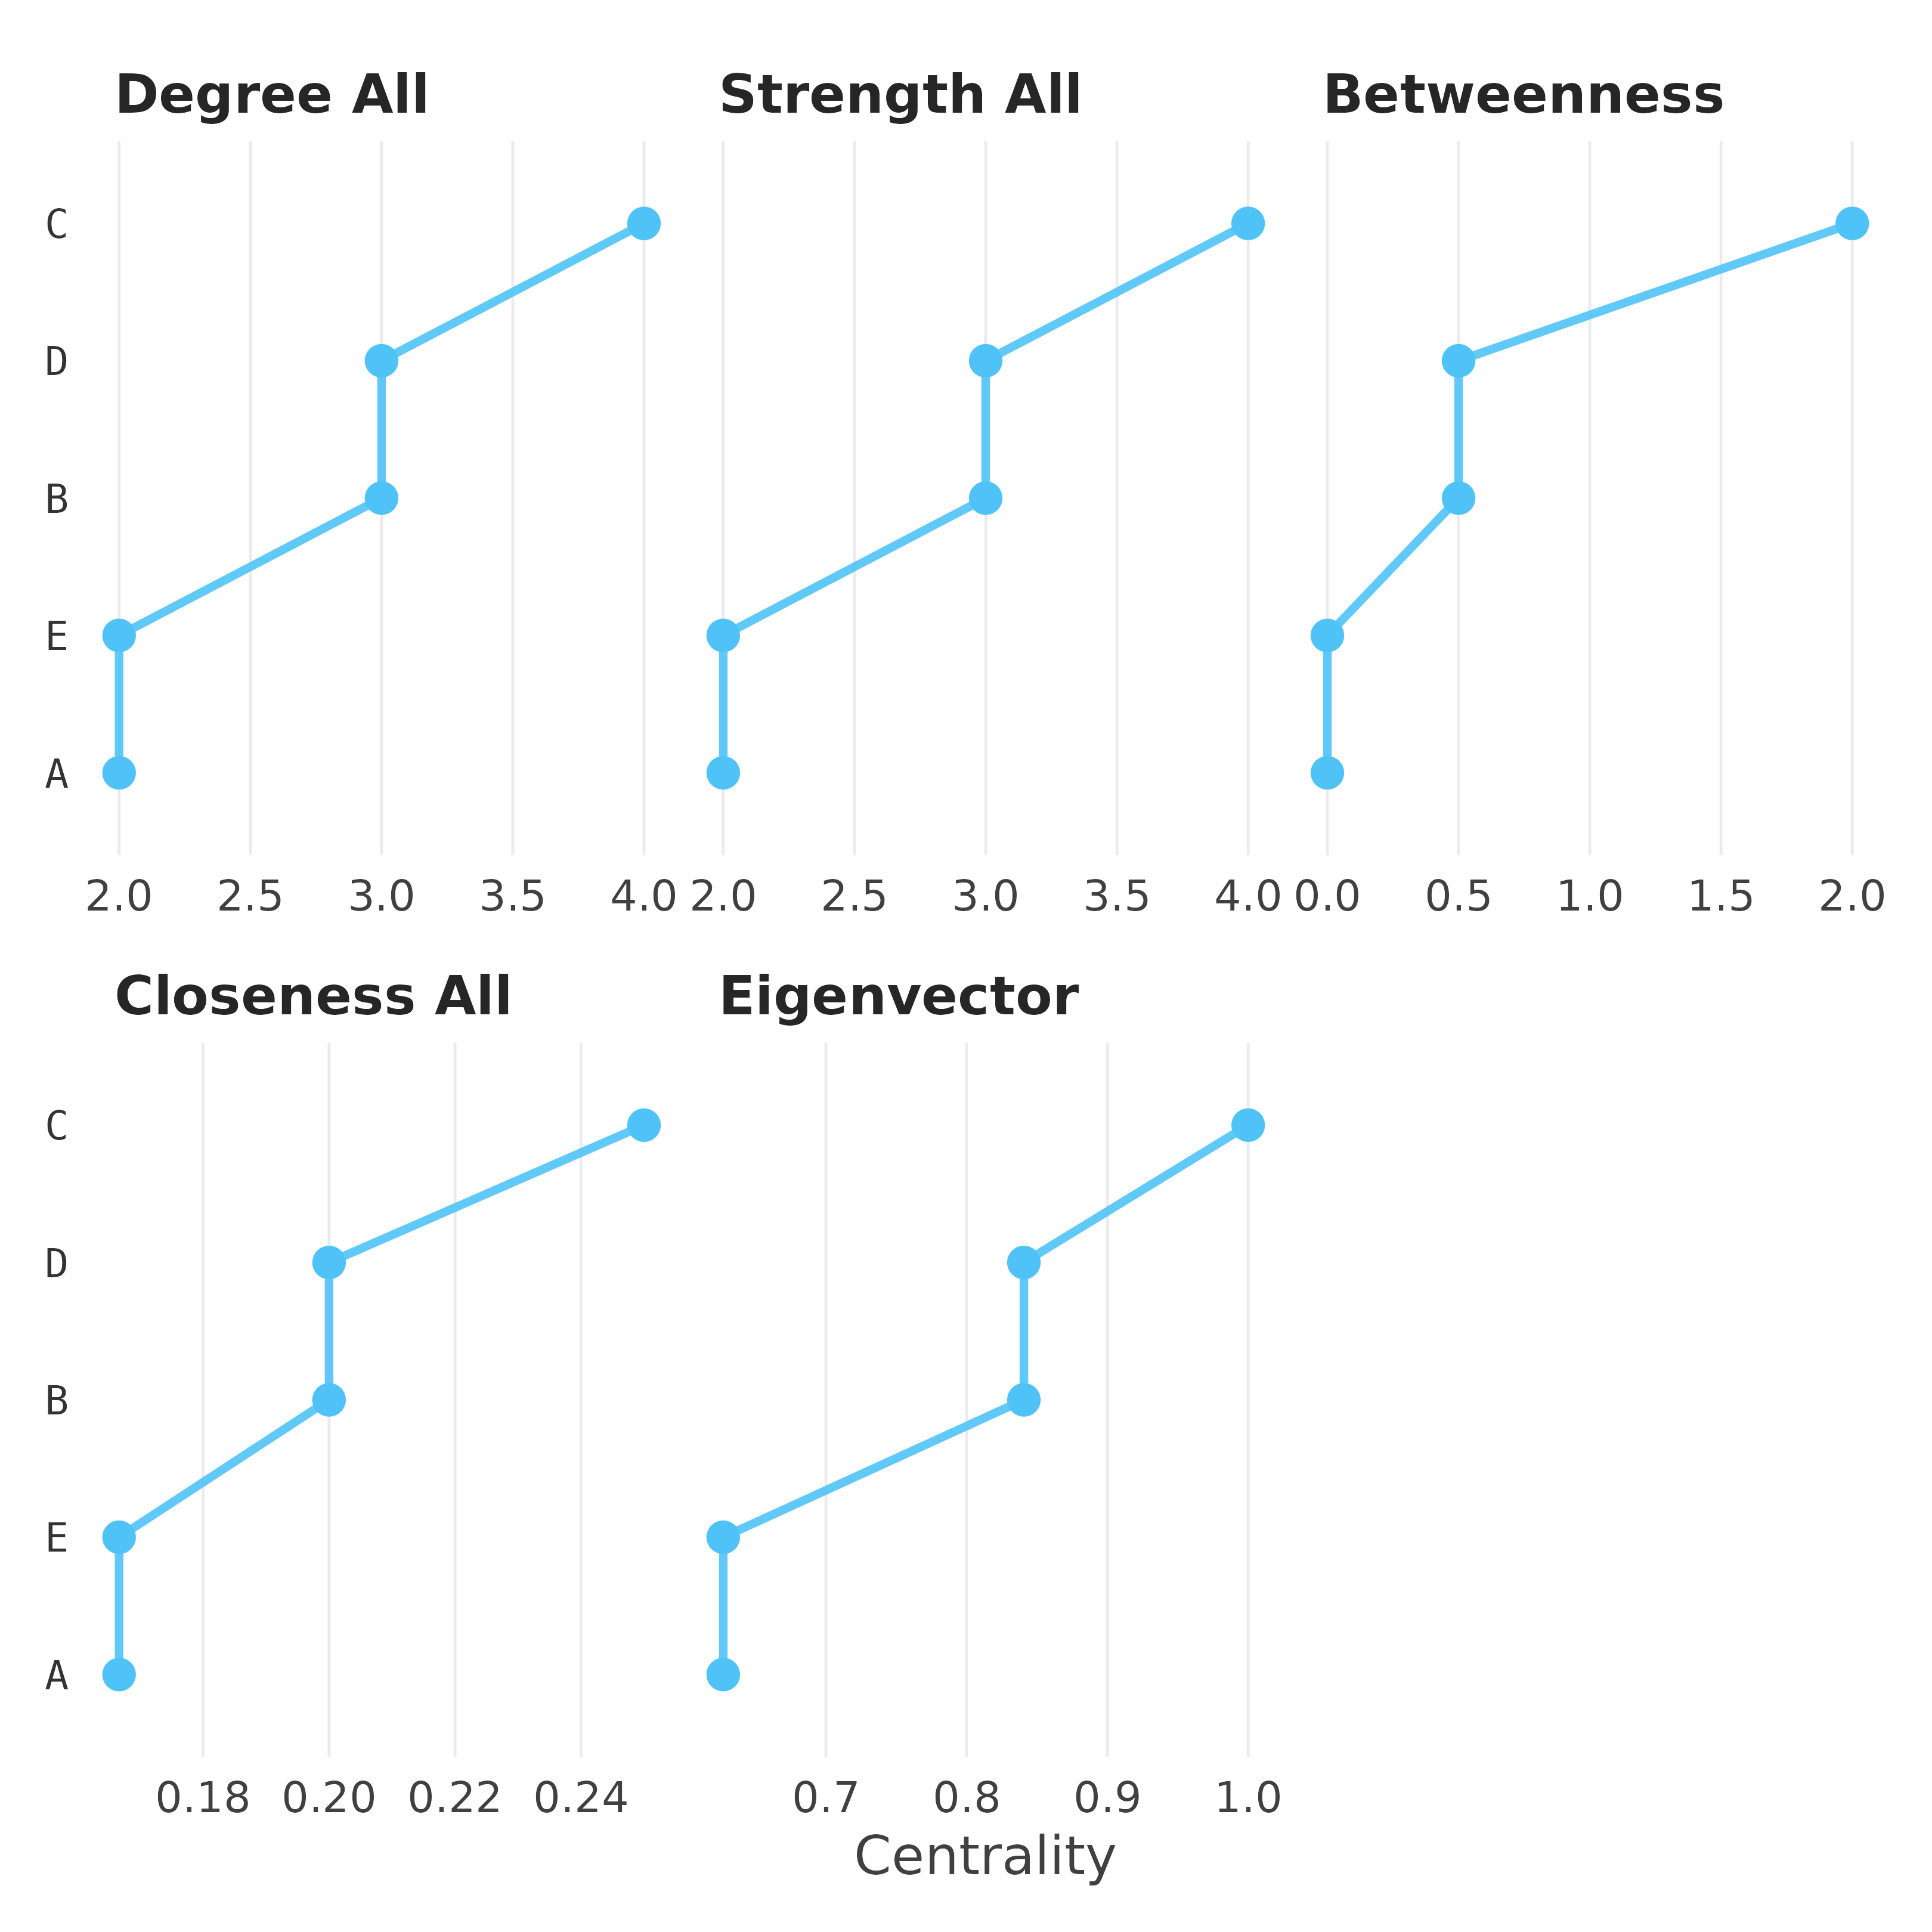
Four styles are available:
"line"Faceted line view with one panel per measure. Nodes are ordered along the requested orientation and connected within each measure.
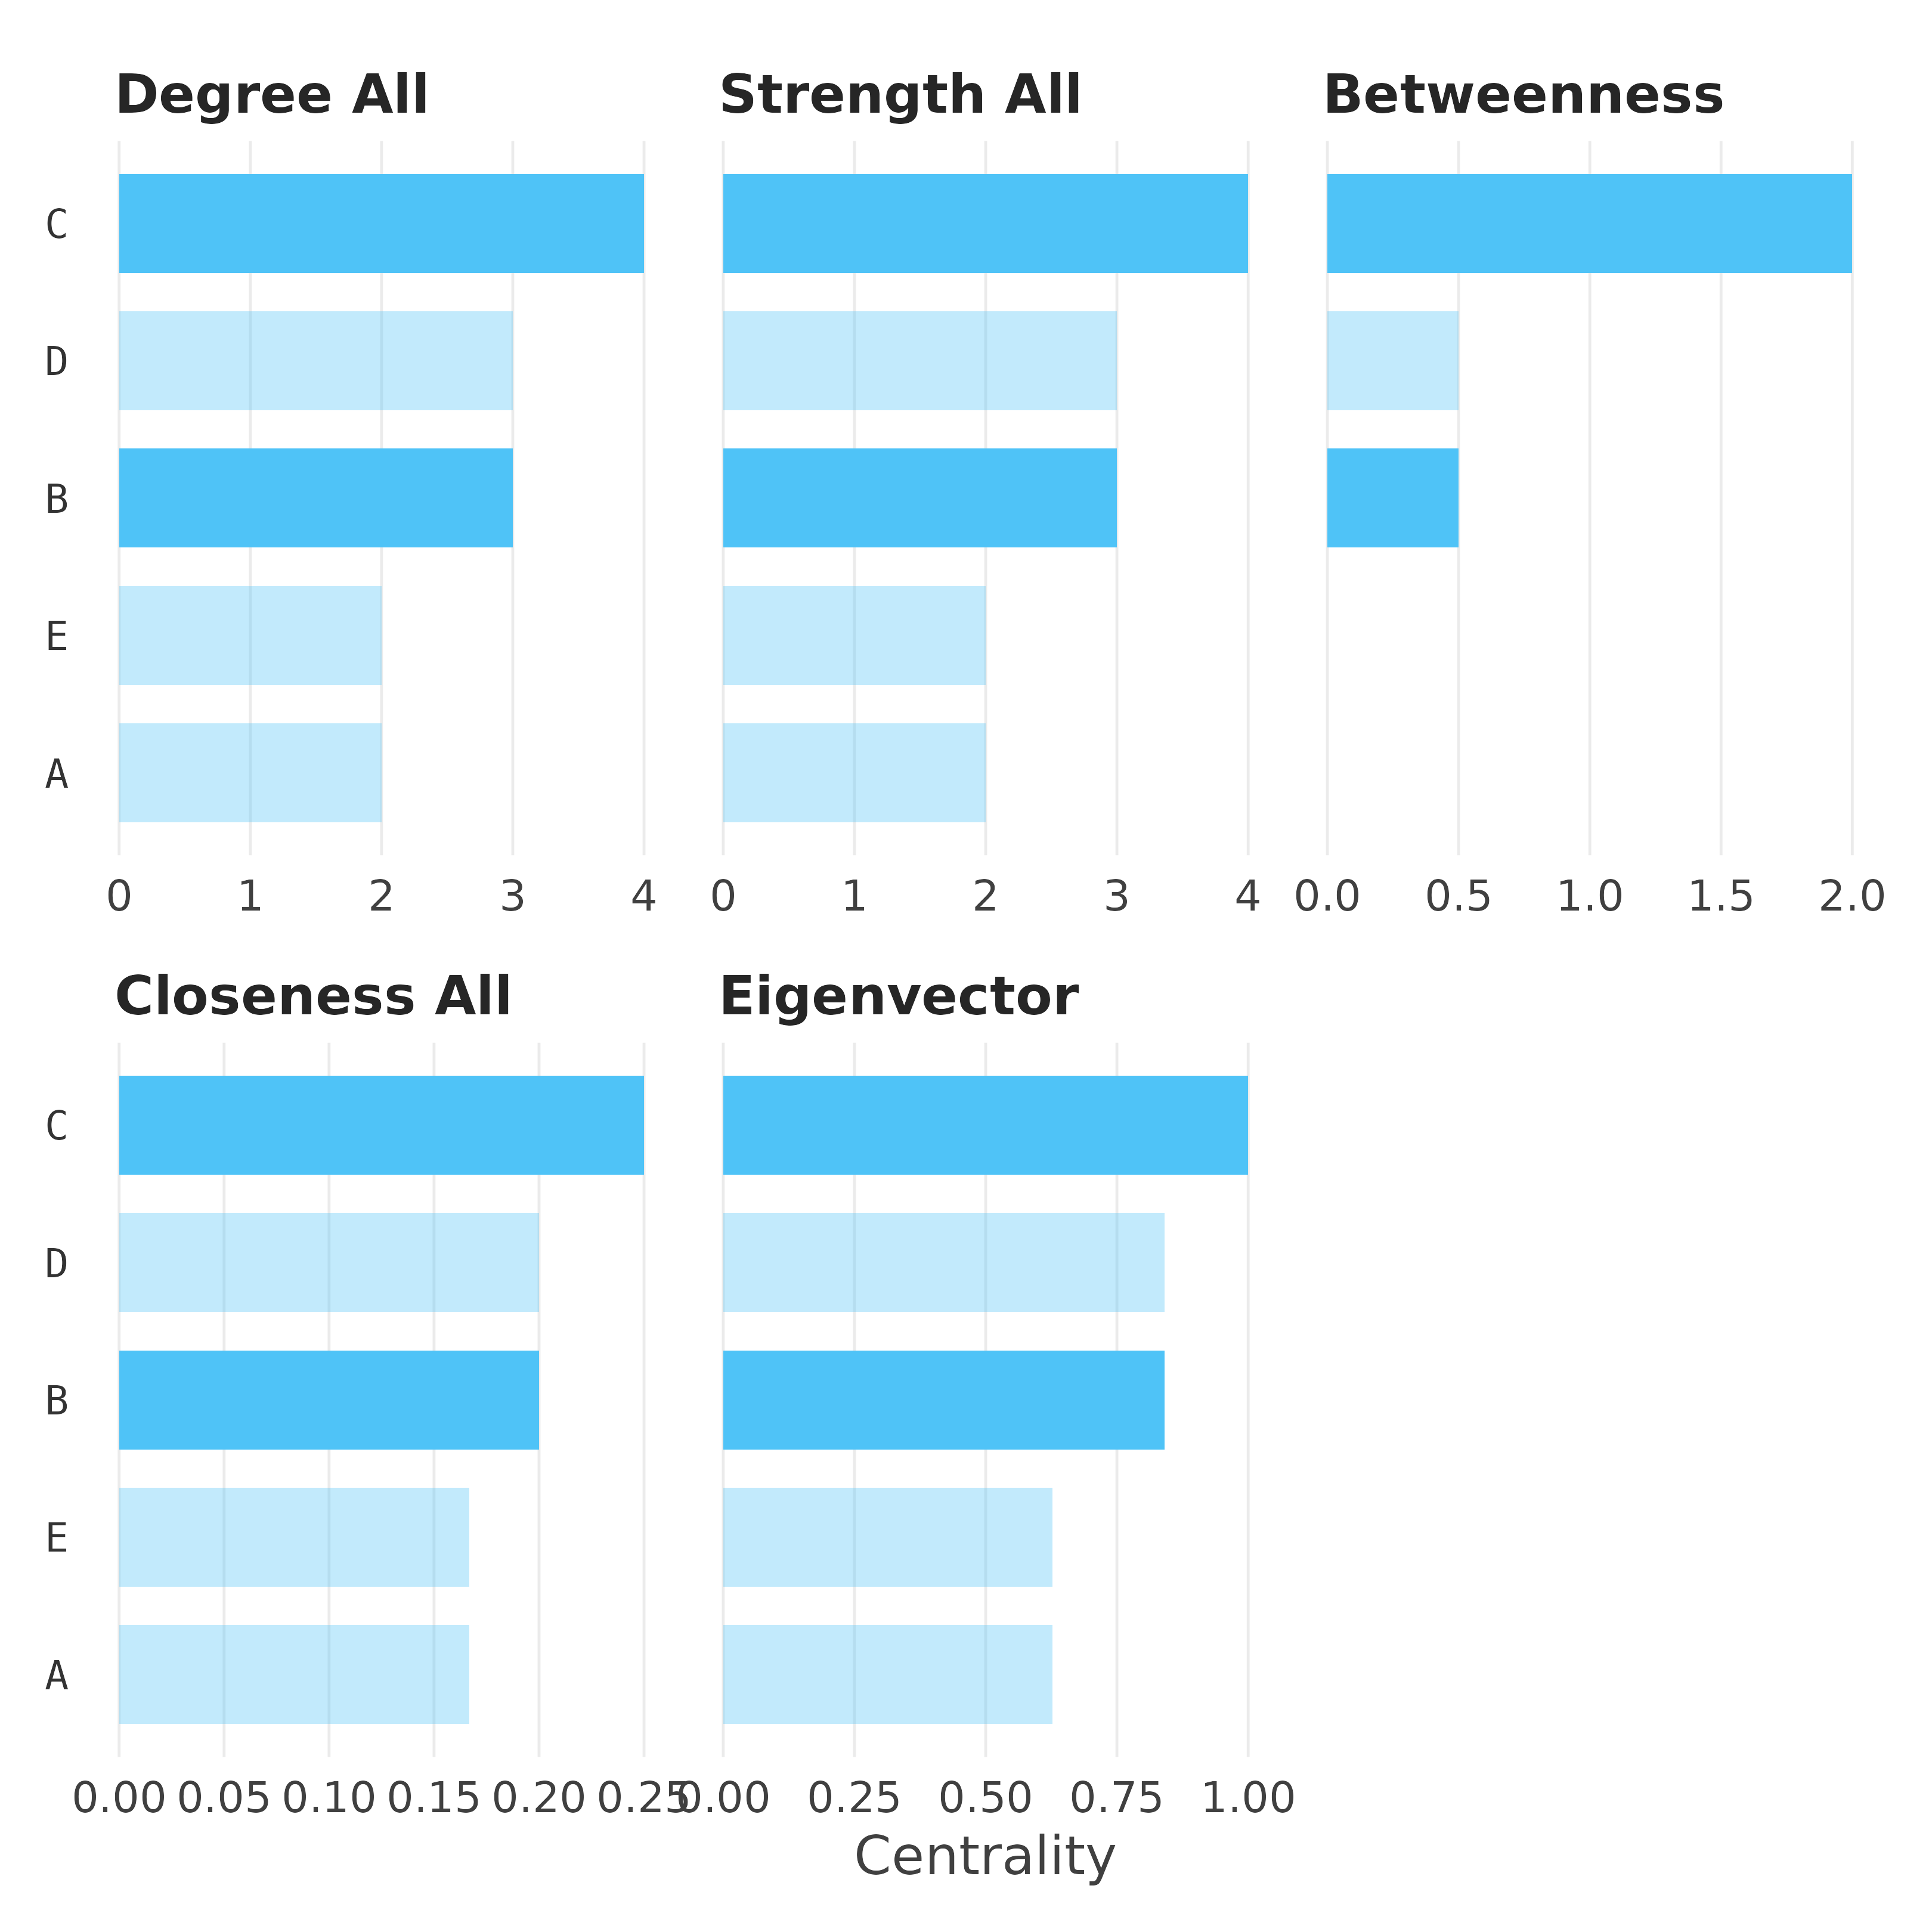
"bar"Horizontal bars, one facet per measure. Best for reading individual measure values.
"lollipop"Like
"bar"but with a dot at the tip. Softer visual weight; useful on dense grids."dot"Dot-only variant of the lollipop style.