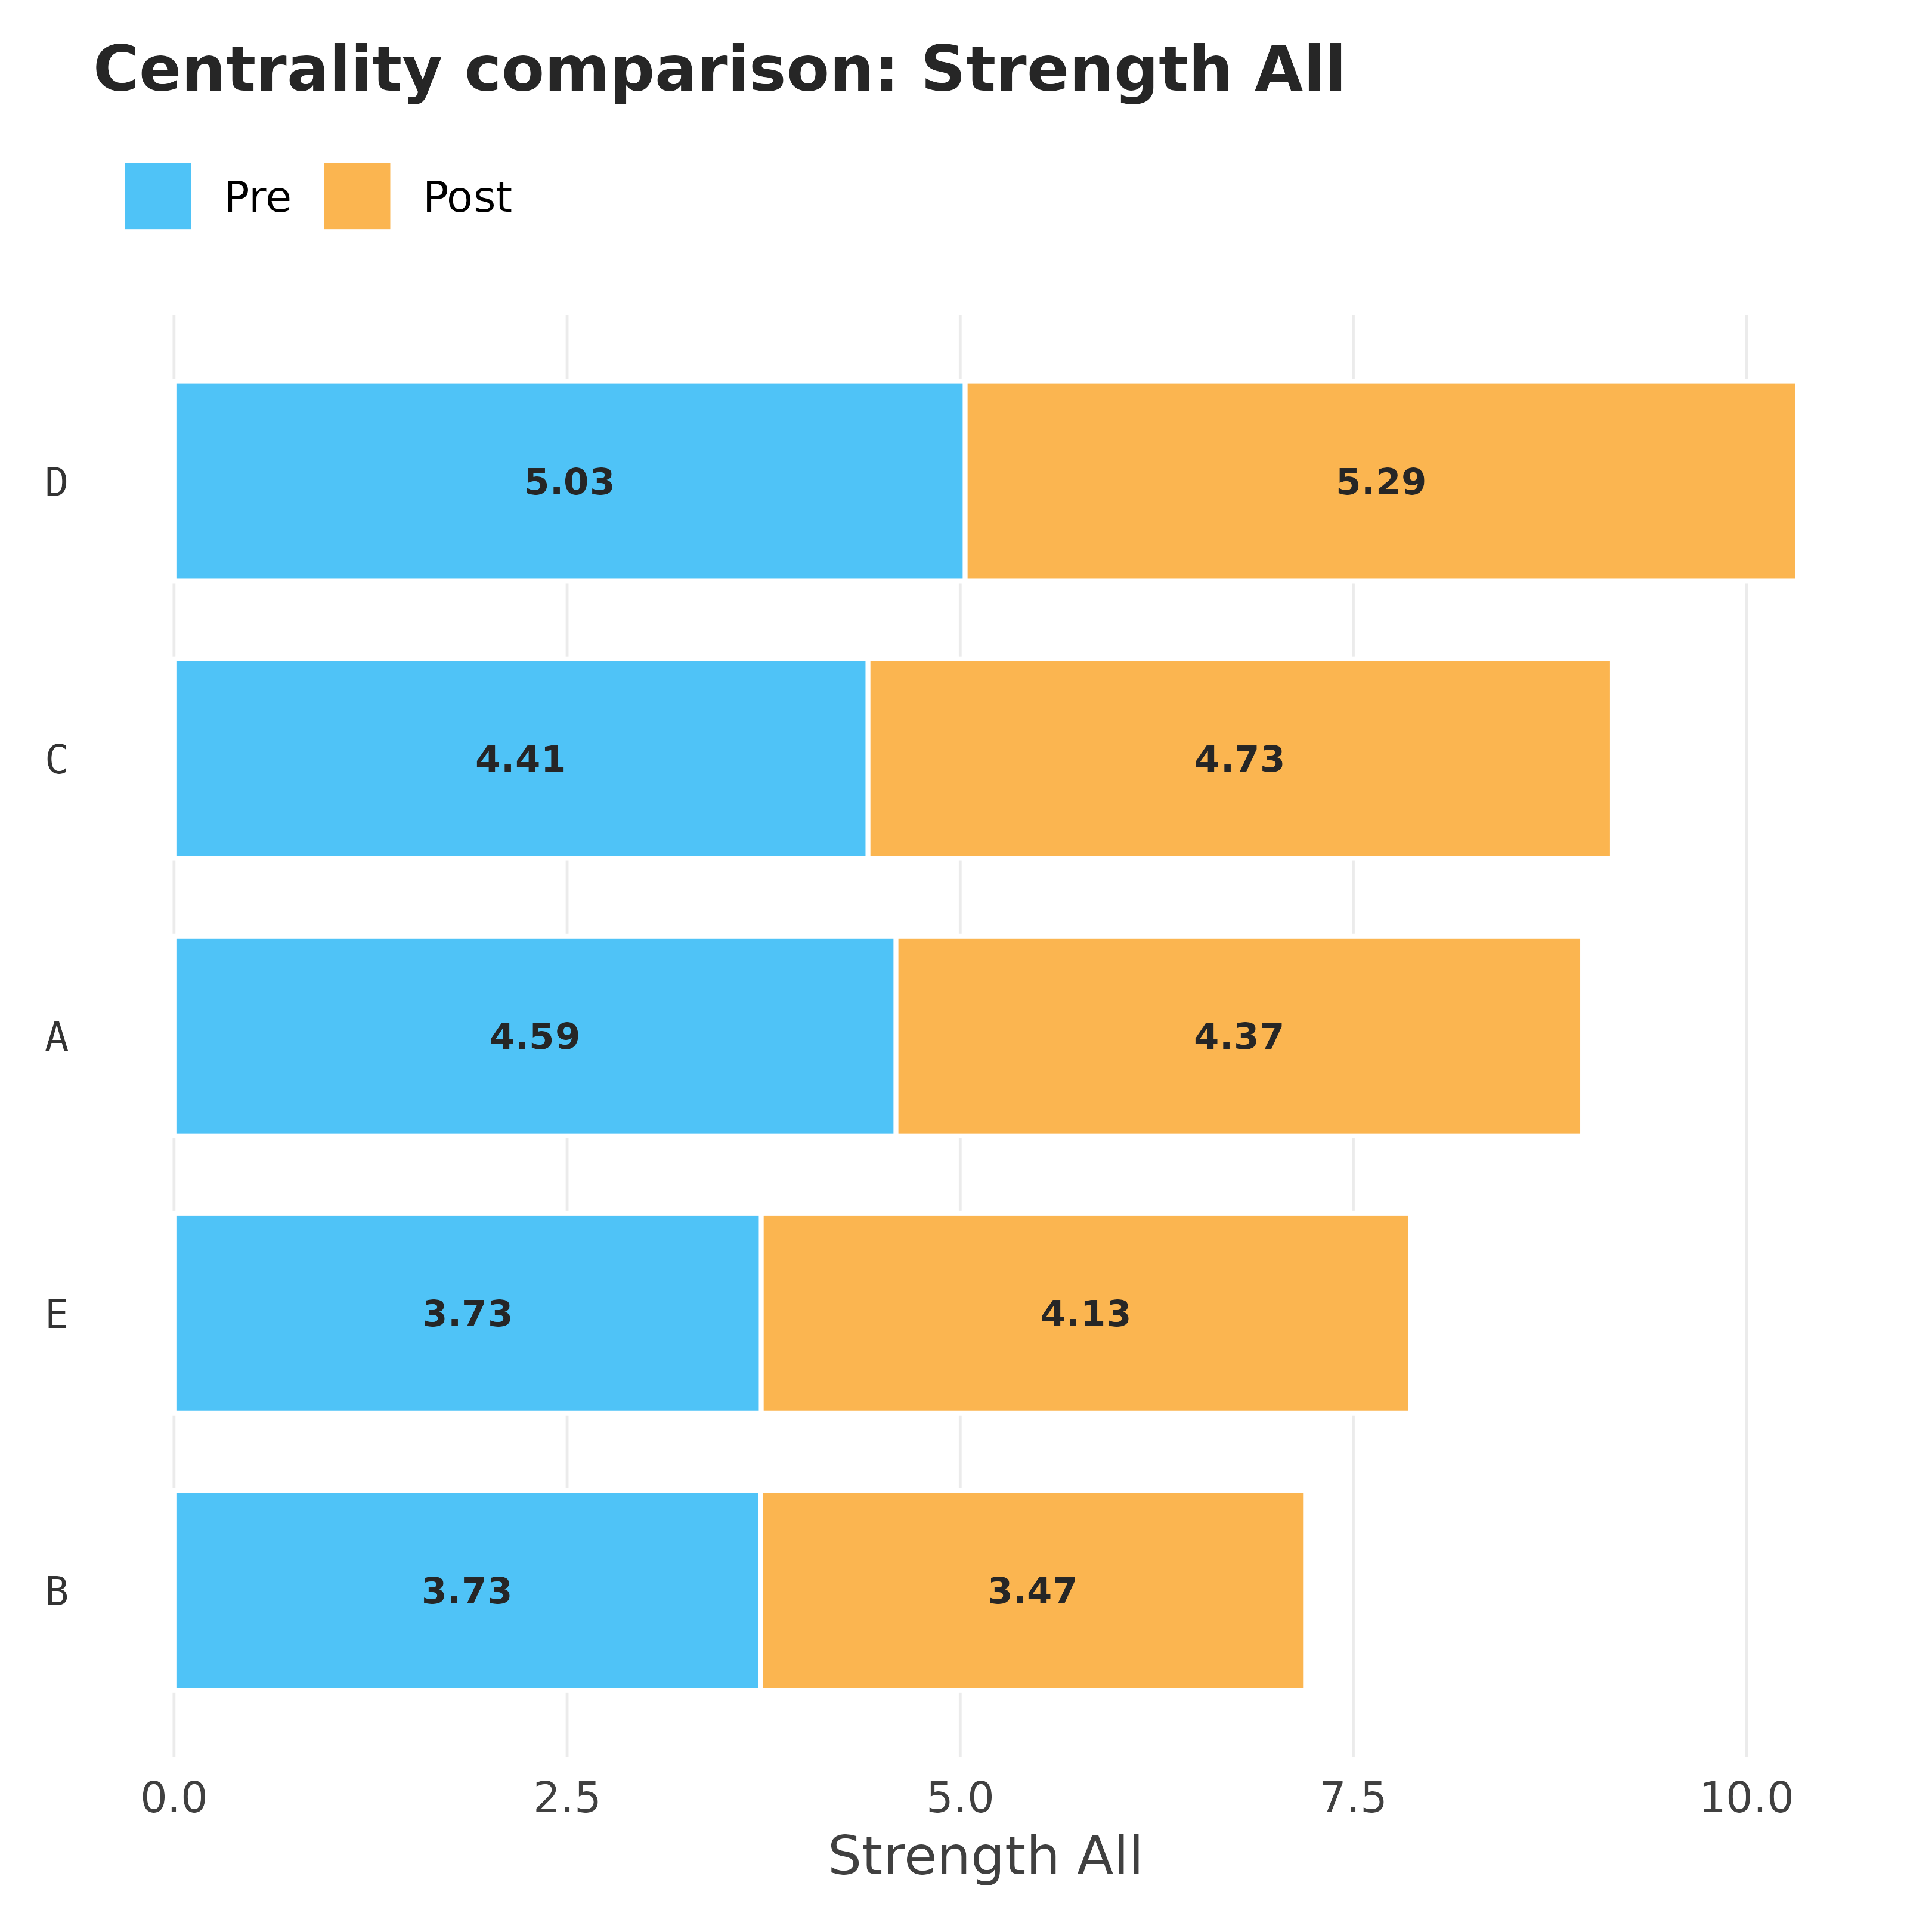
Compare a centrality measure across two or more groups using stacked,
faceted, grouped, dumbbell, line, or two-group pyramid layouts. The
"pyramid" style is a back-to-back horizontal bar chart for exactly
two groups.
Usage
plot_centrality_compare(
  ...,
  measure = NULL,
  style = c("stacked", "facet", "grouped", "dumbbell", "line", "pyramid"),
  group_labels = NULL,
  group_colors = NULL,
  node_colors = NULL,
  sort_by = c("max", "delta", "first", "alpha"),
  top_n = NULL,
  scale = c("raw", "normalized"),
  show_values = TRUE,
  size_by_value = FALSE,
  size_range = c(2, 9),
  orientation = c("horizontal", "vertical"),
  ncol = NULL,
  title = NULL,
  subtitle = NULL,
  centrality_args = list()
)
Arguments
- ...
Two or more centrality data frames (from
centrality) or network inputs. Names are used as group labels whengroup_labelsis NULL.- measure
Character, a single centrality measure to compare. If NULL, the first shared measure is used.
- style
Character:
"stacked"(default),"facet","grouped","dumbbell","line", or"pyramid"(2 groups only).- group_labels
Character vector with one label per group. Default
c("Group 1", "Group 2", ...).- group_colors
Character vector of colors, one per group. Default cycles through the cograph palette.
- node_colors
Optional. Either a named character vector mapping node name to color, an unnamed vector of colors applied in node order, or the name of a palette (
"cograph","okabe","viridis"). Used bystyle = "facet".- sort_by
"max"(default) ranks nodes by highest value across groups;"delta"by range;"first"by first group;"alpha"alphabetically.- top_n
Show top N nodes (by
sort_by). Default: all.- scale
"raw"(default, native values on each side) or"normalized"([0, 1] within each side before plotting).- show_values
Logical. Print the value inside each bar. Default TRUE.
- size_by_value
Logical. For
"dumbbell"style, scale dot size by centrality value. Default FALSE.- size_range
Numeric vector of length 2 giving the min and max dot size (mm) when
size_by_value = TRUE. Defaultc(2, 9).- orientation
Character:
"horizontal"(default, nodes on y-axis) or"vertical"(nodes on x-axis).- ncol
Number of facet columns for
style = "facet". Default NULL chooses automatically.- title
Plot title.
- subtitle
Plot subtitle. Auto-generated when NULL.
- centrality_args
Named list of additional arguments passed to
centralitywhen inputs are networks.