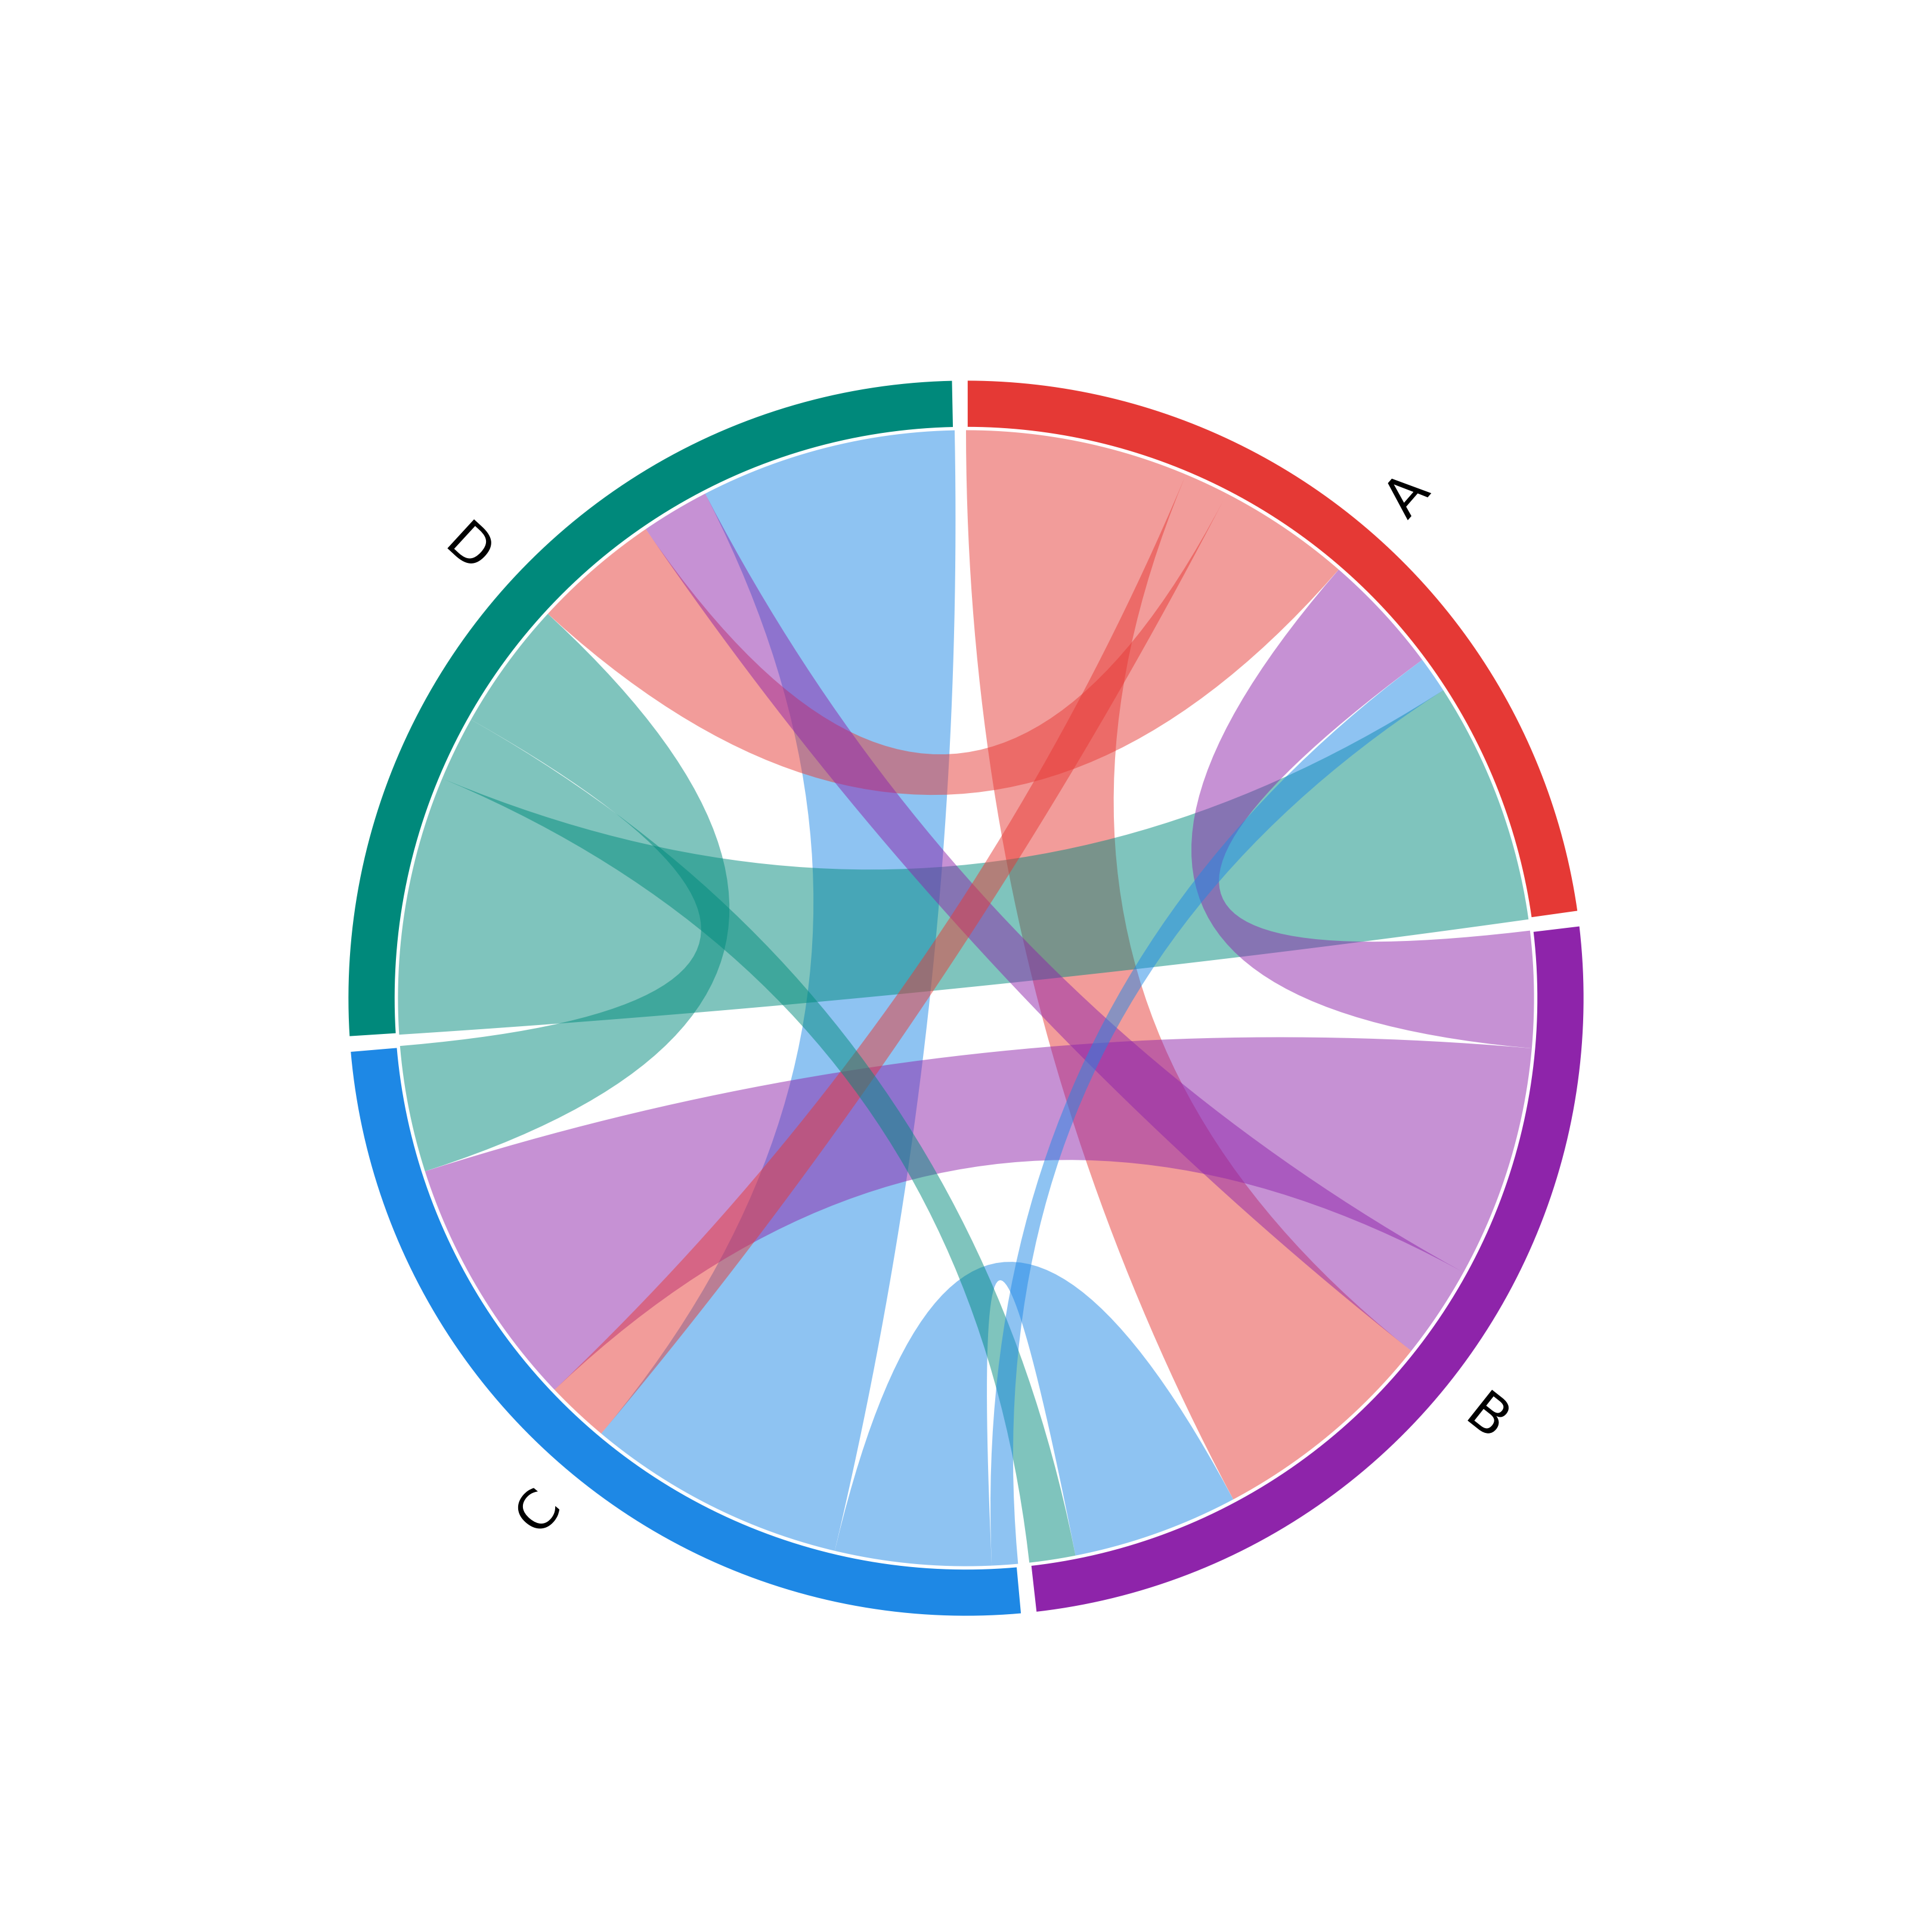
Plots a chord diagram in which nodes are arcs on the outer ring and edges are curved ribbons (chords) connecting them. Arc length is proportional to the total absolute weight of each node's edges, and chord width is proportional to the absolute edge weight.
Usage
plot_chord(
  x,
  directed = NULL,
  segment_colors = NULL,
  segment_border_color = "white",
  segment_border_width = 1,
  segment_pad = 0.02,
  segment_width = 0.08,
  chord_color_by = "source",
  chord_alpha = 0.5,
  chord_border = NA,
  self_loop = TRUE,
  labels = NULL,
  label_size = 1,
  label_color = "black",
  label_offset = 0.05,
  label_threshold = 0,
  threshold = 0,
  ticks = FALSE,
  tick_interval = NULL,
  tick_labels = TRUE,
  tick_size = 0.6,
  tick_color = "grey30",
  start_angle = pi/2,
  clockwise = TRUE,
  title = NULL,
  title_size = 1.2,
  background = NULL,
  ...
)
Arguments
- x
A weight matrix,
cograph_network,tna,igraph, or list with a matrixweightscomponent.- directed
Logical. If
NULL(default), auto-detected from matrix symmetry.- segment_colors
Colors for the outer ring segments, recycled to the number of nodes.
NULLuses a built-in palette of 12 colors, interpolated when there are more nodes.- segment_border_color
Border color for segments.
- segment_border_width
Border width for segments.
- segment_pad
Gap between segments in radians.
- segment_width
Radial thickness of the outer ring as a fraction of the radius.
- chord_color_by
How to color chords.
"target"uses the target segment color, and any other single string (default"source") uses the source segment color. A vector of colors is recycled to the number of chords, which are ordered by source node and then target node.- chord_alpha
Alpha transparency for chords.
- chord_border
Border color for chords.
NAfor no border.- self_loop
Logical. Ignored. Self-loop chords are always shown.
- labels
Node labels.
NULLuses row names,FALSEsuppresses labels.- label_size
Text size multiplier for labels.
- label_color
Color for labels.
- label_offset
Radial offset of labels beyond the outer ring.
- label_threshold
Hide labels for nodes whose share of the total flow is below this value.
- threshold
Minimum absolute weight to show a chord.
- ticks
Logical. Add tick marks along the outer ring to indicate magnitude?
- tick_interval
Spacing between major ticks in the same units as the weight matrix. Minor ticks are placed at half this spacing.
NULL(default) selects an interval from the scale of the weights.- tick_labels
Logical. Show numeric labels at major ticks?
- tick_size
Text size multiplier for tick labels.
- tick_color
Color for tick marks and labels.
- start_angle
Starting angle in radians (default
pi/2, top).- clockwise
Logical. Lay out segments clockwise?
- title
Optional plot title.
- title_size
Text size multiplier for the title.
- background
Background color for the plot.
NULL(default) uses the current device background.- ...
Ignored.
Value
Invisibly, a list with two data frames. segments has one row
per node with columns node, start, end, mid
(angles in radians) and flow. chords has one row per chord
with columns from, to (node indices), from_start,
from_end, to_start, to_end (attachment angles) and
weight (absolute edge weight).
Details
The diagram is plotted with base R graphics. Segments and chords are polygons, and each ribbon follows quadratic Bezier curves through the center.
For directed networks, each segment is split into an outgoing half and an incoming half, and chords attach to the matching half. For undirected networks each edge forms one chord and the full segment arc is shared. Nodes without edges receive a small minimum arc so that they remain visible.