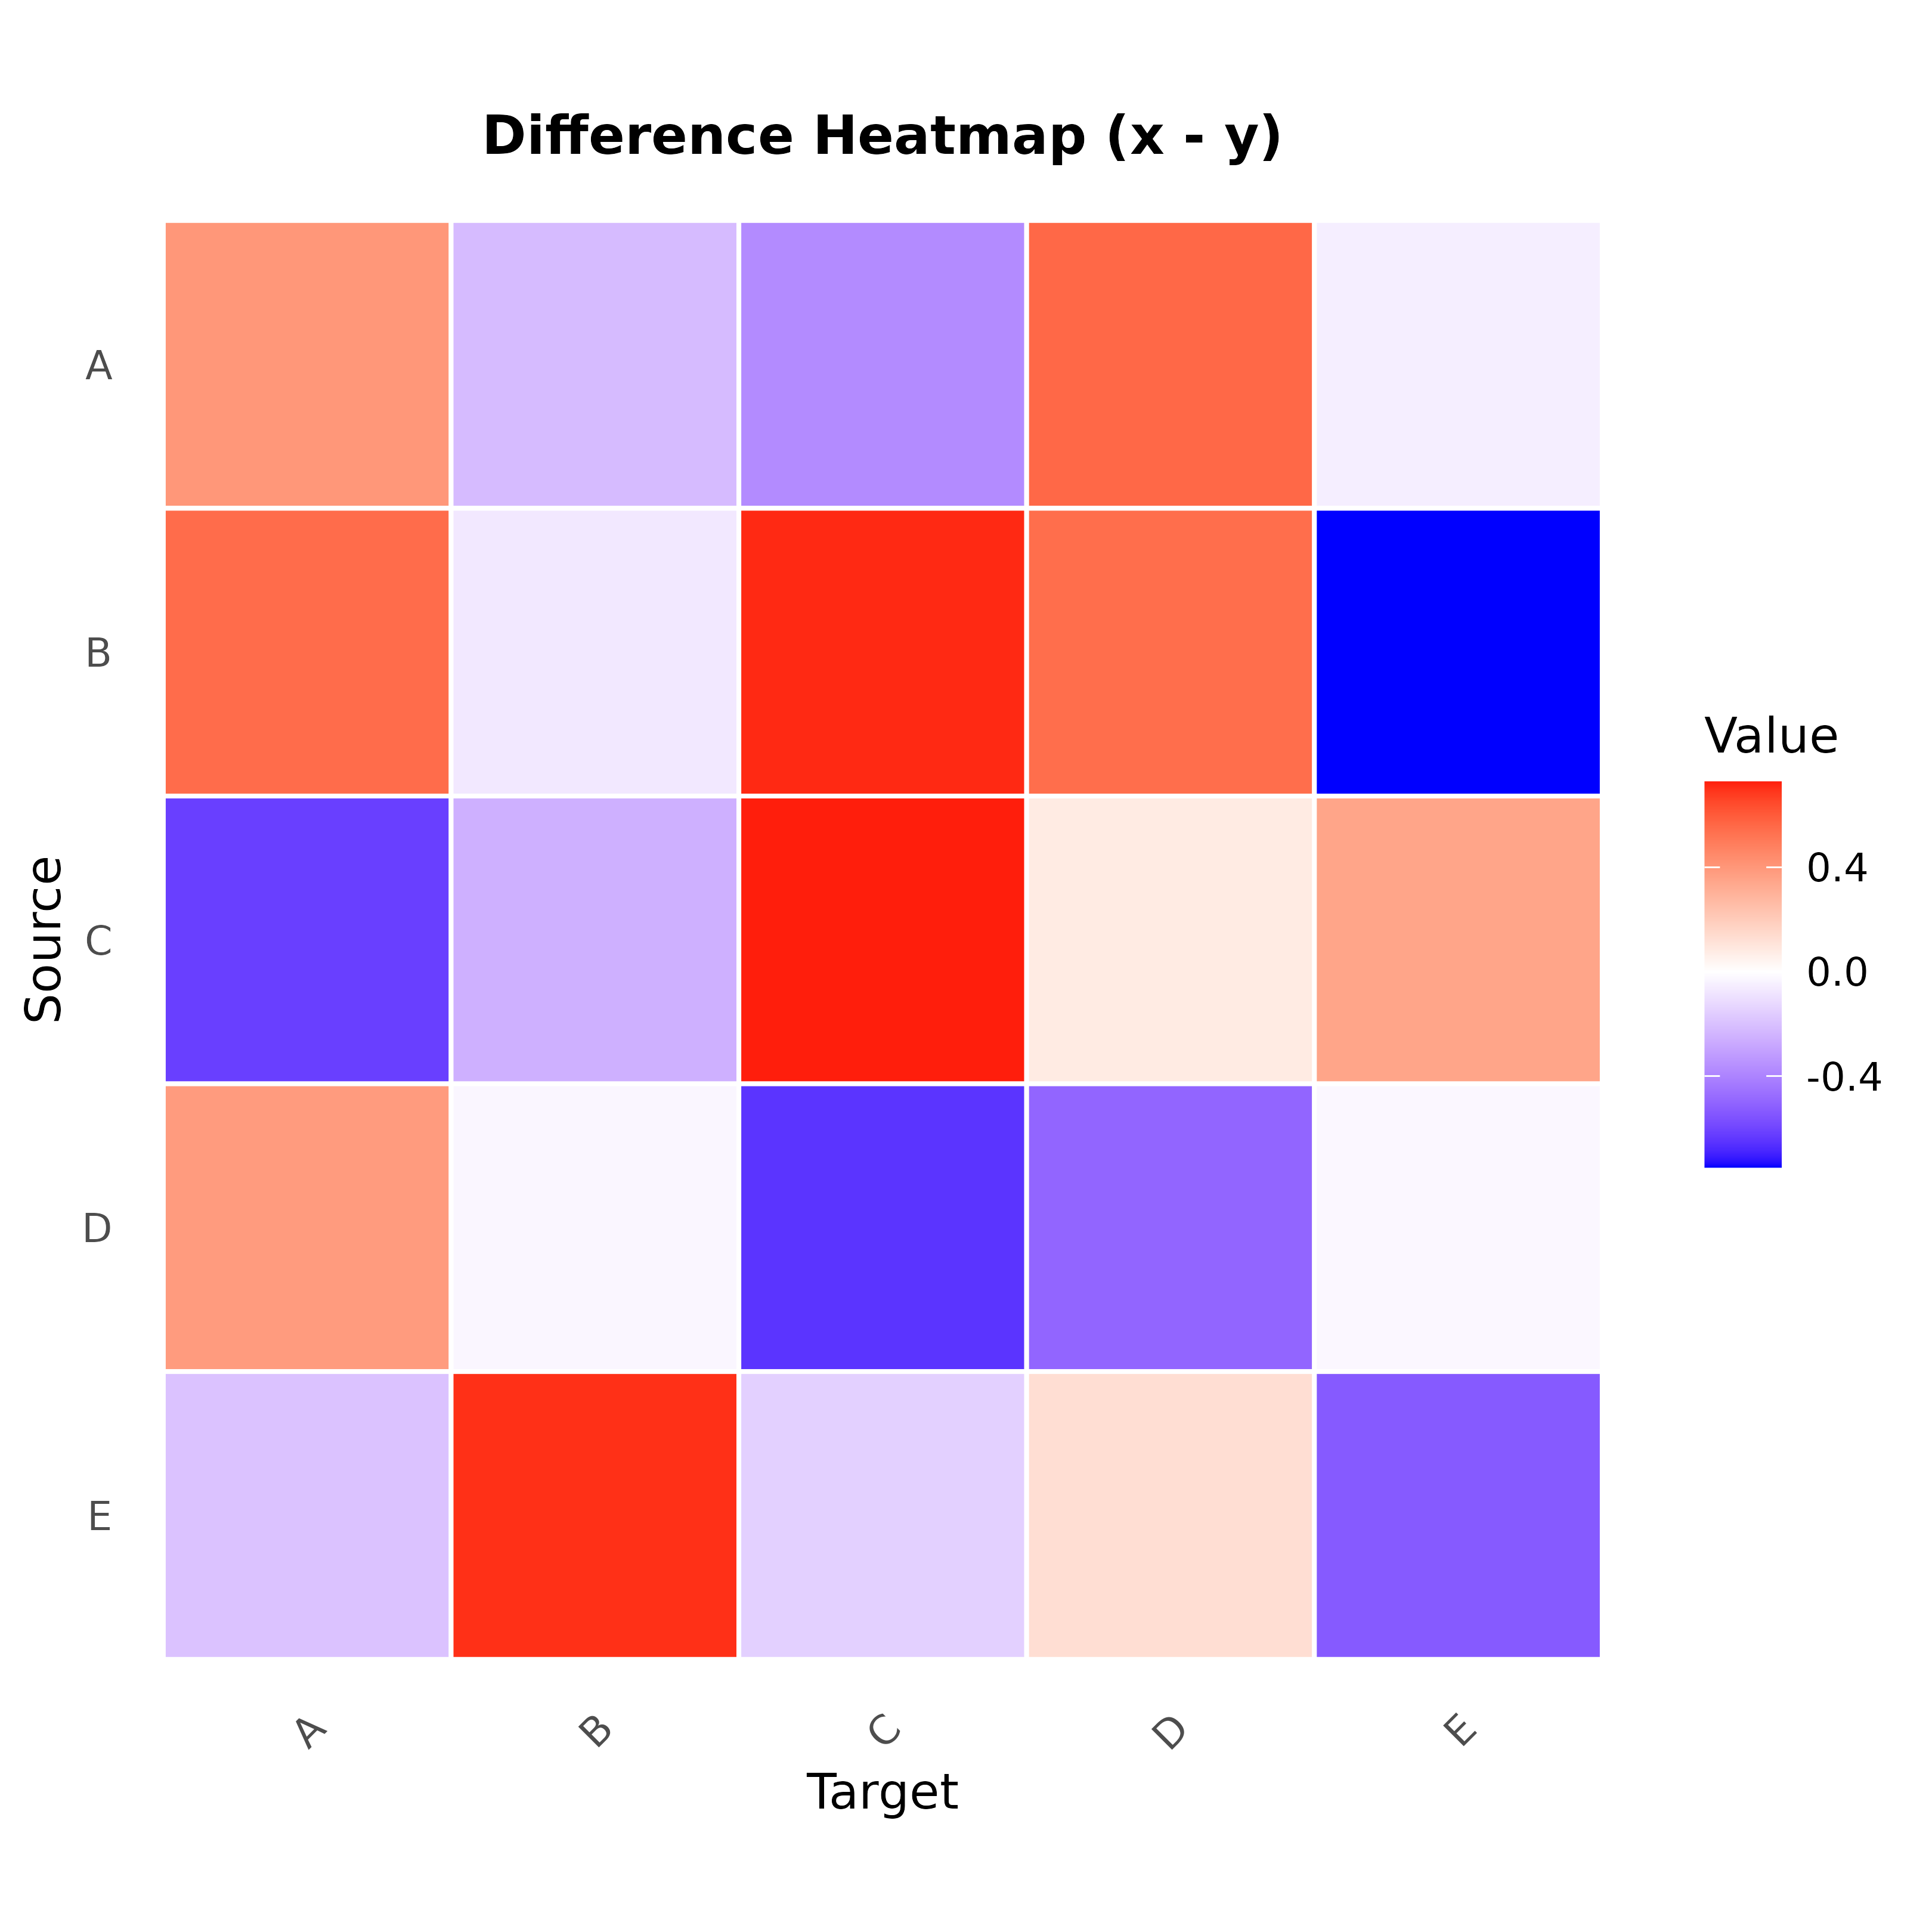
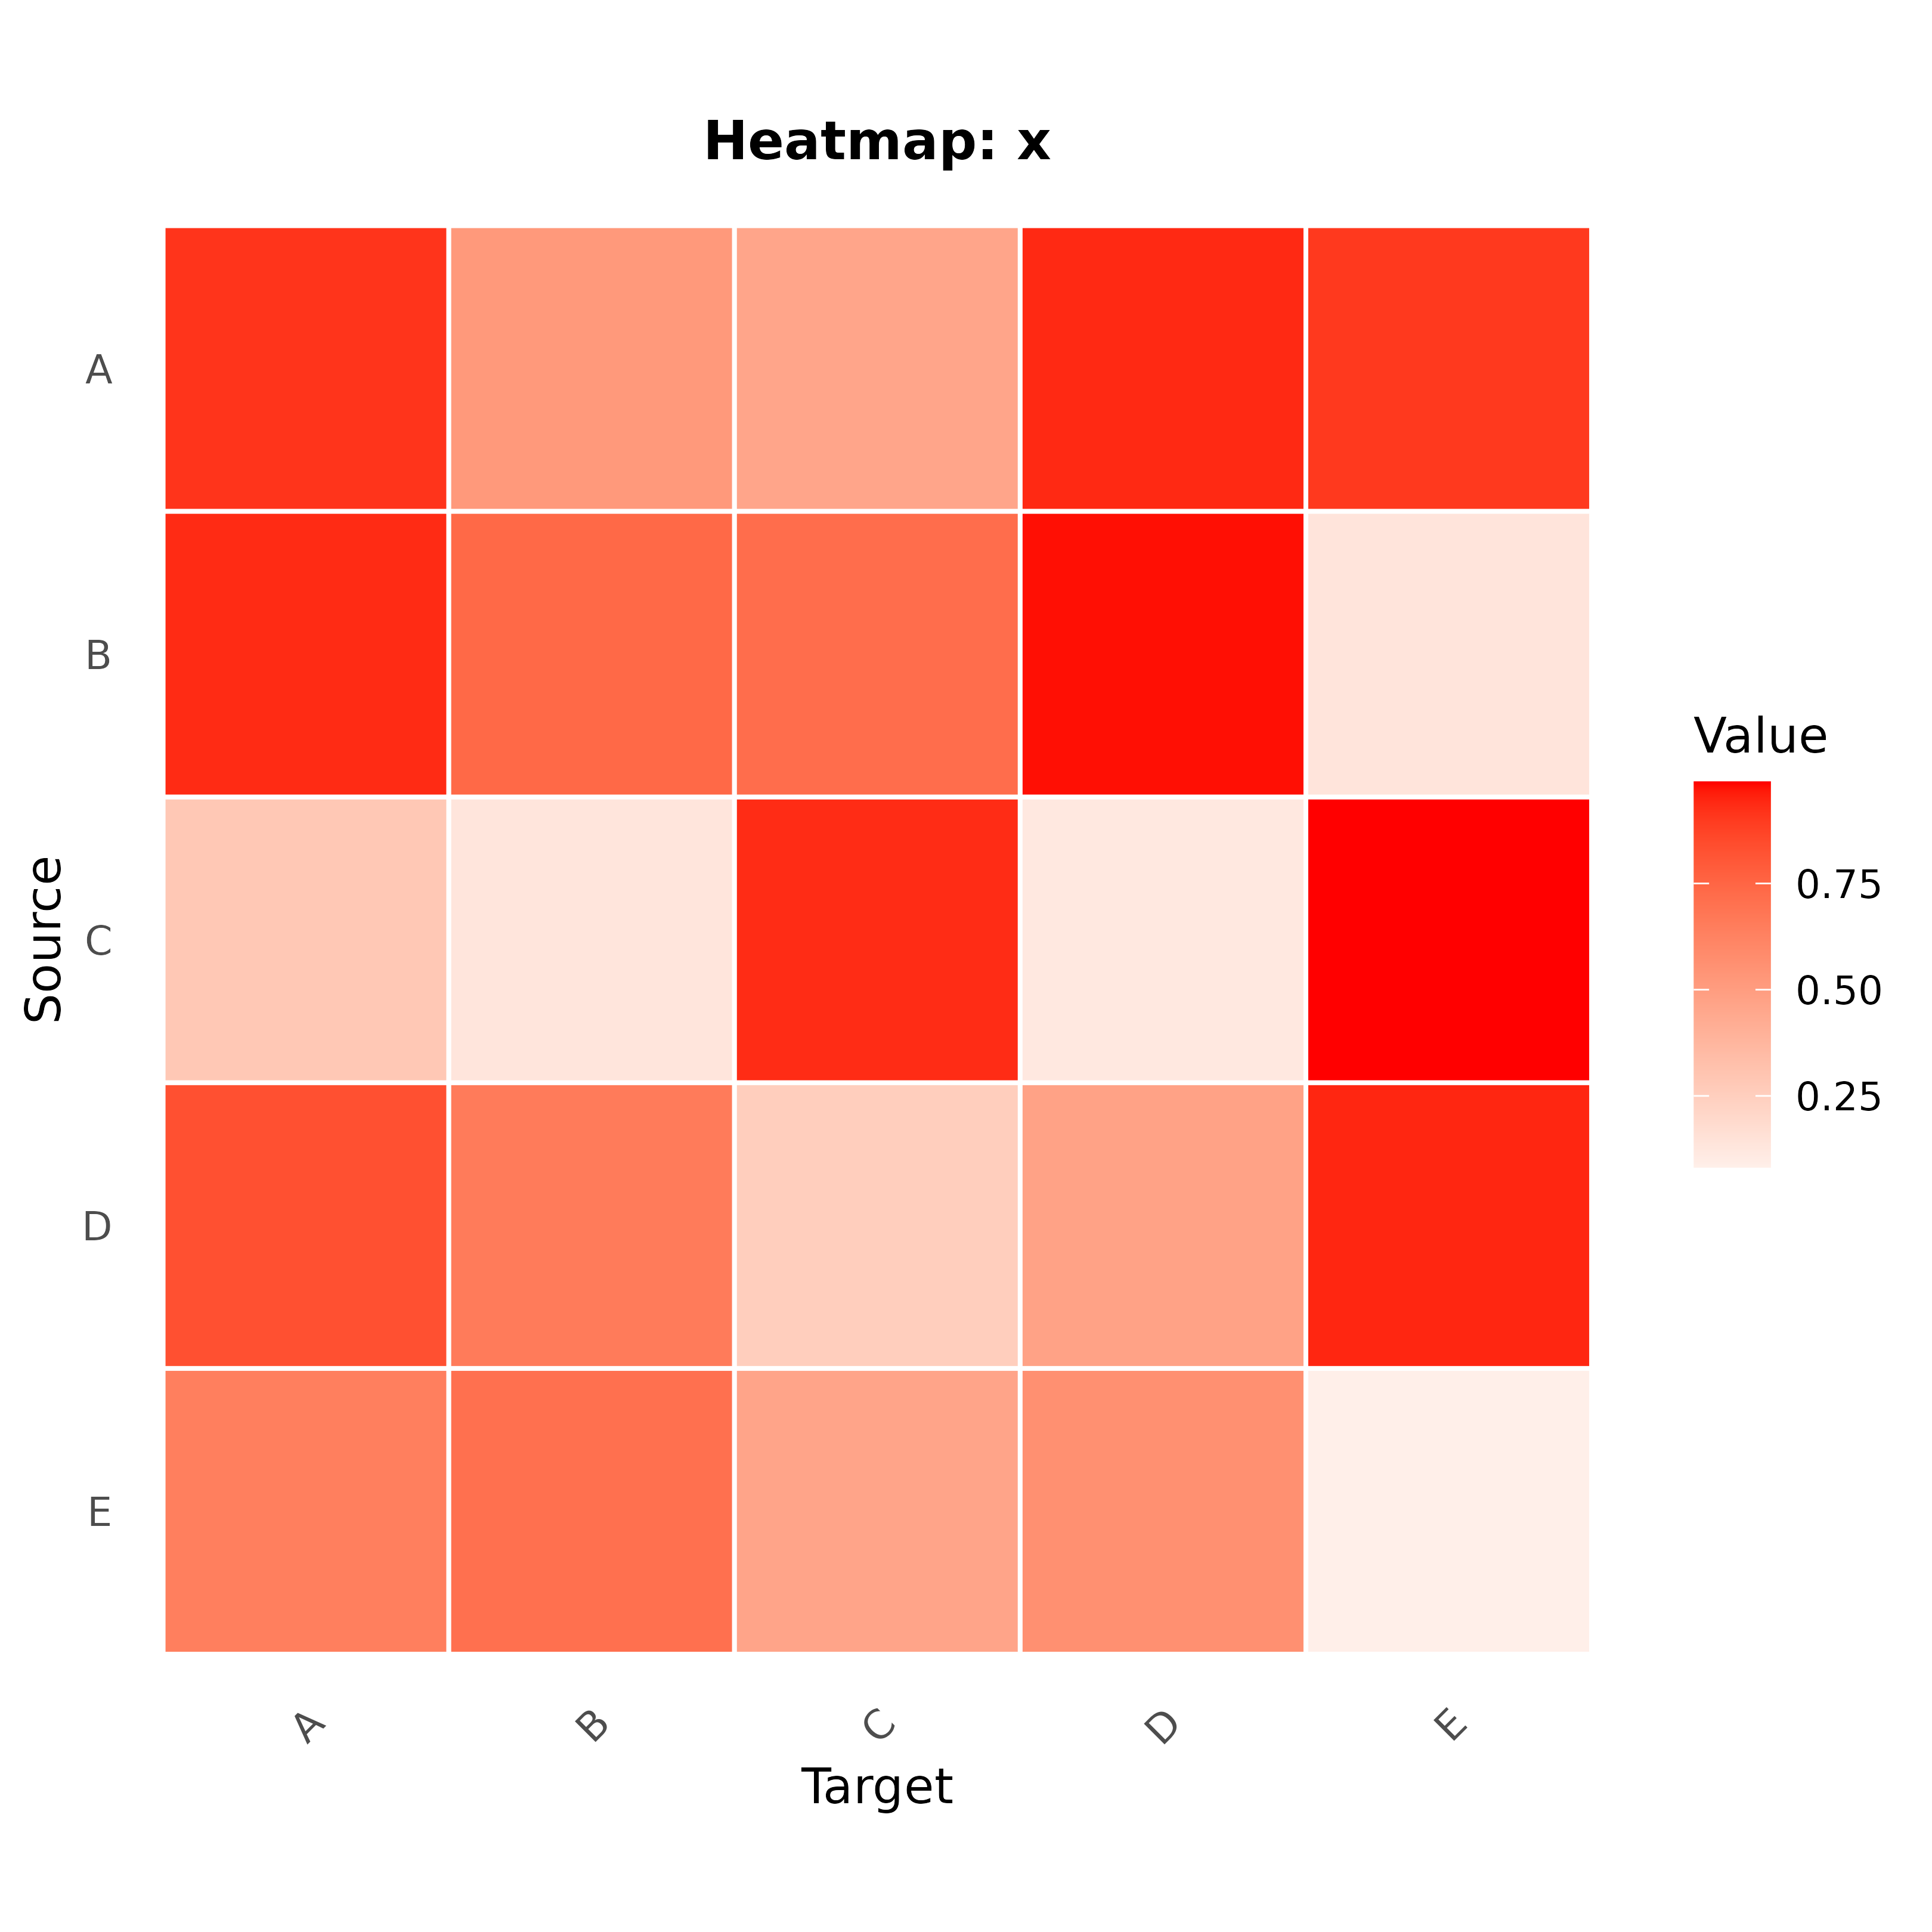
Creates a heatmap visualization comparing two networks.
Usage
plot_comparison_heatmap(
  x,
  y = NULL,
  type = c("difference", "x", "y"),
  name_x = "x",
  name_y = "y",
  low_color = "blue",
  mid_color = "white",
  high_color = "red",
  limits = NULL,
  show_values = FALSE,
  value_size = 3,
  digits = 2,
  title = NULL,
  xlab = "Target",
  ylab = "Source"
)
Arguments
- x
First network: matrix,
cograph_network,CographNetwork,tna,igraph, or list-like object with$weights.- y
Second network: same type as x. NULL to plot just x.
- type
What to display: "difference" (x - y), "x", or "y".
- name_x
Label for first network in title. Default "x".
- name_y
Label for second network in title. Default "y".
- low_color
Color for low/negative values. Default "blue".
- mid_color
Color for zero/middle values. Default "white".
- high_color
Color for high/positive values. Default "red".
- limits
Color scale limits. NULL for auto. Use c(-1, 1) for normalized.
- show_values
Logical: display values in cells? Default FALSE.
- value_size
Text size for cell values. Default 3.
- digits
Decimal places for cell values. Default 2.
- title
Plot title. NULL for auto-generated.
- xlab
X-axis label. Default "Target".
- ylab
Y-axis label. Default "Source".