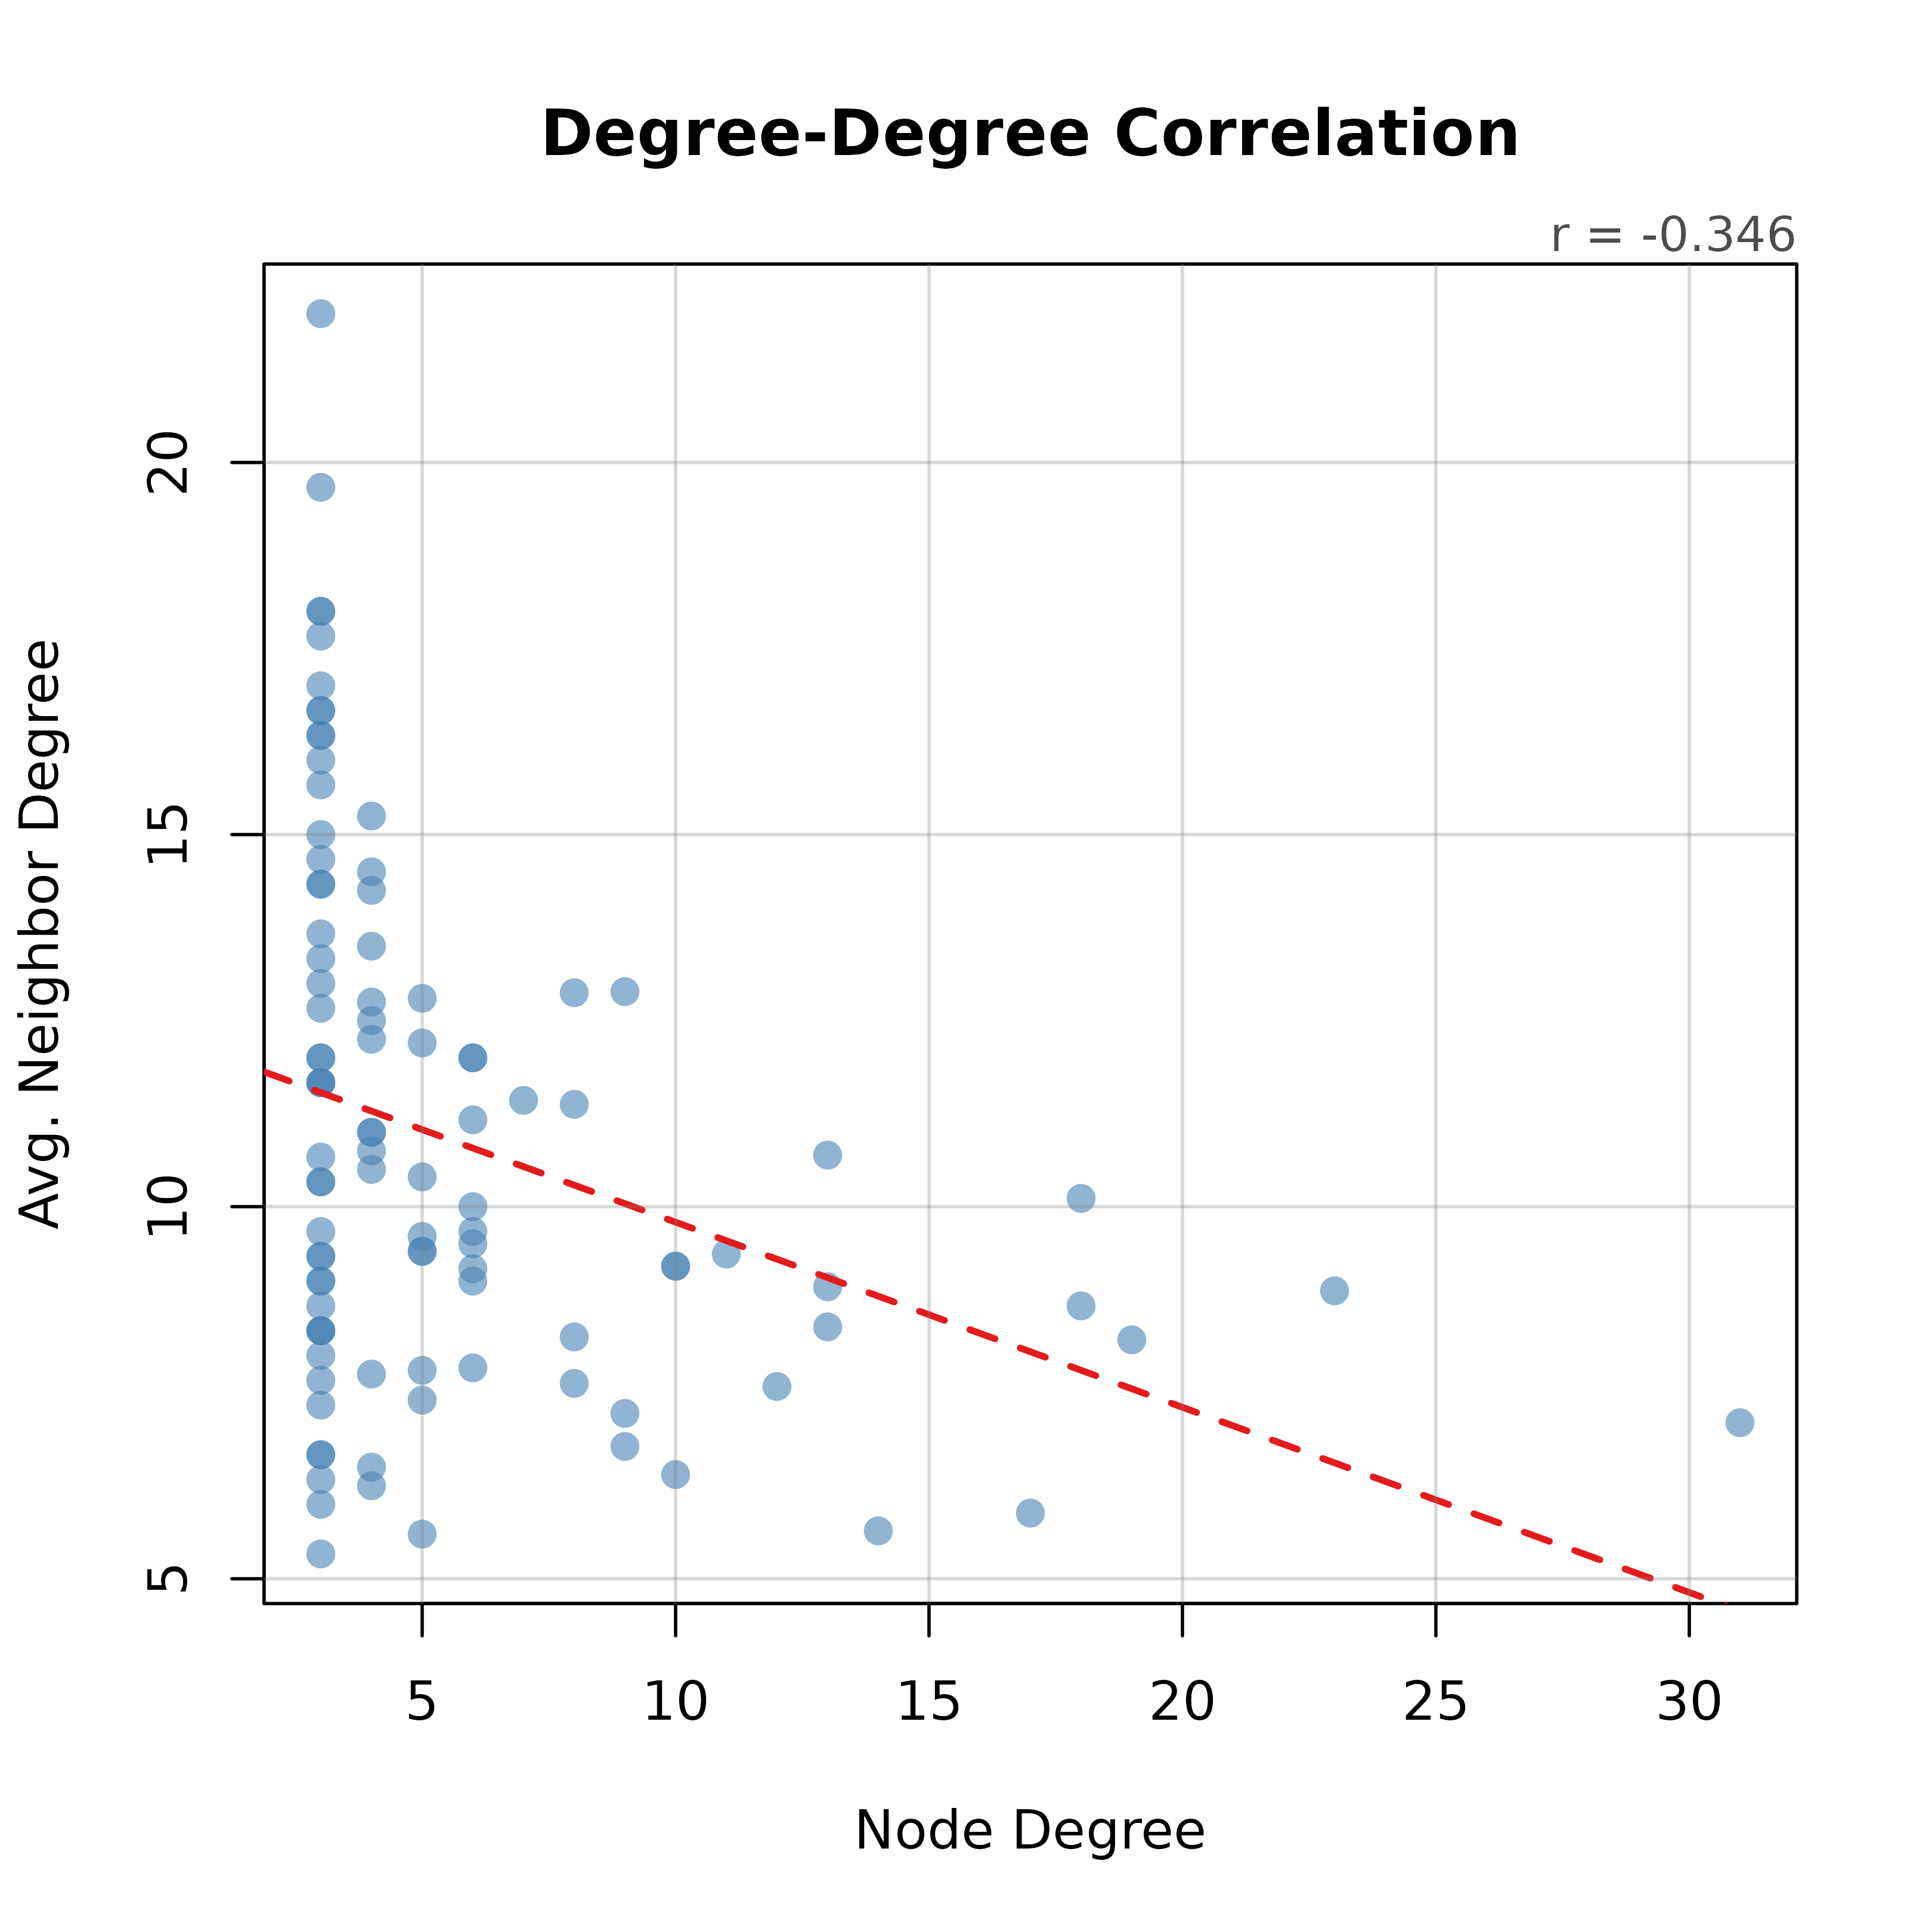
Scatter plot of each node's degree against the average degree of its neighbors. Reveals assortative (positive slope) or disassortative (negative slope) mixing patterns.
Usage
plot_degree_correlation(
  x,
  mode = "all",
  directed = NULL,
  col = "steelblue",
  main = "Degree-Degree Correlation",
  ...
)
Arguments
- x
Network input: matrix, igraph, network, cograph_network, or tna.
- mode
Character. For directed networks:
"all","in", or"out". Default"all".- directed
Logical or NULL. Default NULL (auto-detect).
- col
Point color. Default
"steelblue".- main
Title. Default
"Degree-Degree Correlation".- ...
Additional arguments passed to
plot.
Examples
g <- igraph::sample_pa(100, m = 3, directed = FALSE)
cograph::plot_degree_correlation(g)