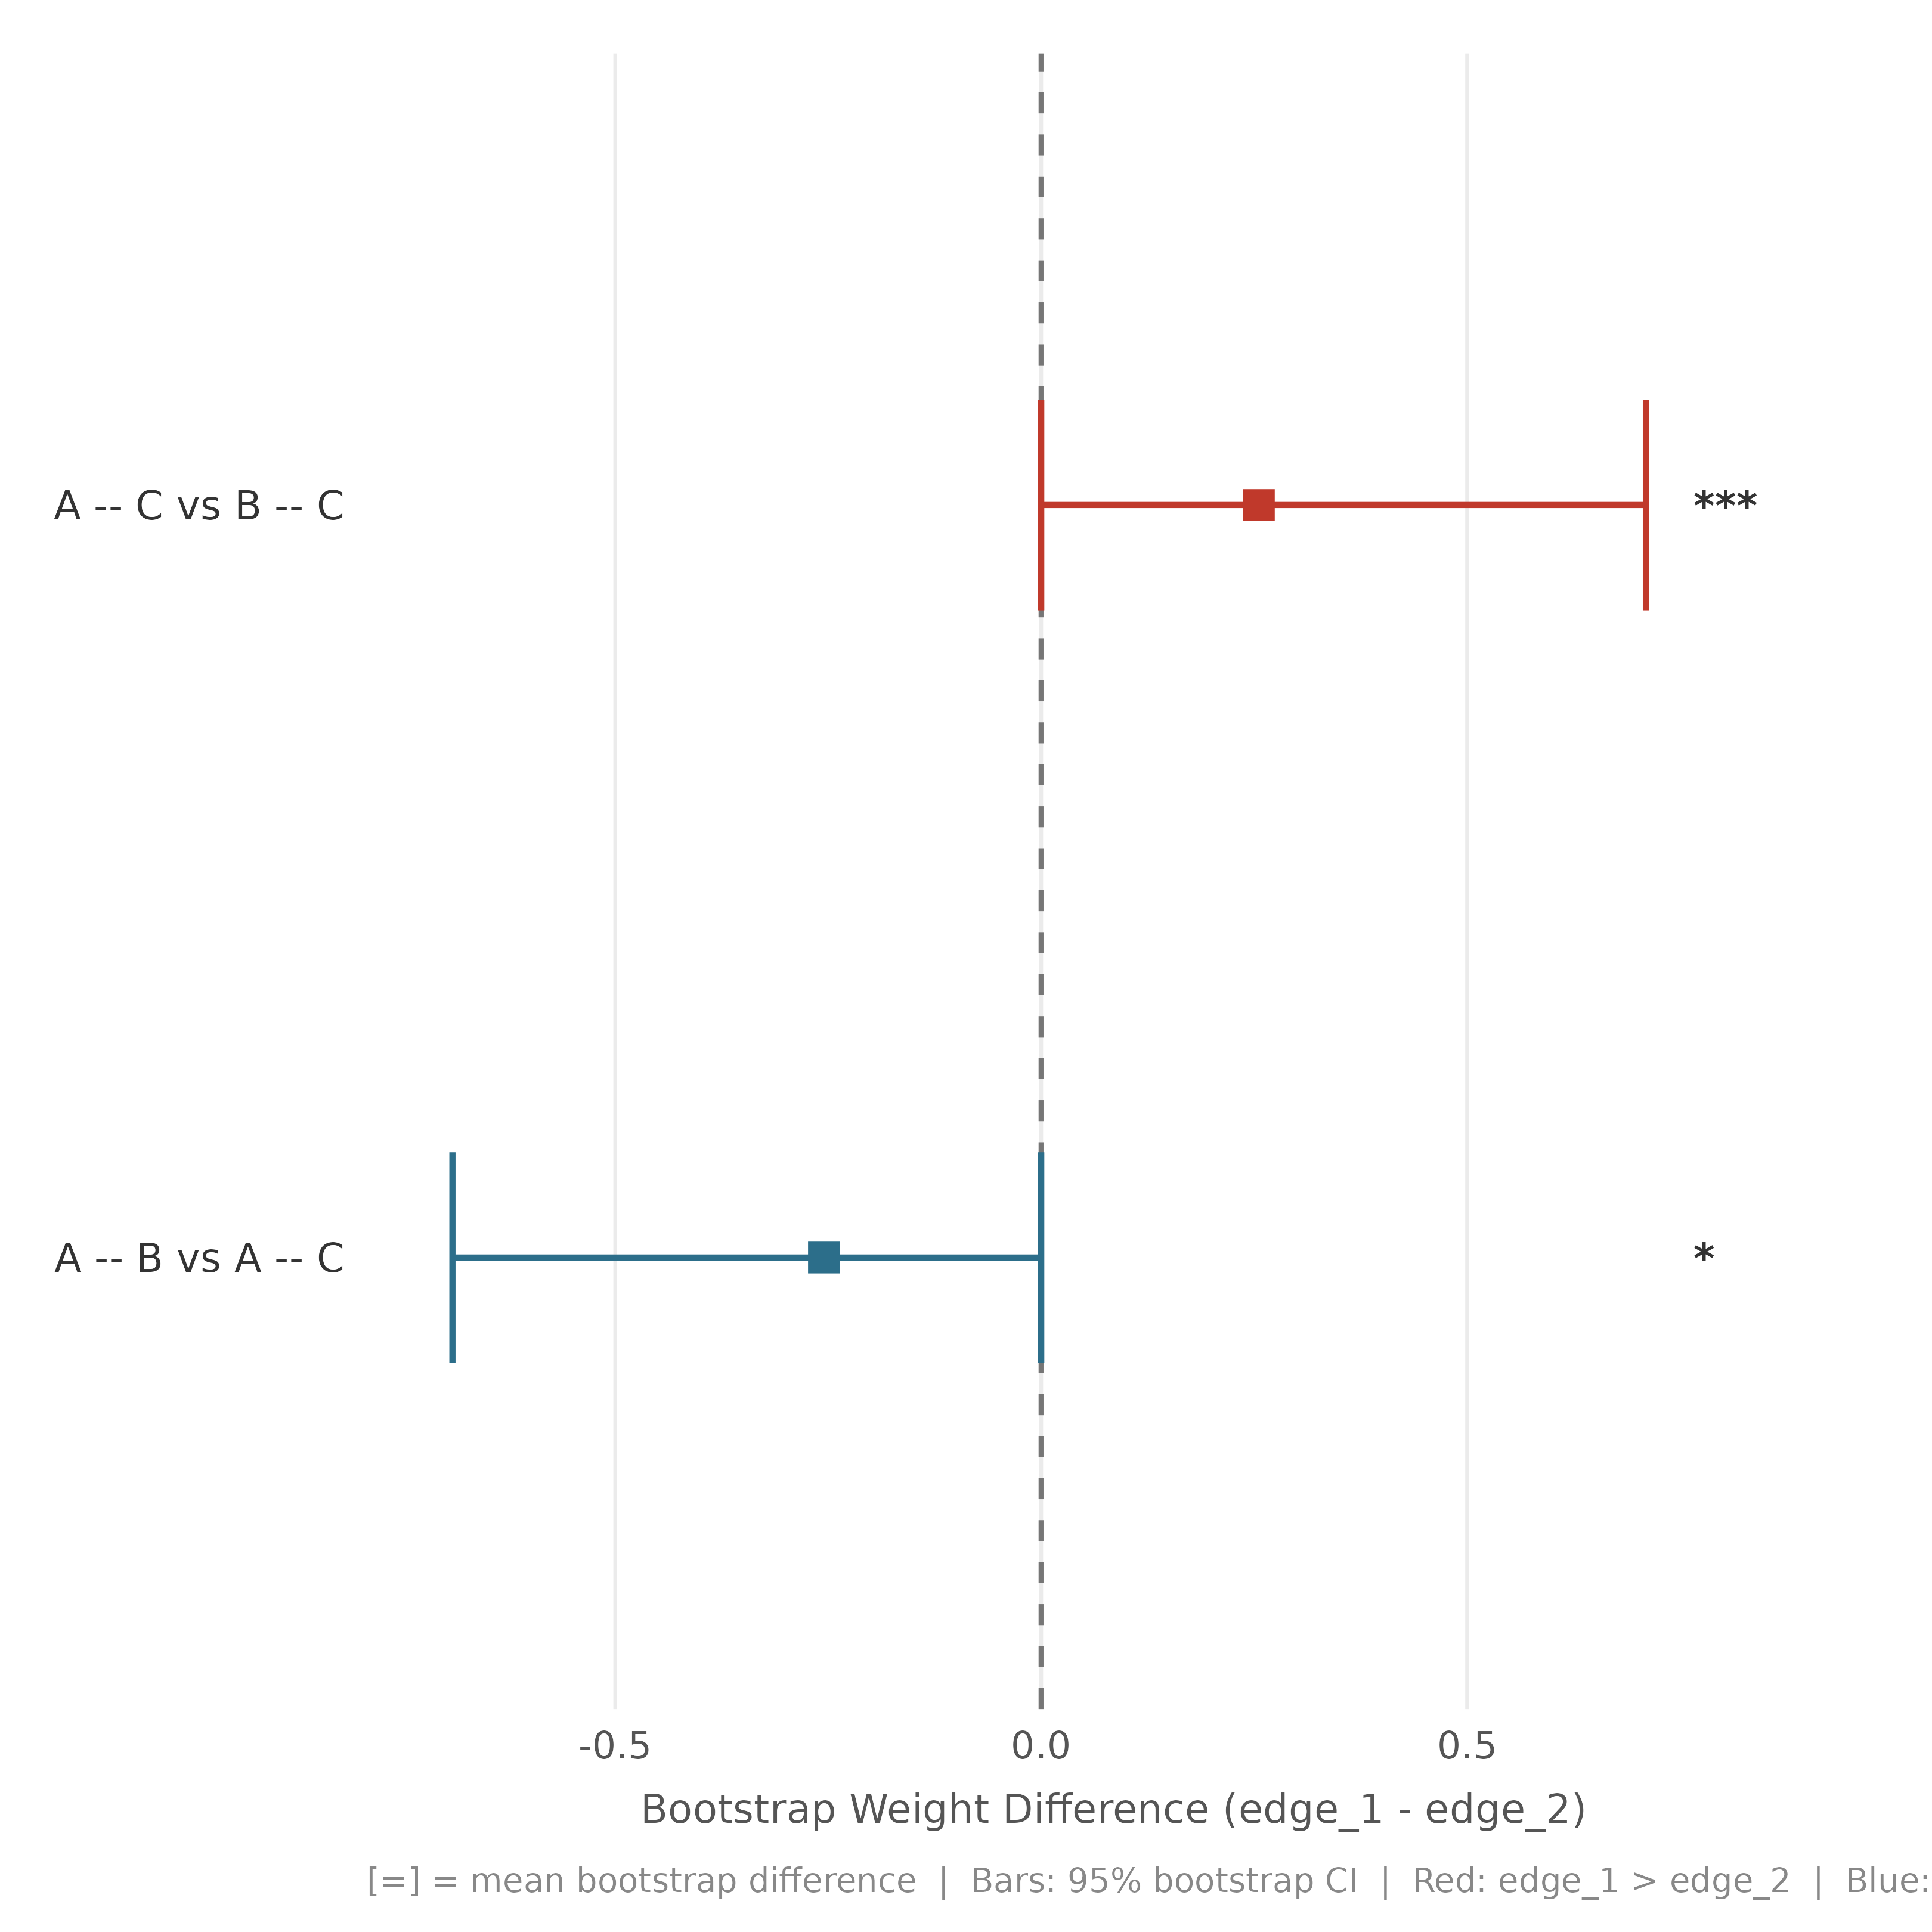
Plots pairwise edge weight differences from a boot_glasso object.
Each row (linear) or spoke (circular) is one edge pair. The square marks
the mean bootstrap difference, the bar spans its bootstrap percentile
interval at level 1 - alpha, and a dashed line or ring marks zero.
Significant pairs are plotted in pos_color when the first edge is
larger and in neg_color when the second edge is larger.
Usage
plot_edge_diff_forest(x, ...)

# S3 method for class 'boot_glasso'
plot_edge_diff_forest(
  x,
  alpha = NULL,
  layout = c("linear", "circular", "chord", "tile"),
  show_nonsig = FALSE,
  nonzero_only = FALSE,
  sort_by = c("estimate", "significance", "name"),
  n_top = NULL,
  pos_color = "#C0392B",
  neg_color = "#2C6E8A",
  nonsig_color = "#AAAAAA",
  ring_color = "#C8C8C8",
  label_size = 2.3,
  label_color = NULL,
  point_size = if (match.arg(layout) == "circular") 2 else 3,
  r_inner = 0.38,
  r_outer = 0.72,
  title = NULL,
  subtitle = NULL,
  ...
)
Arguments
- x
A
boot_glassoobject with$boot_edgesand$edge_diff_p.- ...
Currently unused.
- alpha
Significance threshold. Default
NULL, which inheritsx$alpha, falling back to0.05. The tile layout always usesx$alpha.- layout
"linear"(default),"circular","chord", or"tile". The chord layout places all edge names on a unit circle and connects significant pairs with Bezier arcs whose width and color encode the mean bootstrap difference. The tile layout plots the full pairwise-difference matrix and ignoresshow_nonsig,nonzero_only,sort_by,n_topand the label and point arguments.- show_nonsig
Logical. Include non-significant pairs. Default
FALSE.- nonzero_only
If
TRUE, restrict to edges that are non-zero in the original network ($original_pcor). Without$original_pcor, edges whose absolute mean bootstrap weight is at least 10 percent of the largest are kept. DefaultFALSE.- sort_by
"estimate"(default),"significance", or"name"(linear layout only). Whenn_topis set, the retained pairs are ordered by estimate.- n_top
Restrict to top N pairs by absolute difference.
- pos_color
Color when edge1 > edge2. Default
"#C0392B"(crimson).- neg_color
Color when edge1 < edge2. Default
"#2C6E8A"(teal-blue).- nonsig_color
Color for non-significant pairs. Default
"#AAAAAA".- ring_color
Ring color (circular and chord layouts). Default
"#C8C8C8".- label_size
Text size of edge labels (circular and chord layouts). Default
2.3.- label_color
Fixed label color (circular and chord layouts).
NULL(default) uses the pair color in the circular layout and dark grey in the chord layout.- point_size
Size of estimate square (linear and circular layouts). Default
2forlayout = "circular"and3otherwise.- r_inner
Inner ring radius (circular). Default
0.38.- r_outer
Outer ring radius (circular). Default
0.72.- title
Plot title. Default
NULL.- subtitle
Plot subtitle. Default
NULL.
Examples
set.seed(1)
data1 <- as.data.frame(matrix(rnorm(60), 20, 3, dimnames = list(NULL, c("A","B","C"))))
bg <- Nestimate::boot_glasso(data1, iter = 50, cs_iter = 25,
                             centrality = c("strength", "expected_influence"))
plot_edge_diff_forest(bg)