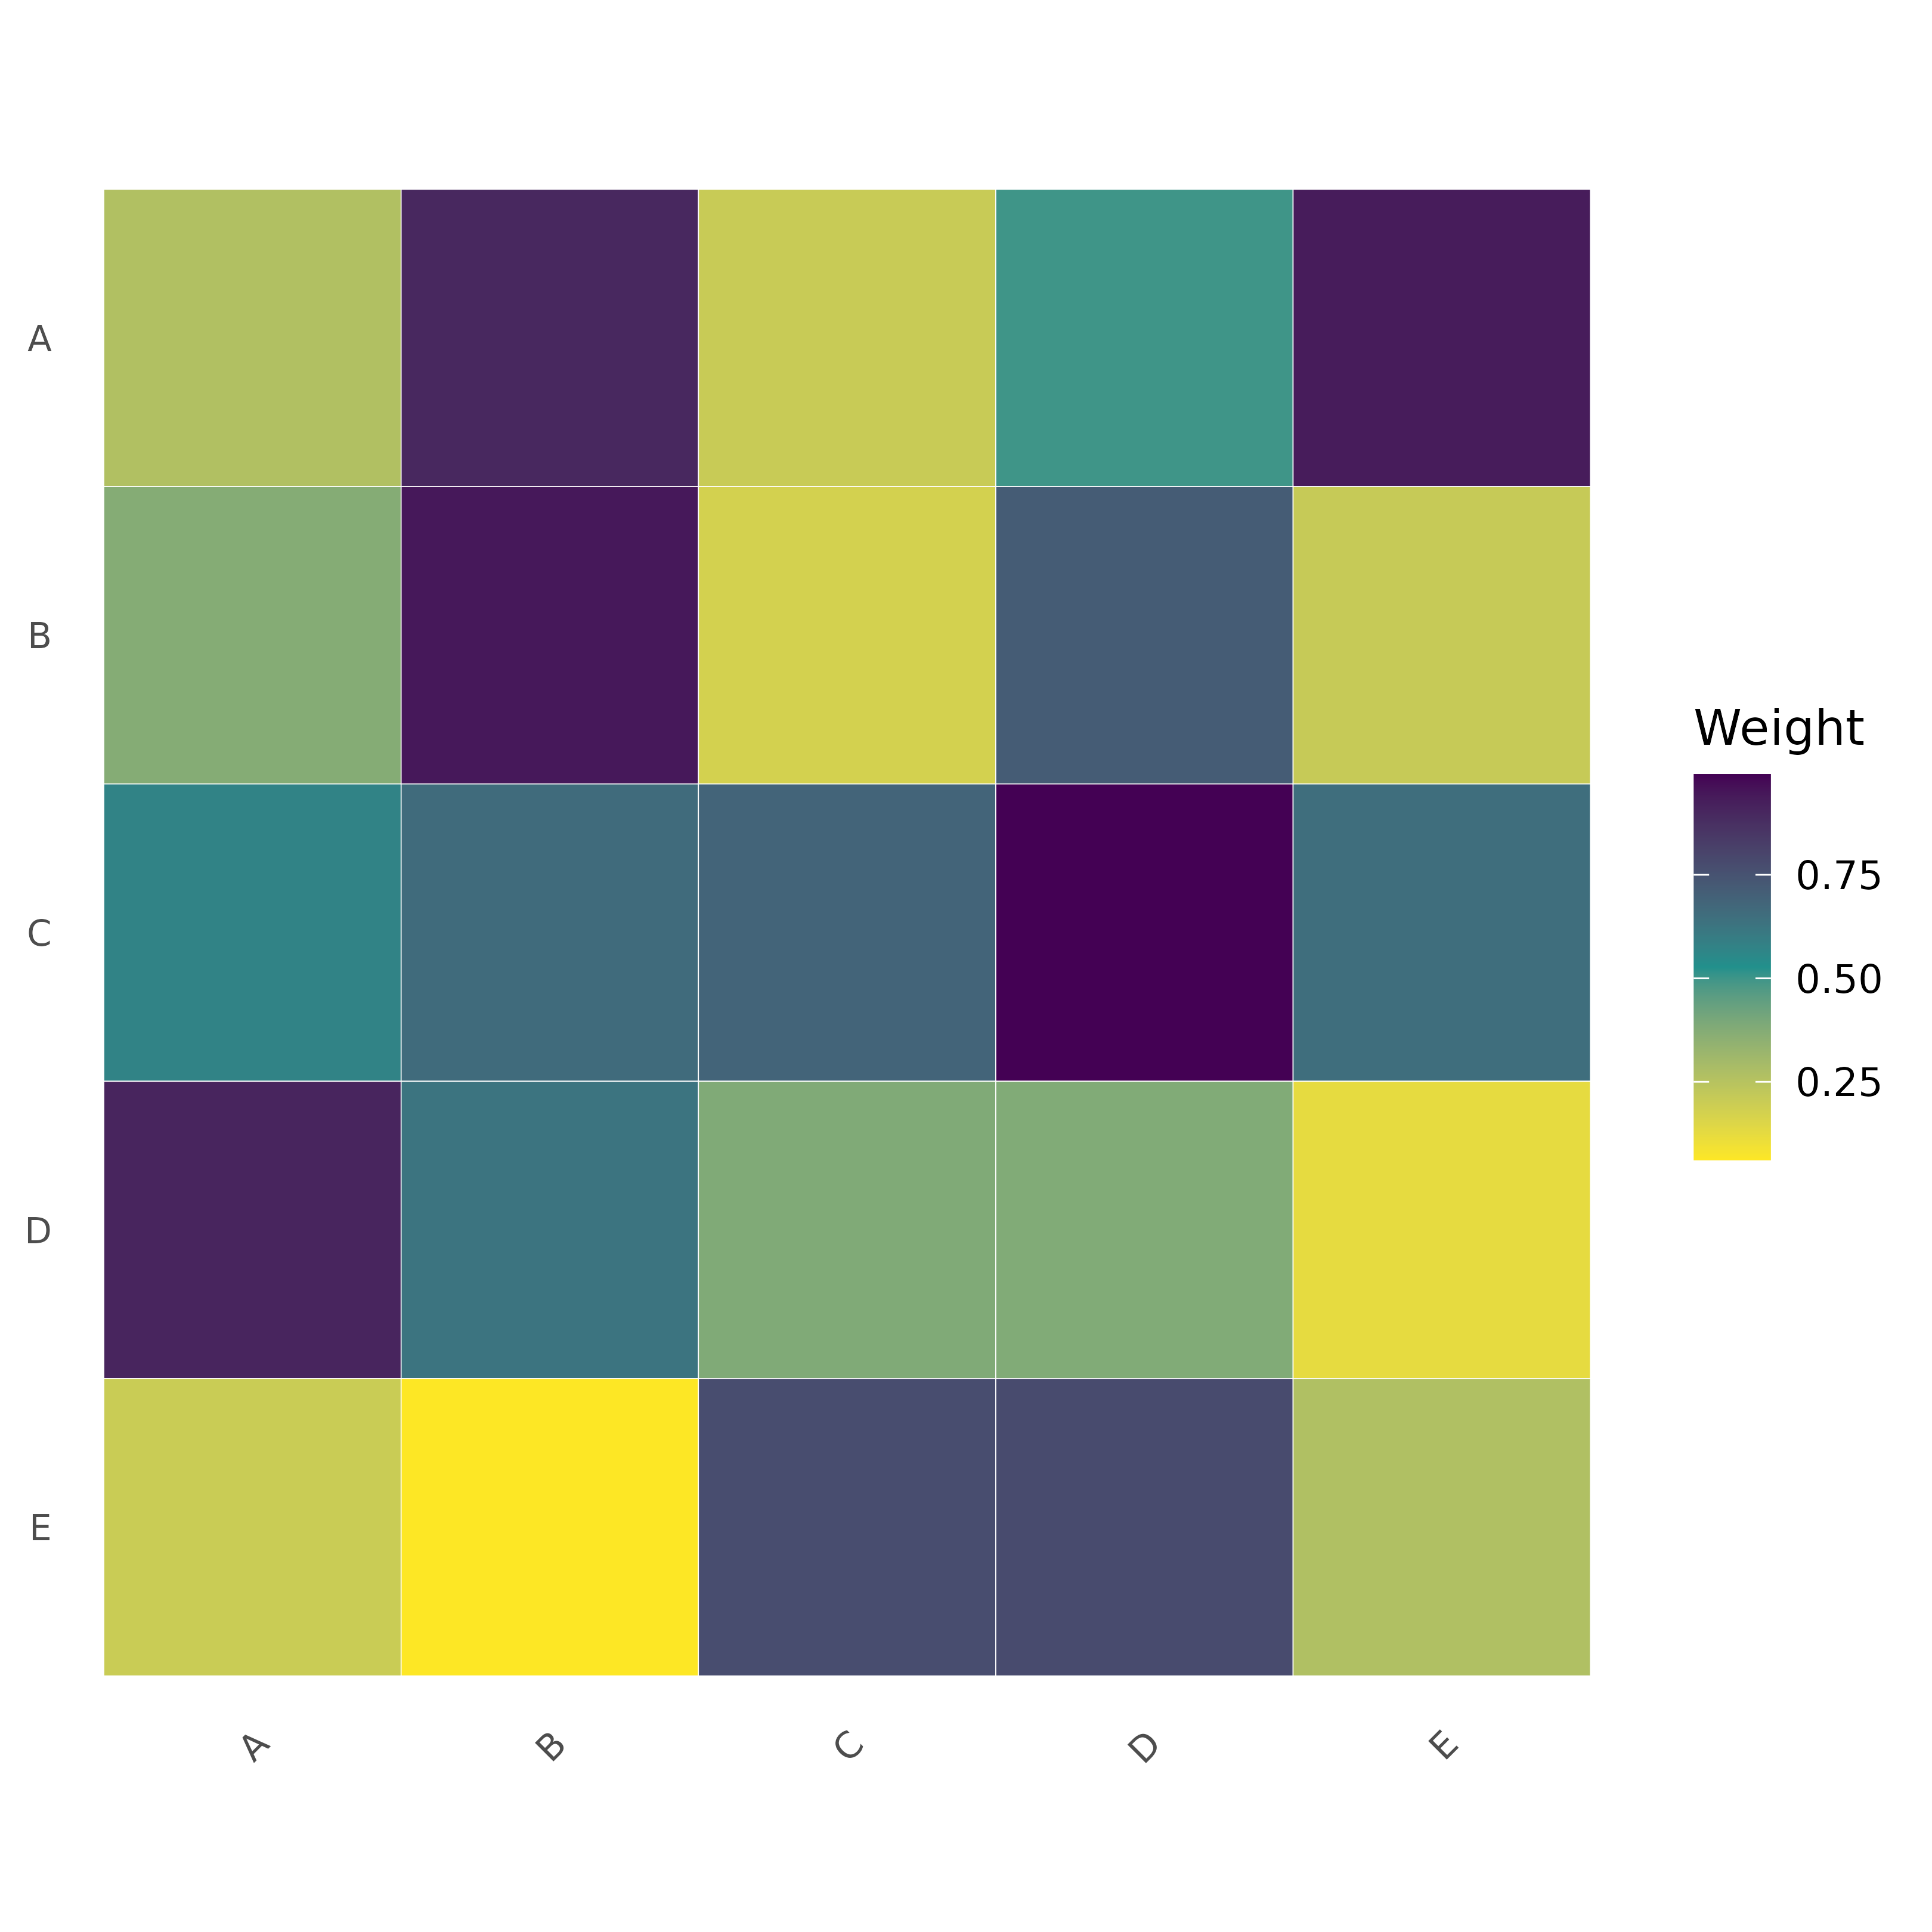
Visualizes a network weight matrix as a heatmap. Single networks,
clustered networks (blocks along the diagonal), and multi-group networks
(group_tna, as a supra-adjacency matrix) are supported.
Usage
plot_heatmap(
  x,
  cluster_list = NULL,
  cluster_spacing = 0,
  show_legend = TRUE,
  legend_position = "right",
  legend_title = "Weight",
  colors = "viridis",
  limits = NULL,
  midpoint = NULL,
  na_color = "grey90",
  show_values = FALSE,
  value_size = 2.5,
  value_color = "black",
  value_fontface = "plain",
  value_fontfamily = "sans",
  value_halo = NULL,
  value_digits = 2,
  show_diagonal = TRUE,
  diagonal_color = NULL,
  cluster_labels = TRUE,
  cluster_borders = TRUE,
  border_color = "black",
  border_width = 0.5,
  row_labels = NULL,
  col_labels = NULL,
  show_axis_labels = TRUE,
  axis_text_size = 8,
  axis_text_angle = 45,
  title = NULL,
  subtitle = NULL,
  xlab = NULL,
  ylab = NULL,
  threshold = 0,
  aspect_ratio = 1,
  ...
)
Arguments
- x
Network input: matrix, CographNetwork, cograph_network, tna, igraph, group_tna, or a list-like object with a
$weightsmatrix.- cluster_list
Optional list of character vectors of node names defining node clusters. The matrix is reordered so that clusters form blocks along the diagonal. Nodes not listed are dropped, and a listed name that is not in the matrix is an error.
- cluster_spacing
Gap size between clusters (in cell units). Default 0.
- show_legend
Logical: display color legend? Default TRUE.
- legend_position
Position: "right" (default), "left", "top", "bottom", "none".
- legend_title
Title for legend. Default "Weight".
- colors
Color palette: a vector of colors for the gradient, a palette name ("viridis", "heat", "blues", "reds", "greens", "diverging"), or a single color name, which gives a gradient from white to that color. With a diverging scale the first three colors are used as low, mid and high. Two colors are used as low and high around a white midpoint, and a single color name is used as the high end, with the blue low end and the light gray midpoint of the "diverging" palette. Default "viridis".
- limits
Numeric vector c(min, max) for color scale. NULL for auto.
- midpoint
Midpoint of a diverging scale. Supplying it makes the scale diverging. With the default NULL, the scale is diverging around 0 when the values span negative and positive numbers.
- na_color
Color for NA values. Default "grey90".
- show_values
Logical: display values in cells? Default FALSE.
- value_size
Text size for cell values. Default 2.5.
- value_color
Color for cell value text. Default "black".
- value_fontface
Font face for values: "plain", "bold", "italic", "bold.italic". Default "plain".
- value_fontfamily
Font family for values: "sans", "serif", "mono". Default "sans".
- value_halo
Halo color behind value labels for readability on dark cells. Set to a color (e.g., "white") to enable, or NULL (default) to disable.
- value_digits
Decimal places for values. Default 2.
- show_diagonal
Logical: show diagonal values? Default TRUE.
- diagonal_color
Currently unused. Diagonal cells use the fill scale unless they are hidden with
show_diagonal = FALSE.- cluster_labels
Logical: show cluster or group labels? With a
cluster_list, labels are shown only when the list is named. Forgroup_tnainput the group names are shown. Default TRUE.- cluster_borders
Logical: plot borders around clusters? Default TRUE.
- border_color
Color for cluster borders. Default "black".
- border_width
Width of cluster borders. Default 0.5.
- row_labels
Row labels for a single-network heatmap. NULL uses the row names or indices.
- col_labels
Column labels for a single-network heatmap. NULL uses the column names or indices.
- show_axis_labels
Logical: show axis tick labels? Default TRUE. A clustered heatmap never shows axis tick labels.
- axis_text_size
Size of axis labels. Default 8.
- axis_text_angle
Angle for x-axis labels. Default 45.
- title
Plot title. Default NULL, which gives no title, or "Supra-Adjacency Heatmap" for
group_tnainput.- subtitle
Plot subtitle. Default NULL.
- xlab
X-axis label. Default NULL.
- ylab
Y-axis label. Default NULL.
- threshold
Minimum absolute value to display. Values with
abs(value) < thresholdare set to zero. It is not applied togroup_tnainput. Default 0.- aspect_ratio
Aspect ratio. Default 1 (square cells).
- ...
Additional arguments (currently unused).