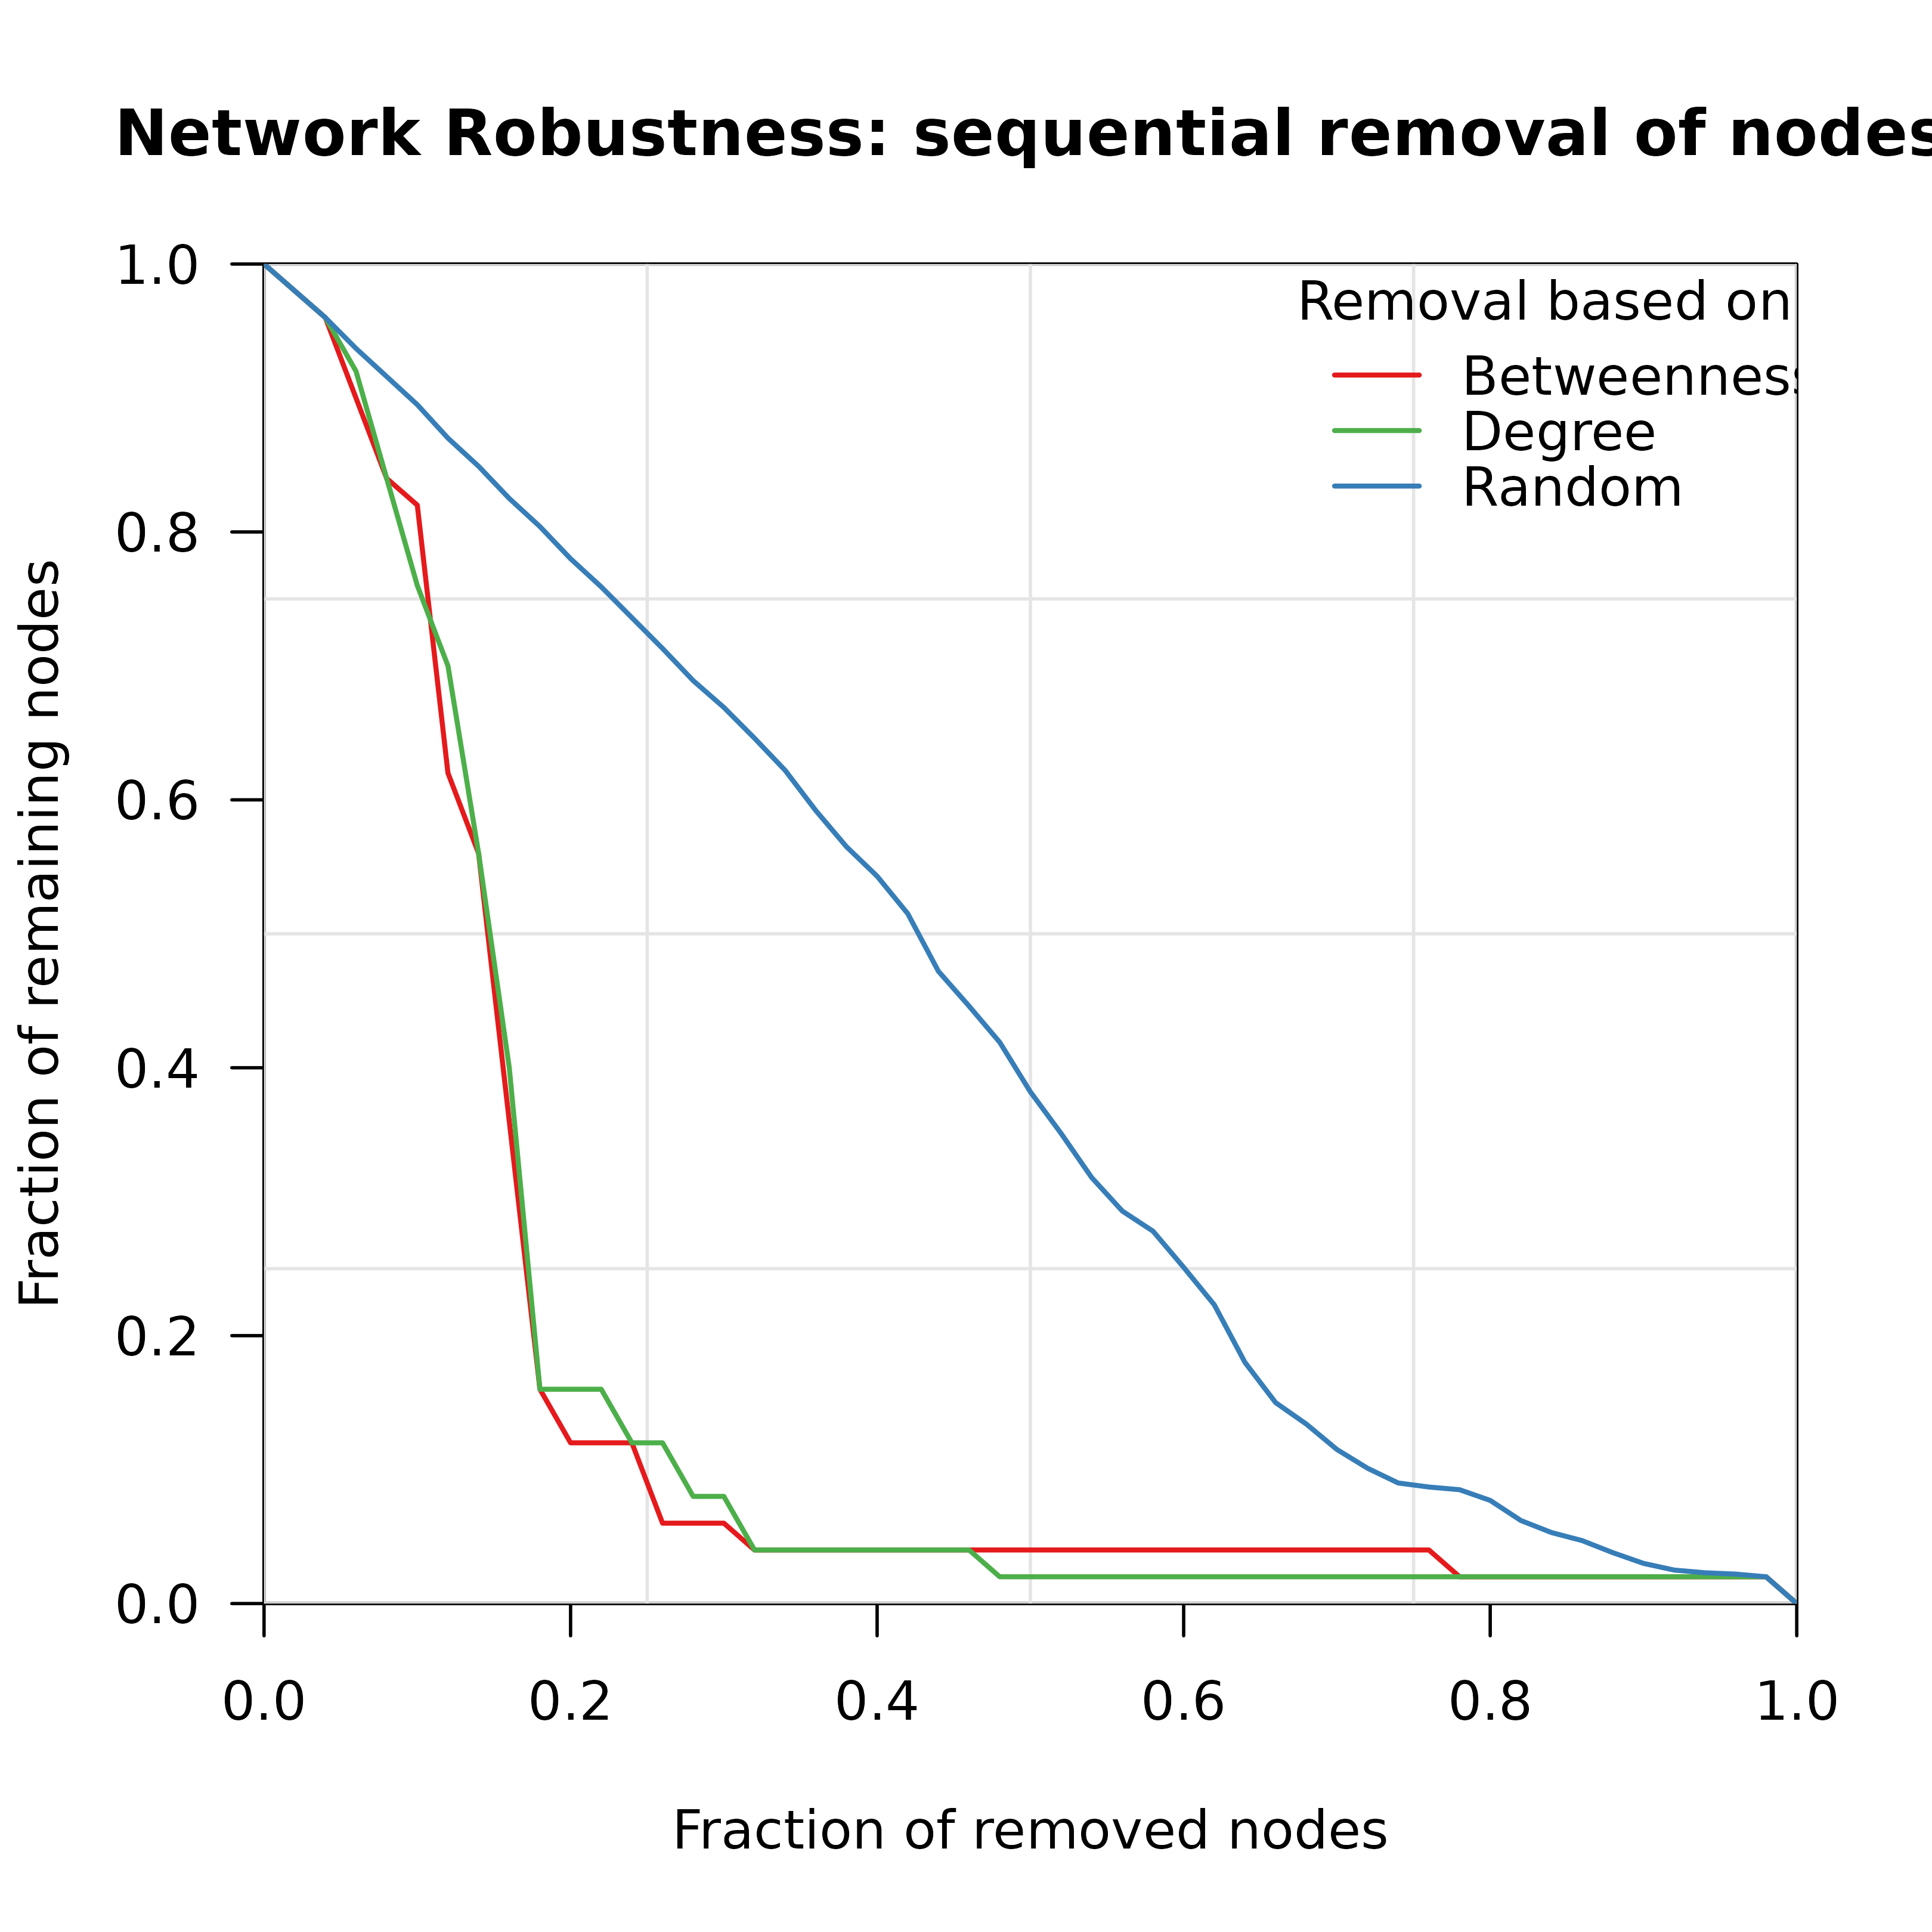
Plots the fraction of nodes remaining in the largest connected component against the fraction of nodes or edges removed, with one line per attack strategy, in base graphics.
Usage
plot_robustness(
  ...,
  x = NULL,
  measures = c("betweenness", "degree", "random"),
  colors = NULL,
  title = "Network Robustness: sequential removal of nodes",
  xlab = "Fraction of removed nodes",
  ylab = "Fraction of remaining nodes",
  lwd = 1.5,
  legend_pos = "topright",
  n_iter = 1000,
  seed = NULL,
  type = "vertex"
)
Arguments
- ...
One or more robustness results from
robustness. When these are supplied,xis ignored.- x
Network on which robustness is computed for each of
measures. Used when...is empty.- measures
Character vector of attack strategies to compare when
xis supplied. Default c("betweenness", "degree", "random").- colors
Vector of colors named by measure (
"betweenness","degree","random"). Default NULL uses red for betweenness, green for degree and blue for random. Unmatched measures are gray.- title
Plot title. Default "Network Robustness: sequential removal of nodes".
- xlab
X-axis label. Default "Fraction of removed nodes".
- ylab
Y-axis label. Default "Fraction of remaining nodes".
- lwd
Line width. Default 1.5.
- legend_pos
Legend position. Default "topright".
- n_iter
Number of iterations for random removal when
xis supplied. Default 1000.- seed
Random seed. Default NULL.
- type
Removal type, "vertex" or "edge", when
xis supplied. Default "vertex". With "edge",measuresmust not include "degree".
Value
Invisibly, a cograph_robustness data frame that stacks the
plotted results (columns as in robustness).