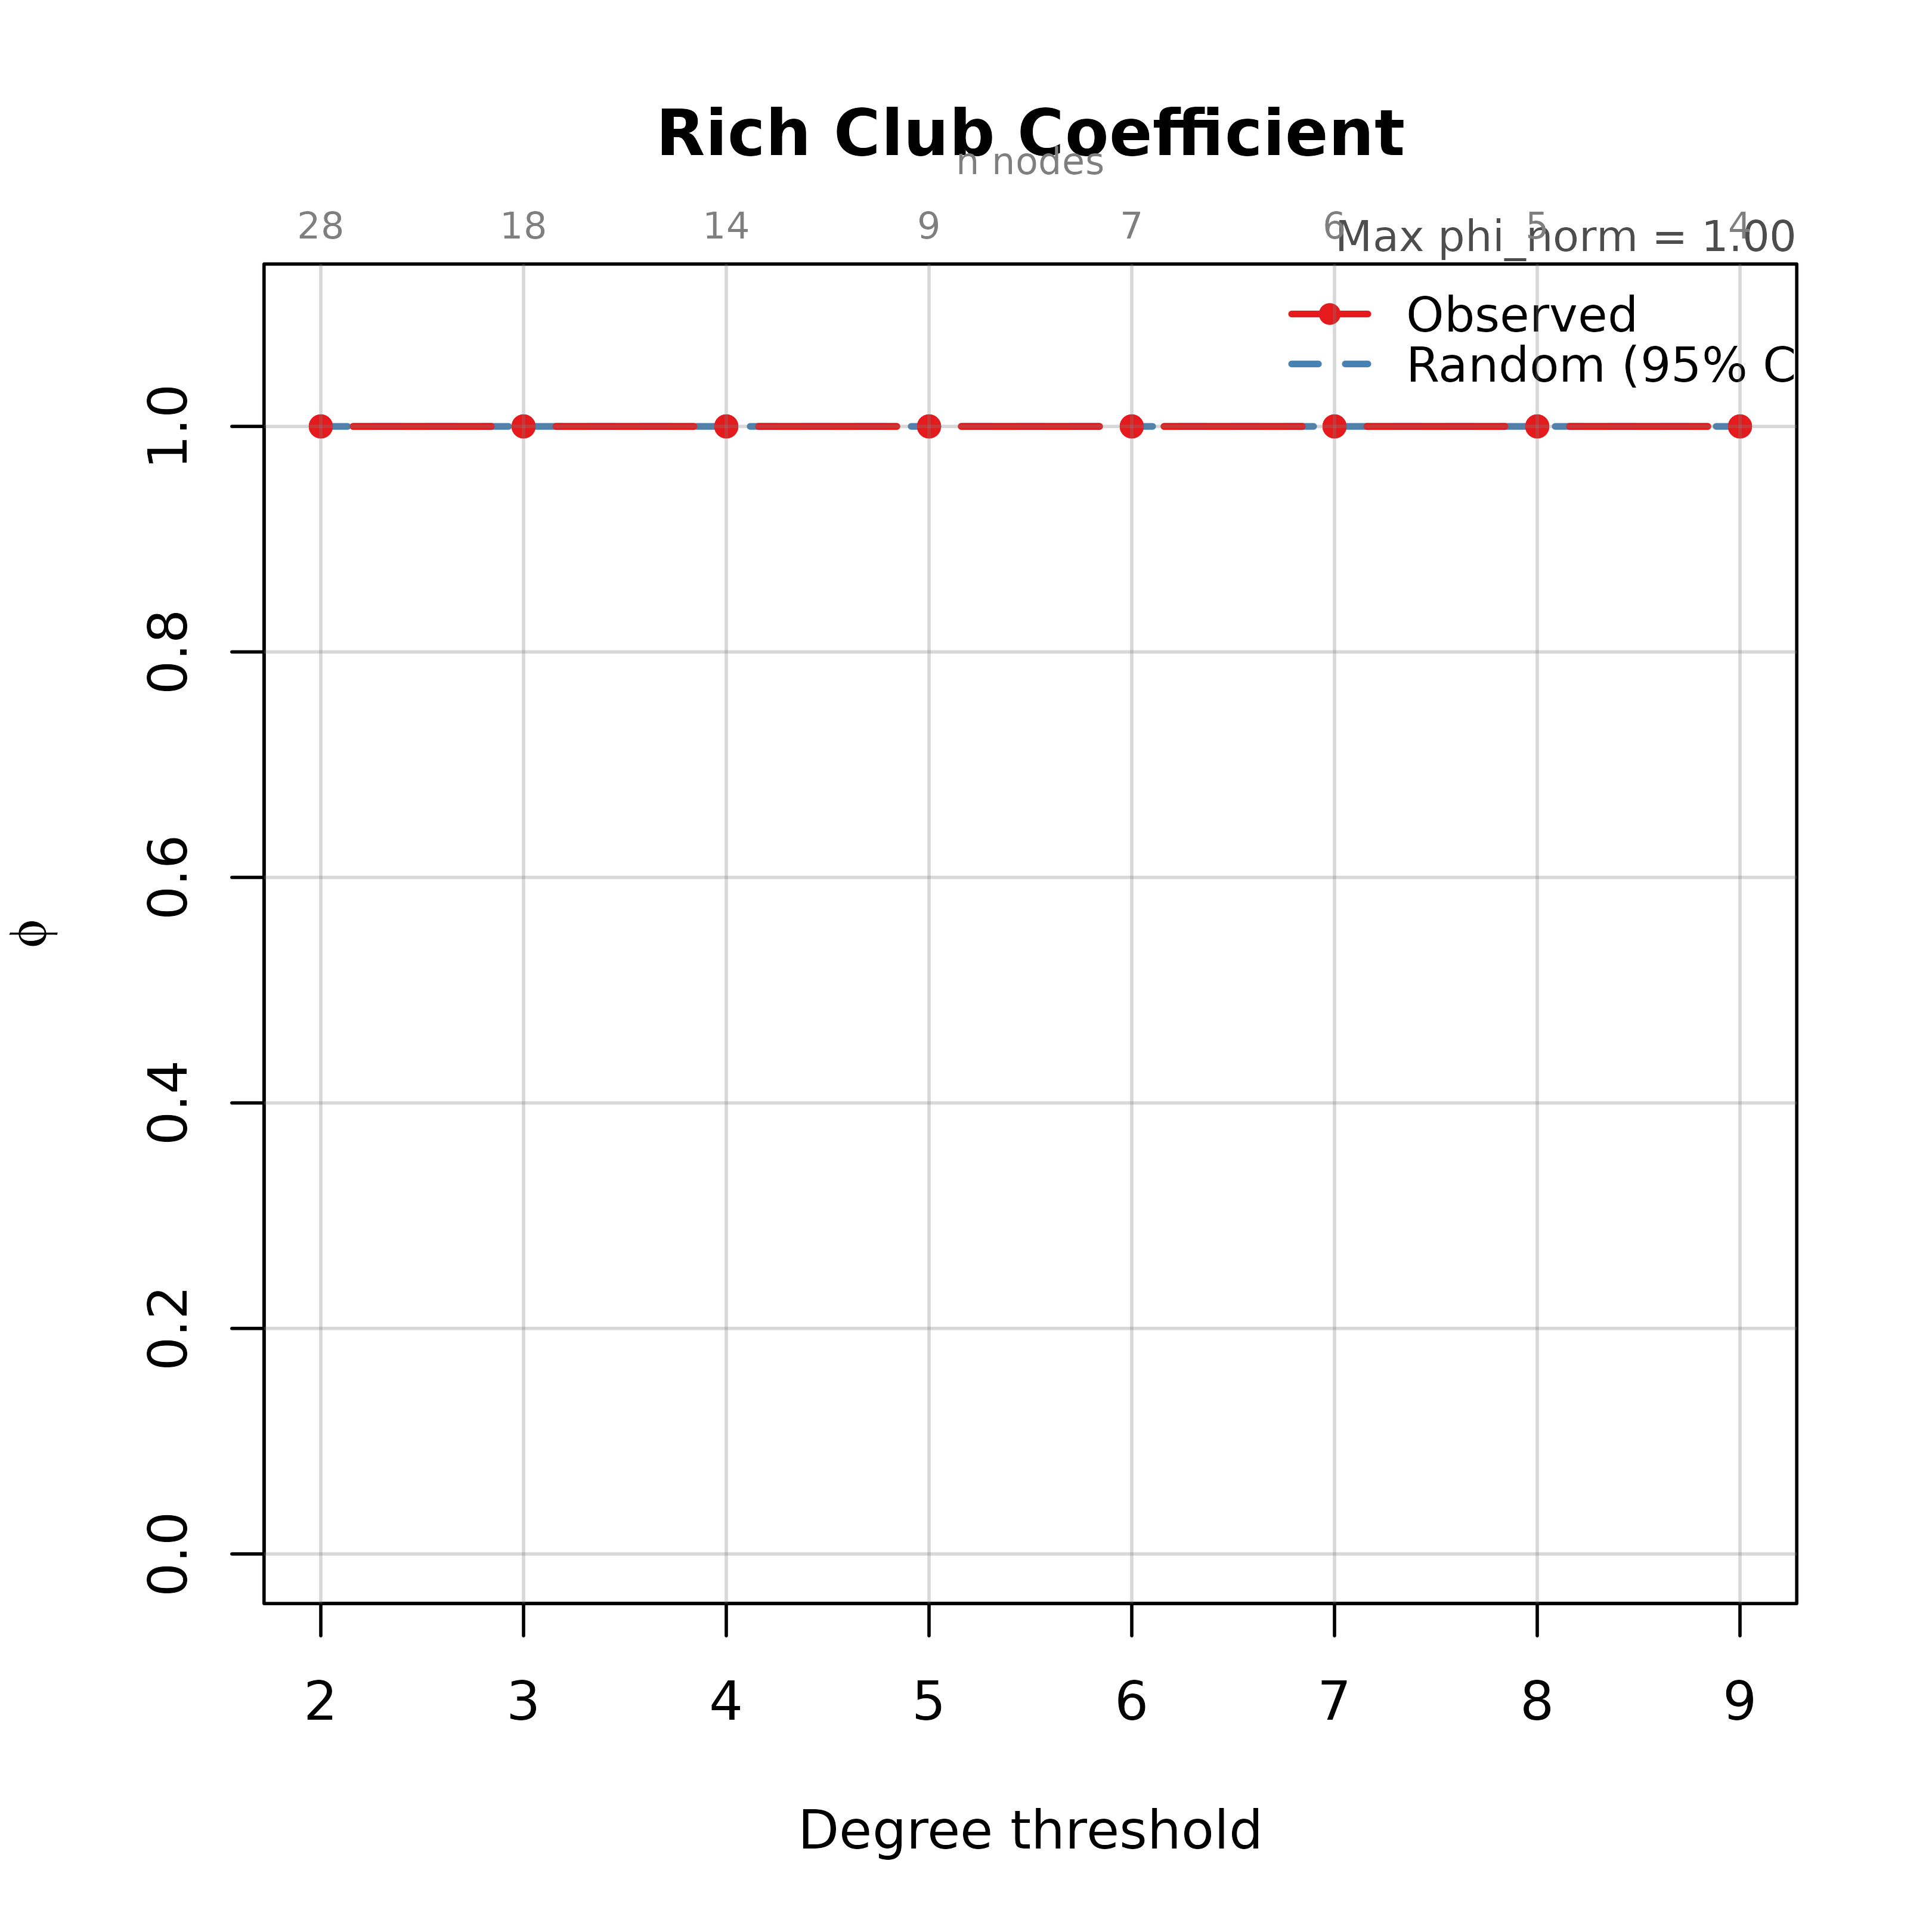
Computes the rich club curve across all prominence thresholds, measuring whether prominent nodes preferentially direct their strongest ties toward each other. Supports both unweighted (Colizza et al. 2006) and weighted (Opsahl et al. 2008) formulations.
Usage
rich_club(
  x,
  rich = c("k", "s"),
  weighted = TRUE,
  normalized = TRUE,
  n_random = 100,
  directed = NULL,
  seed = NULL,
  digits = NULL,
  ...
)
Arguments
- x
Network input: matrix, igraph, network, cograph_network, or tna object.
- rich
Character. Prominence definition:
"k"(degree, default) or"s"(strength / weighted degree).- weighted
Logical. If TRUE (default), compute the weighted rich club coefficient. If FALSE, compute the unweighted version (density among rich nodes).
- normalized
Logical. If TRUE (default), normalize against degree-preserving random graphs and include confidence intervals.
- n_random
Integer. Number of random graphs for normalization. Default 100.
- directed
Logical or NULL. Default NULL (auto-detect).
- seed
Integer or NULL. Random seed for reproducibility. Default NULL.
- digits
Integer or NULL. Round numeric output. Default NULL.
- ...
Additional arguments passed to
to_igraph.
Value
A data frame with class "cograph_rich_club" and columns:
threshold, n_rich, phi, and if normalized:
phi_norm, phi_rand, ci_lo, ci_hi.
Details
Unweighted: \(\phi(k) = 2 E_{>k} / (N_{>k} (N_{>k} - 1))\)
Weighted: \(\phi^w(k) = W_{>k} / \sum_{l=1}^{E_{>k}} w_l^{ranked}\)
Normalization: \(\phi_{norm} = \phi_{obs} / \bar{\phi}_{rand}\). A value > 1 indicates rich club ordering beyond what the degree sequence alone explains.
References
Opsahl, T., Colizza, V., Panzarasa, P. & Ramasco, J.J. (2008). Prominence and control: The weighted rich-club effect. Physical Review Letters, 101, 168702.
Colizza, V., Flammini, A., Serrano, M.A. & Vespignani, A. (2006). Detecting rich-club ordering in complex networks. Nature Physics, 2, 110-115.