Renders one of three views of an htna network's state frequencies: the upstream treemap (default), a combined actor-coloured bar chart, or a per-actor faceted bar chart.
Usage
plot_frequencies_htna(x, view = c("treemap", "bars", "facet"), ...)Arguments
- x
An htna network from
build_htna().- view
One of
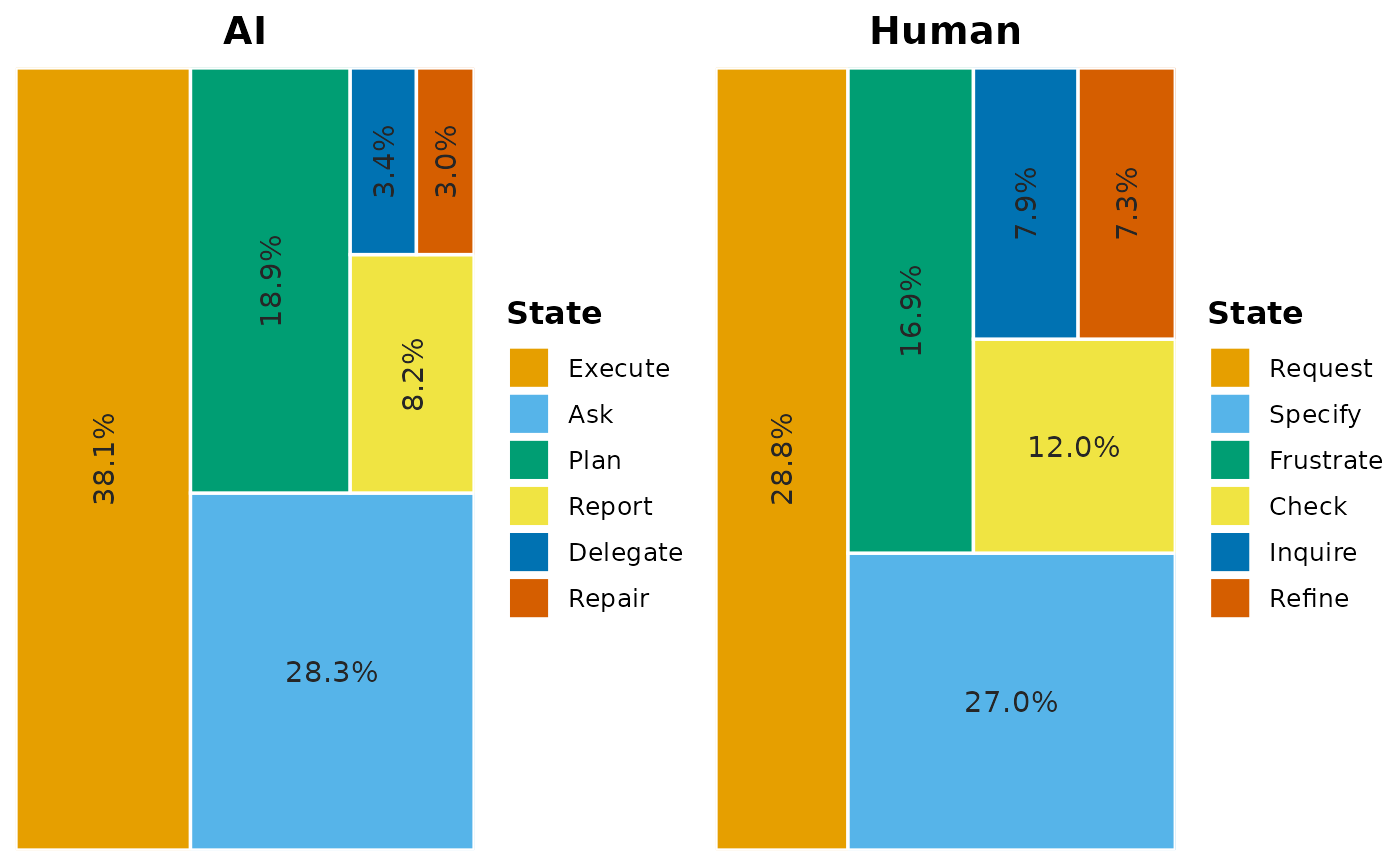
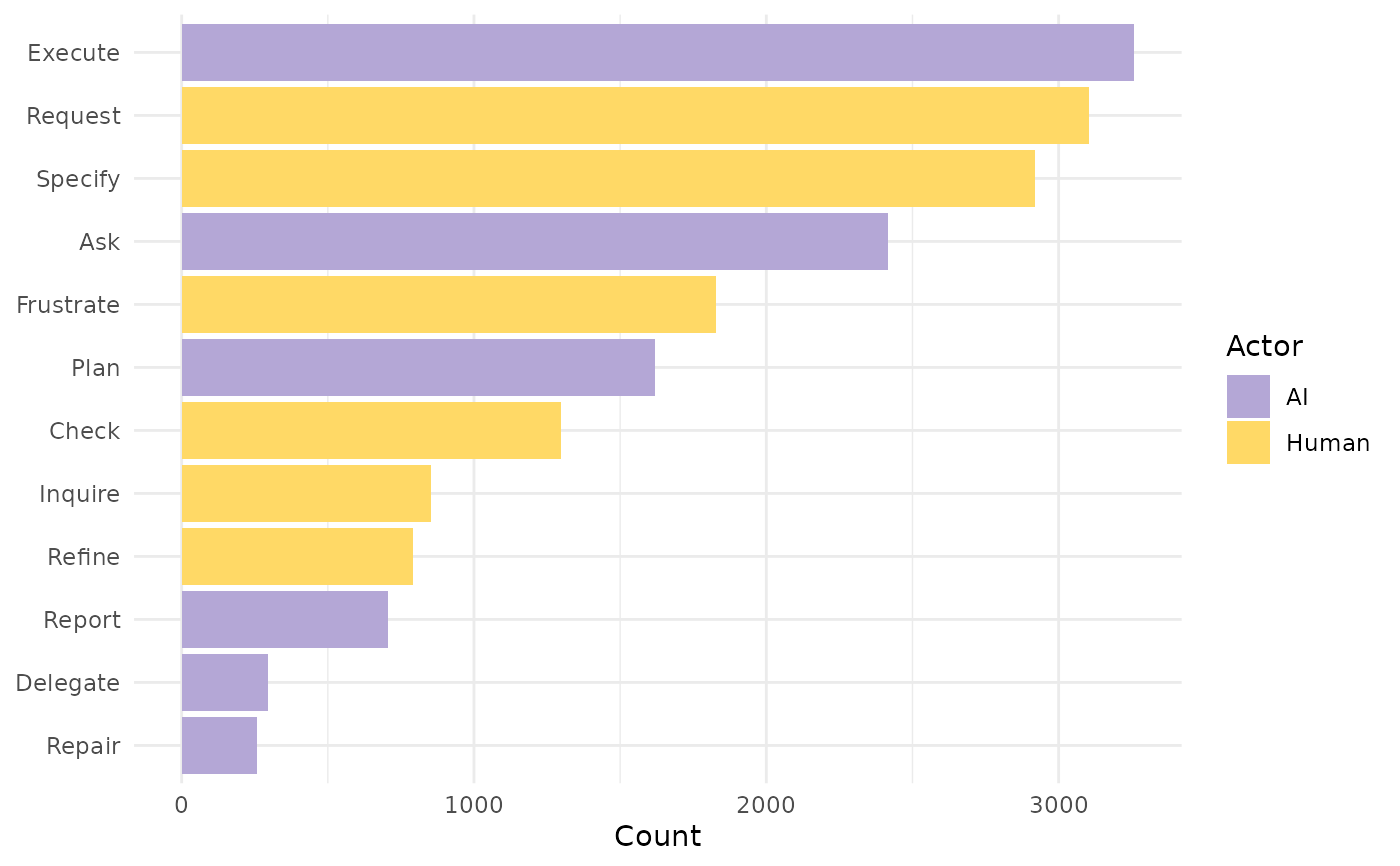
"treemap"(default),"bars", or"facet"."treemap"forwards toNestimate::plot_state_frequencies()and renders the chart automatically; returns the underlyingstate_freqobject invisibly."bars"builds a combined bar chart with all states on one y-axis, sorted by count, fill coloured by actor (usinghtna_palettekeyed offx$actor_levels). Returns the ggplot."facet"builds a per-actor faceted bar chart withscales = "free_y"so each panel only shows its own actor's states. Returns the ggplot.
- ...
Forwarded to
Nestimate::plot_state_frequencies()whenview = "treemap". Ignored for"bars"and"facet"— those return ggplot objects, so customisation works through standard ggplot composition (+ theme(...),+ labs(...),+ scale_fill_*(), etc.).
Value
For view = "treemap": the state_freq object invisibly.
For "bars" / "facet": a ggplot, returned visibly so the
chart auto-prints and standard + composition works.
Details
Suffixed _htna to avoid clashing with
Nestimate::plot_state_frequencies() when both packages are loaded.
See also
frequencies_htna() for the underlying tidy table,
state_frequencies_htna(), state_distribution_htna(),
mosaic_plot_htna().
Examples
# \donttest{
data(human_ai)
net <- build_htna(human_ai, actor_type = "actor_type")
#> Warning: A network with one long sequence is not recommended and can't be validated using bootstrap and other confirmatory testings.
#> Metadata aggregated per session: ties resolved by first occurrence in 'session_date' (1 sessions), 'cluster' (42 sessions), 'actor_type' (24 sessions)
plot_frequencies_htna(net, view = "treemap")
 if (requireNamespace("ggplot2", quietly = TRUE)) {
plot_frequencies_htna(net, view = "bars")
}
if (requireNamespace("ggplot2", quietly = TRUE)) {
plot_frequencies_htna(net, view = "bars")
}
 # }
# }