Plot the Comparison of Two TNA Models or Matrices
Usage
# S3 method for class 'tna_comparison'
plot(
x,
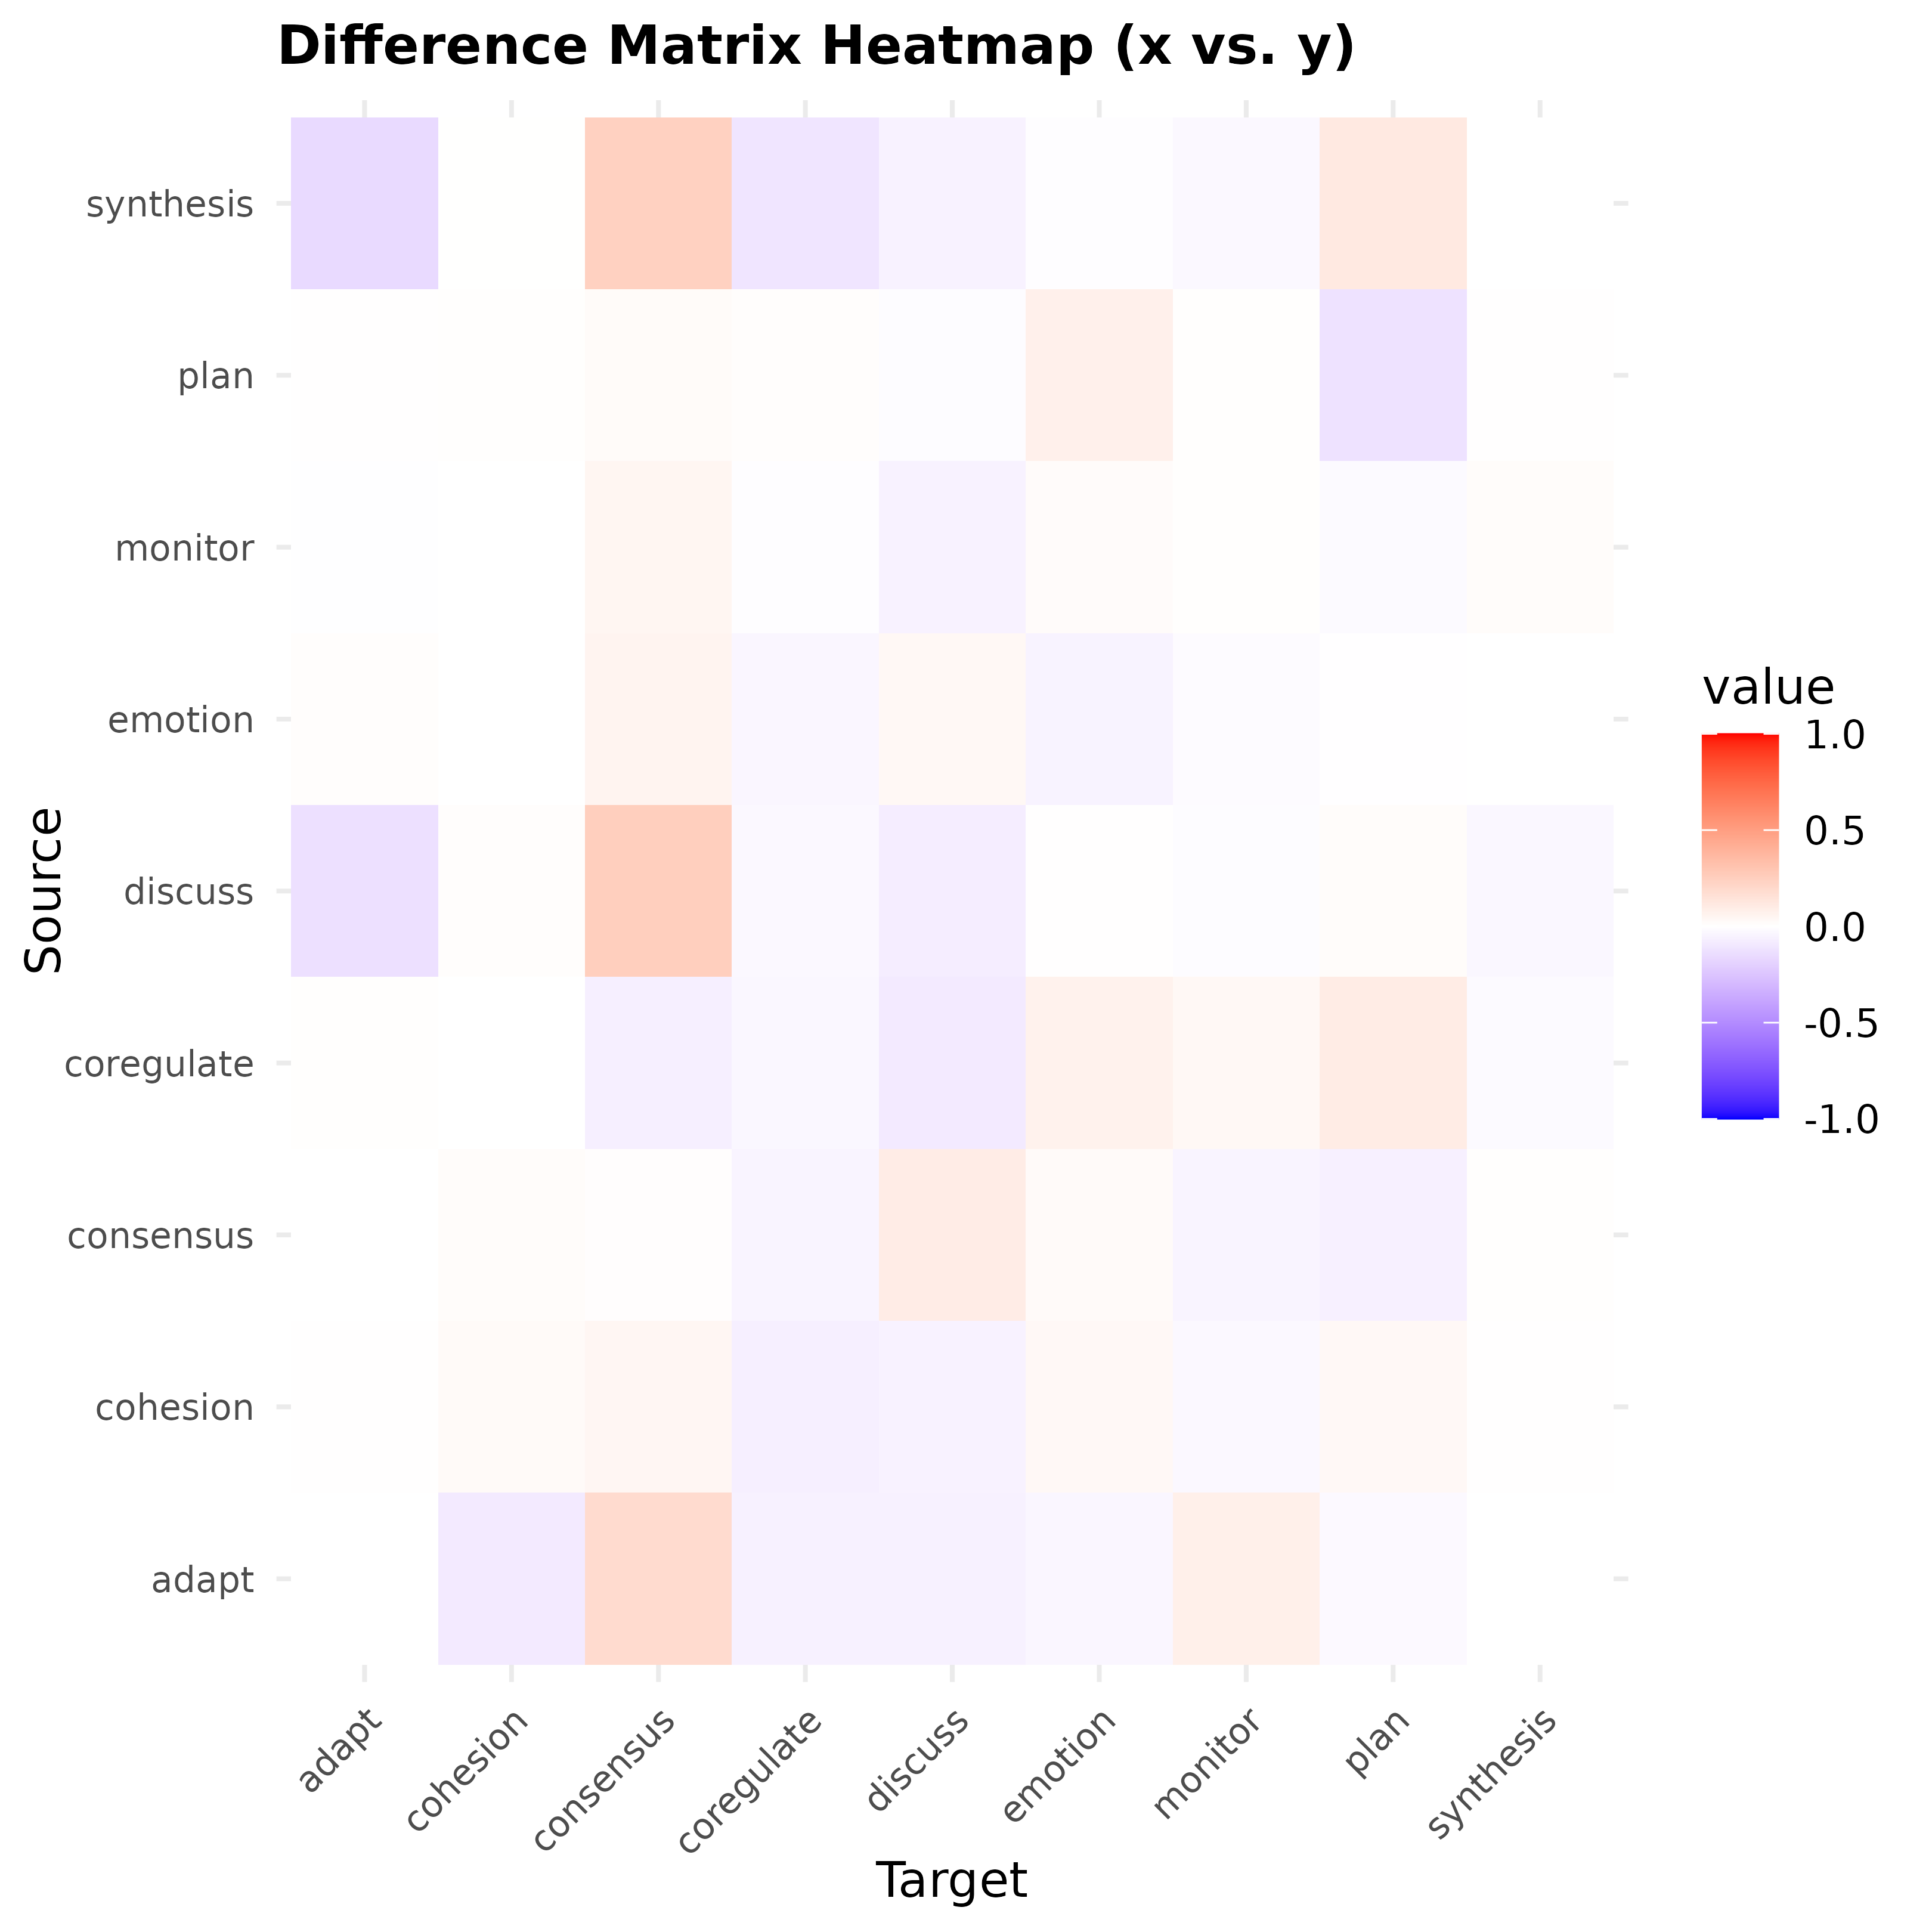
type = "heatmap",
population = "difference",
method = "pearson",
name_x = "x",
name_y = "y",
...
)Arguments
- x
A
tna_comparisonobject.- type
A
characterstring naming the type of plot to produce. The available options are"heatmap"(the default),"scatterplot","centrality_heatmap", and"weight_density".- population
A
"character"string naming the population for which to produce the heatmaps, i.e, one of"x","y", or"difference"for the differences. Ignored fortype = "scatterplot". Defaults to"diff".- method
A
characterstring naming the correlation coefficient to use when plotting a scatterplot. The available options are"pearson"(the default),"kendall","spearman", and"distance". The final option is the distance correlation coefficient of Szekely, Rizzo, and Bakirov (2007). See also theenergypackage for further information on this measure.- name_x
An optional
characterstring to use as the name of the first population in the plots. The default is"x".- name_y
An optional
characterstring to use as the name of the second population in the plots. The default is"y".- ...
Ignored.
References
Szekely, G.J., Rizzo, M.L., and Bakirov, N.K. (2007), Measuring and Testing Dependence by Correlation of Distances, Annals of Statistics, 35(6), 2769-2794. doi:10.1214/009053607000000505