Plot the Frequency Distribution of States
Usage
# S3 method for class 'group_tna'
plot_frequencies(
  x,
  label,
  colors,
  width = 0.7,
  palette = "Set2",
  show_label = TRUE,
  position = "dodge",
  hjust = 1.2,
  ...
)
Arguments
- x
A
group_tnaobject.- label
An optional
characterstring that can be provided to specify the grouping factor name ifxwas not constructed using a column name of the original data.- colors
A
charactervector of colors to be used in the plot (one per group).- width
A
numericvalue for the width of the bars. The default is0.7.- palette
A
characterstring that specifies the palette to be used ifcolorsare not passed.- show_label
A
logicalvalue indicating whether to show a label with the frequency counts. Default isTRUE.- position
Position of the bars:
"dodge","dodge2","fill"or"stack".- hjust
A
numericvalue for the horizontal adjustment of the labels. The default is1.2.- ...
Ignored.
See also
Basic functions
build_model(),
hist.group_tna(),
hist.tna(),
plot.group_tna(),
plot.tna(),
plot_frequencies(),
plot_mosaic(),
plot_mosaic.group_tna(),
plot_mosaic.tna_data(),
print.group_tna(),
print.summary.group_tna(),
print.summary.tna(),
print.tna(),
summary.group_tna(),
summary.tna(),
tna-package
Examples
model <- group_model(engagement_mmm)
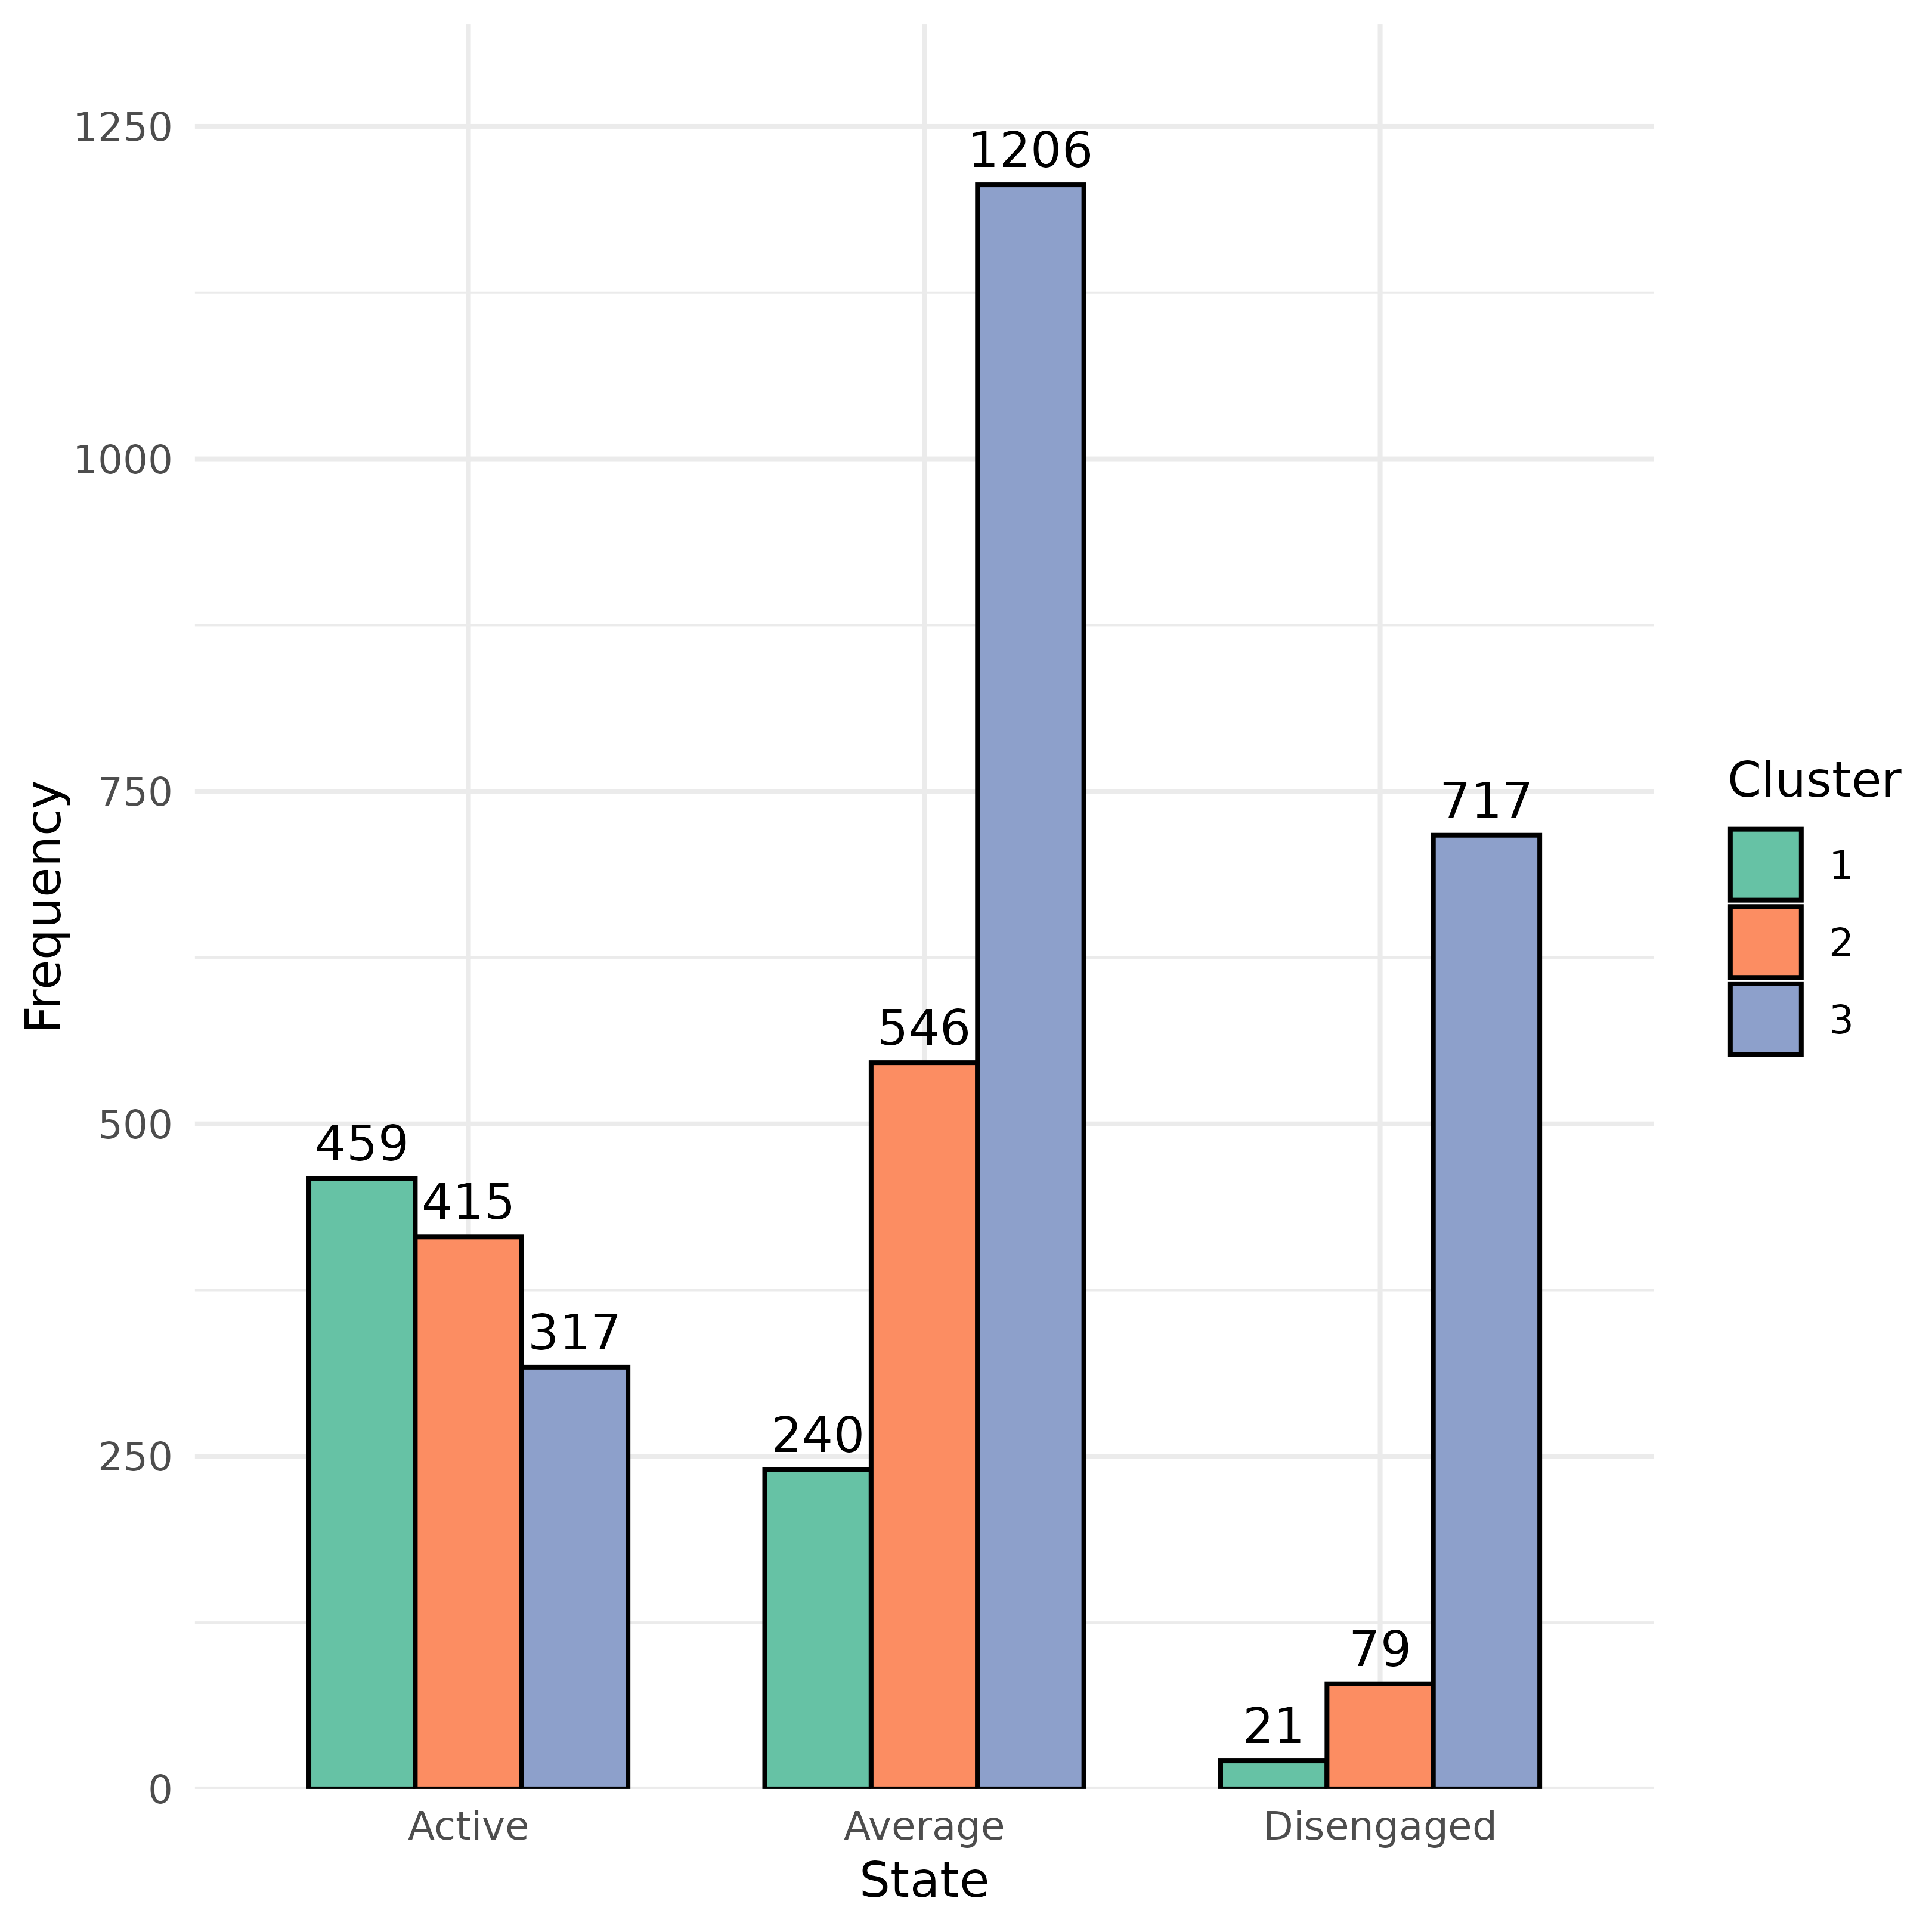
# Default
plot_frequencies(model)
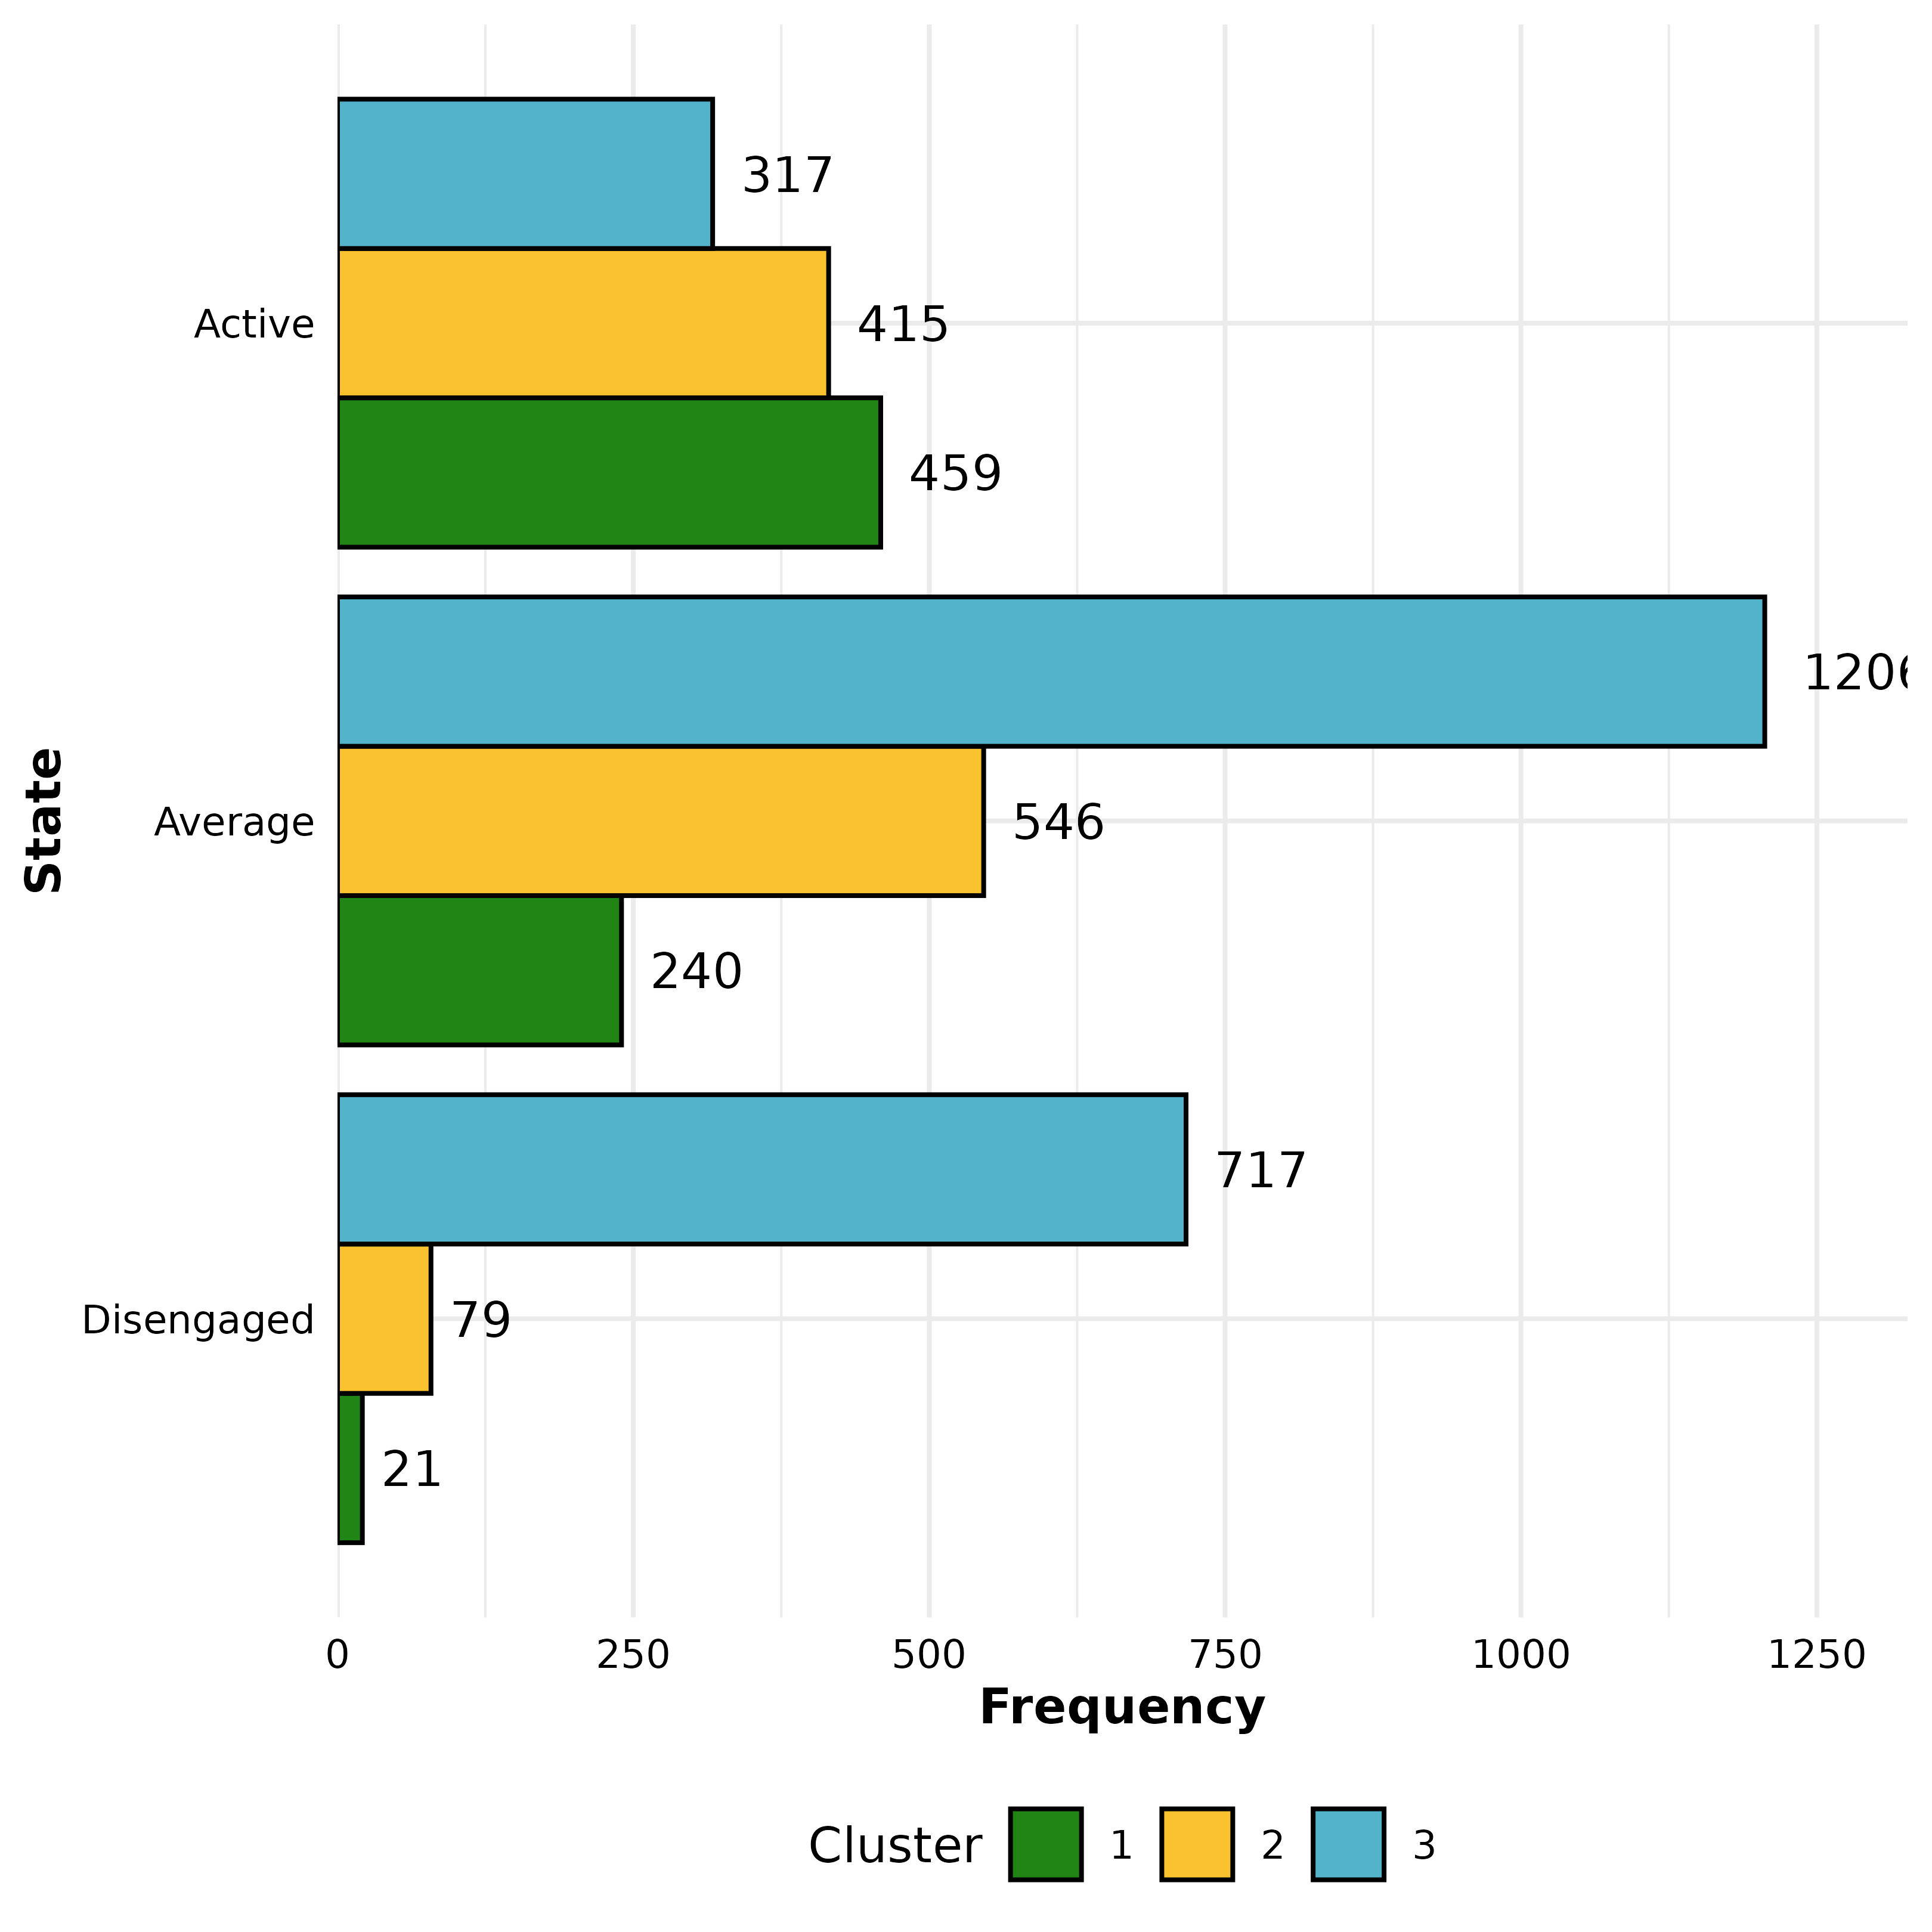
 # Default labels outside and custom colors
plot_frequencies(
model,
width = 0.9,
hjust = -0.3,
colors = c("#218516", "#f9c22e", "#53b3cb")
)
# Default labels outside and custom colors
plot_frequencies(
model,
width = 0.9,
hjust = -0.3,
colors = c("#218516", "#f9c22e", "#53b3cb")
)
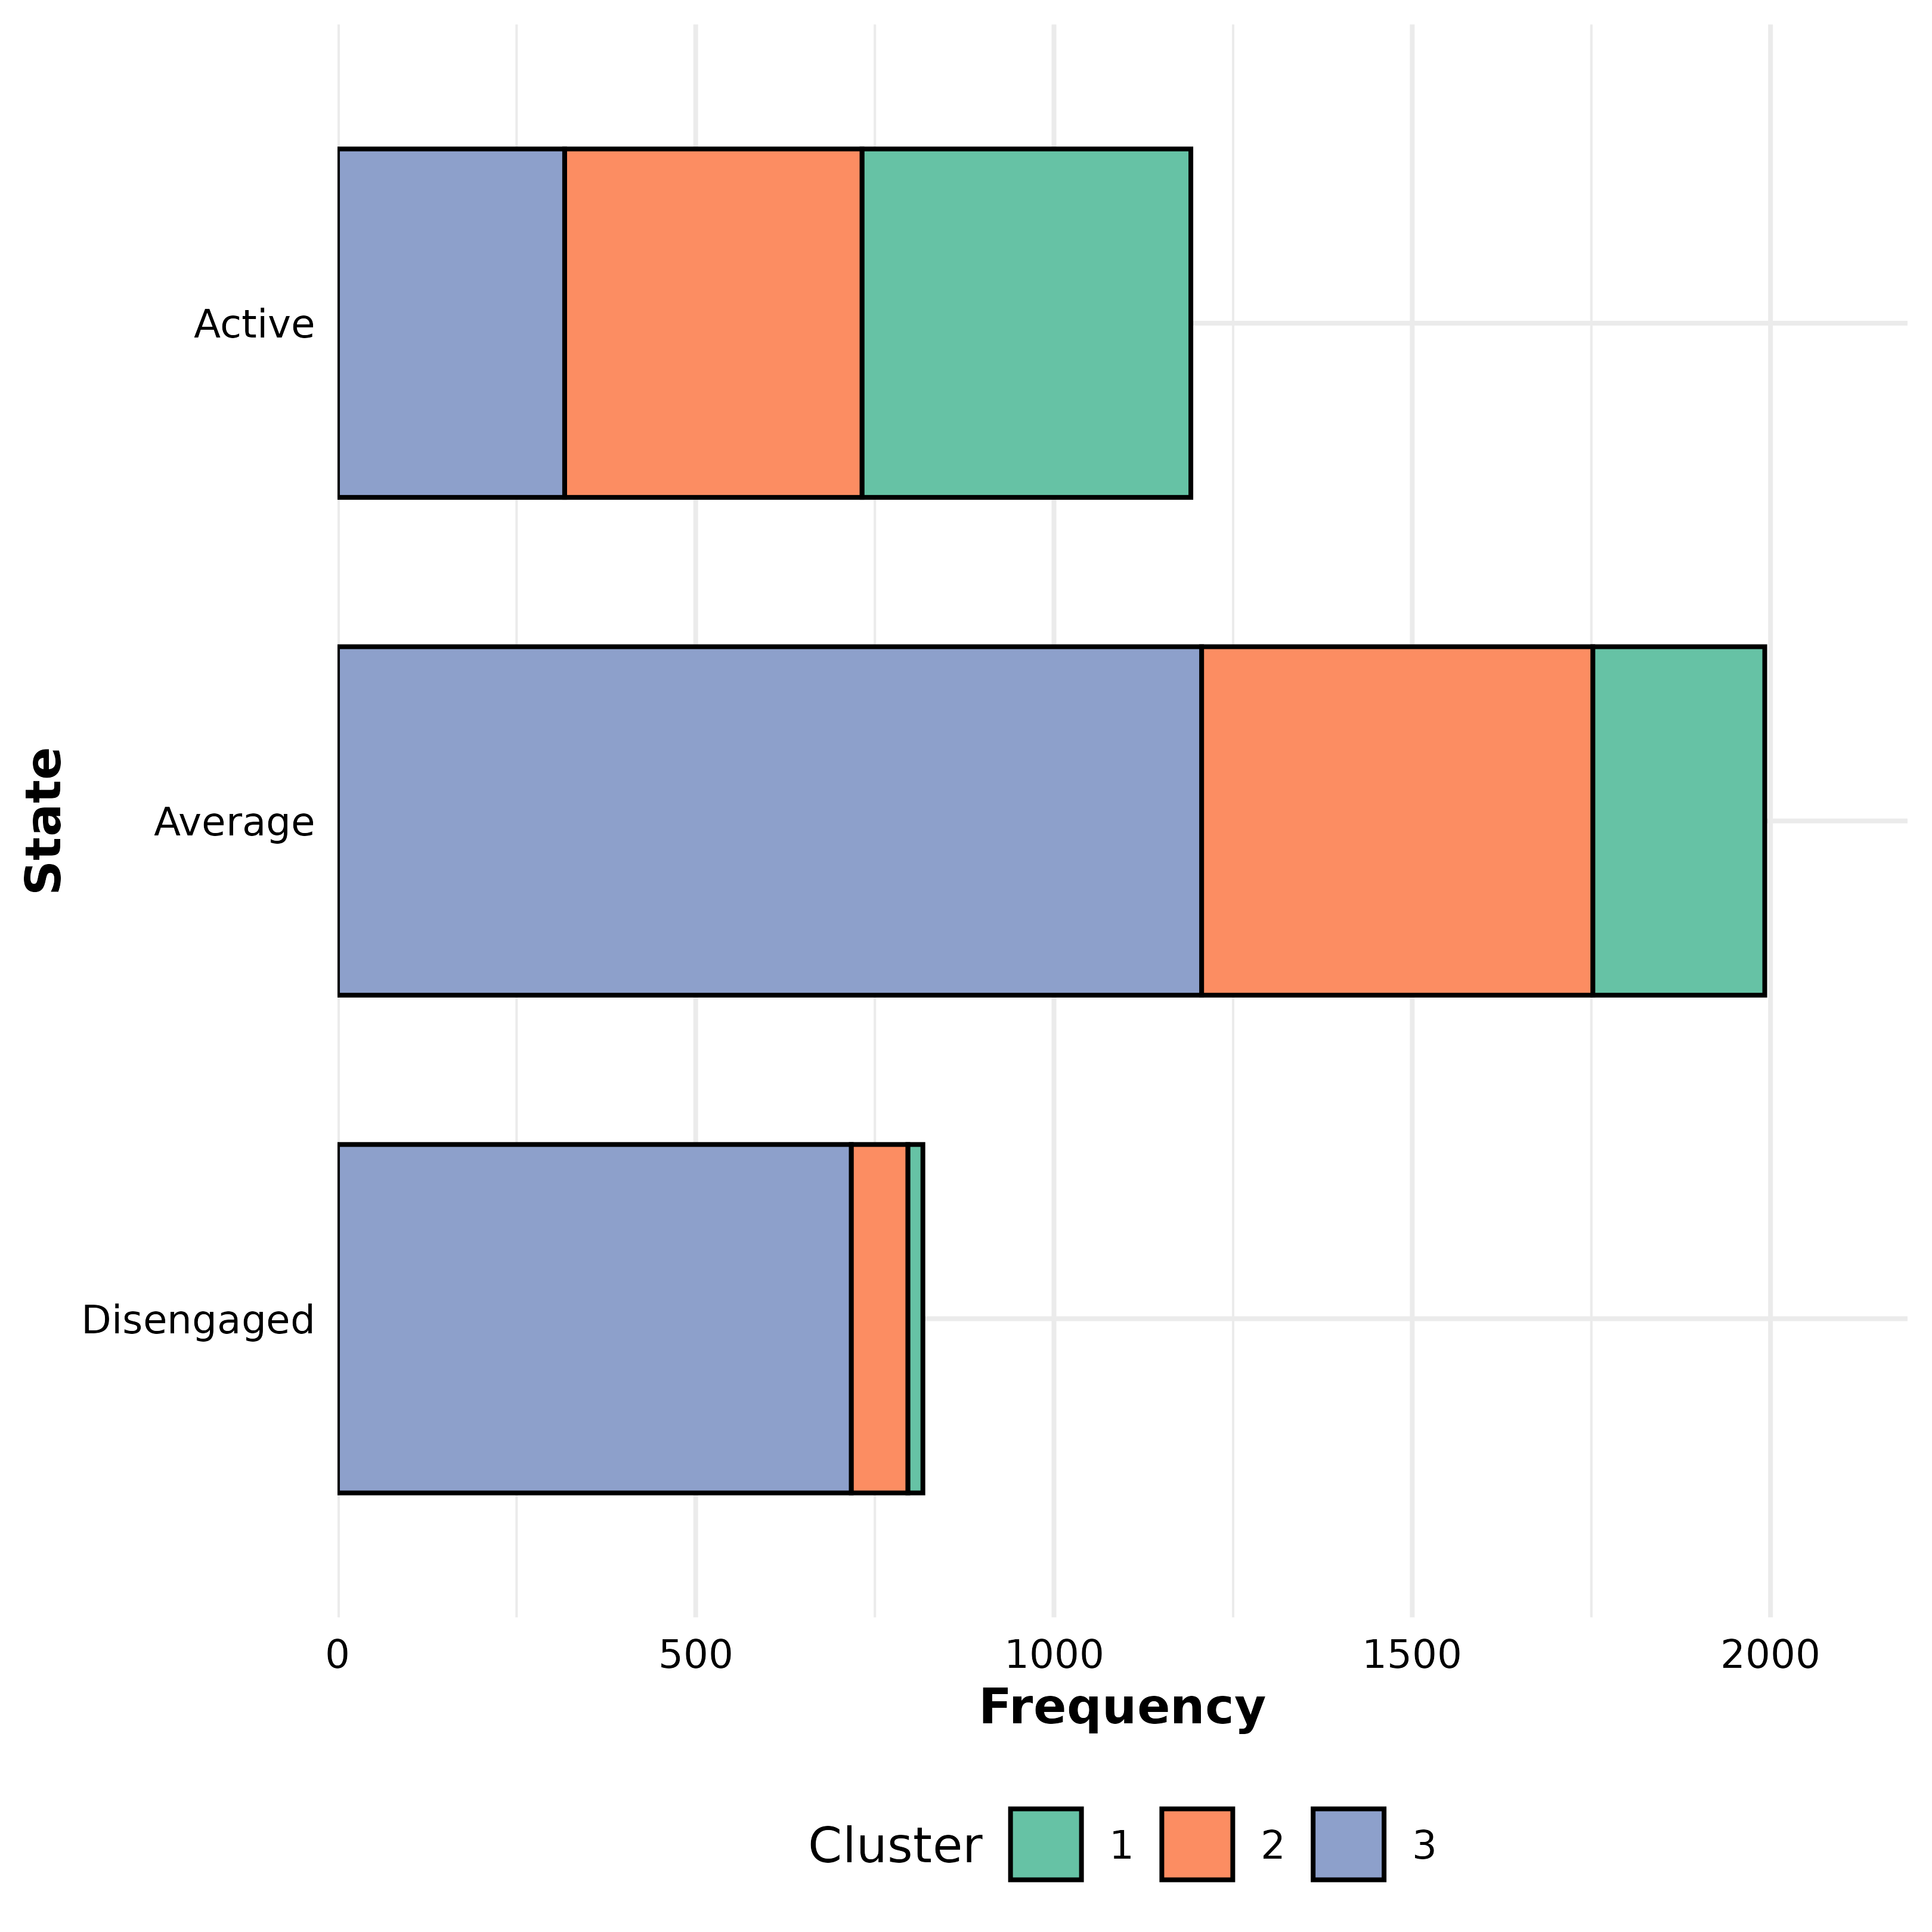
 # Stacked with no labels
plot_frequencies(model, position = "stack", show_label = FALSE)
# Stacked with no labels
plot_frequencies(model, position = "stack", show_label = FALSE)
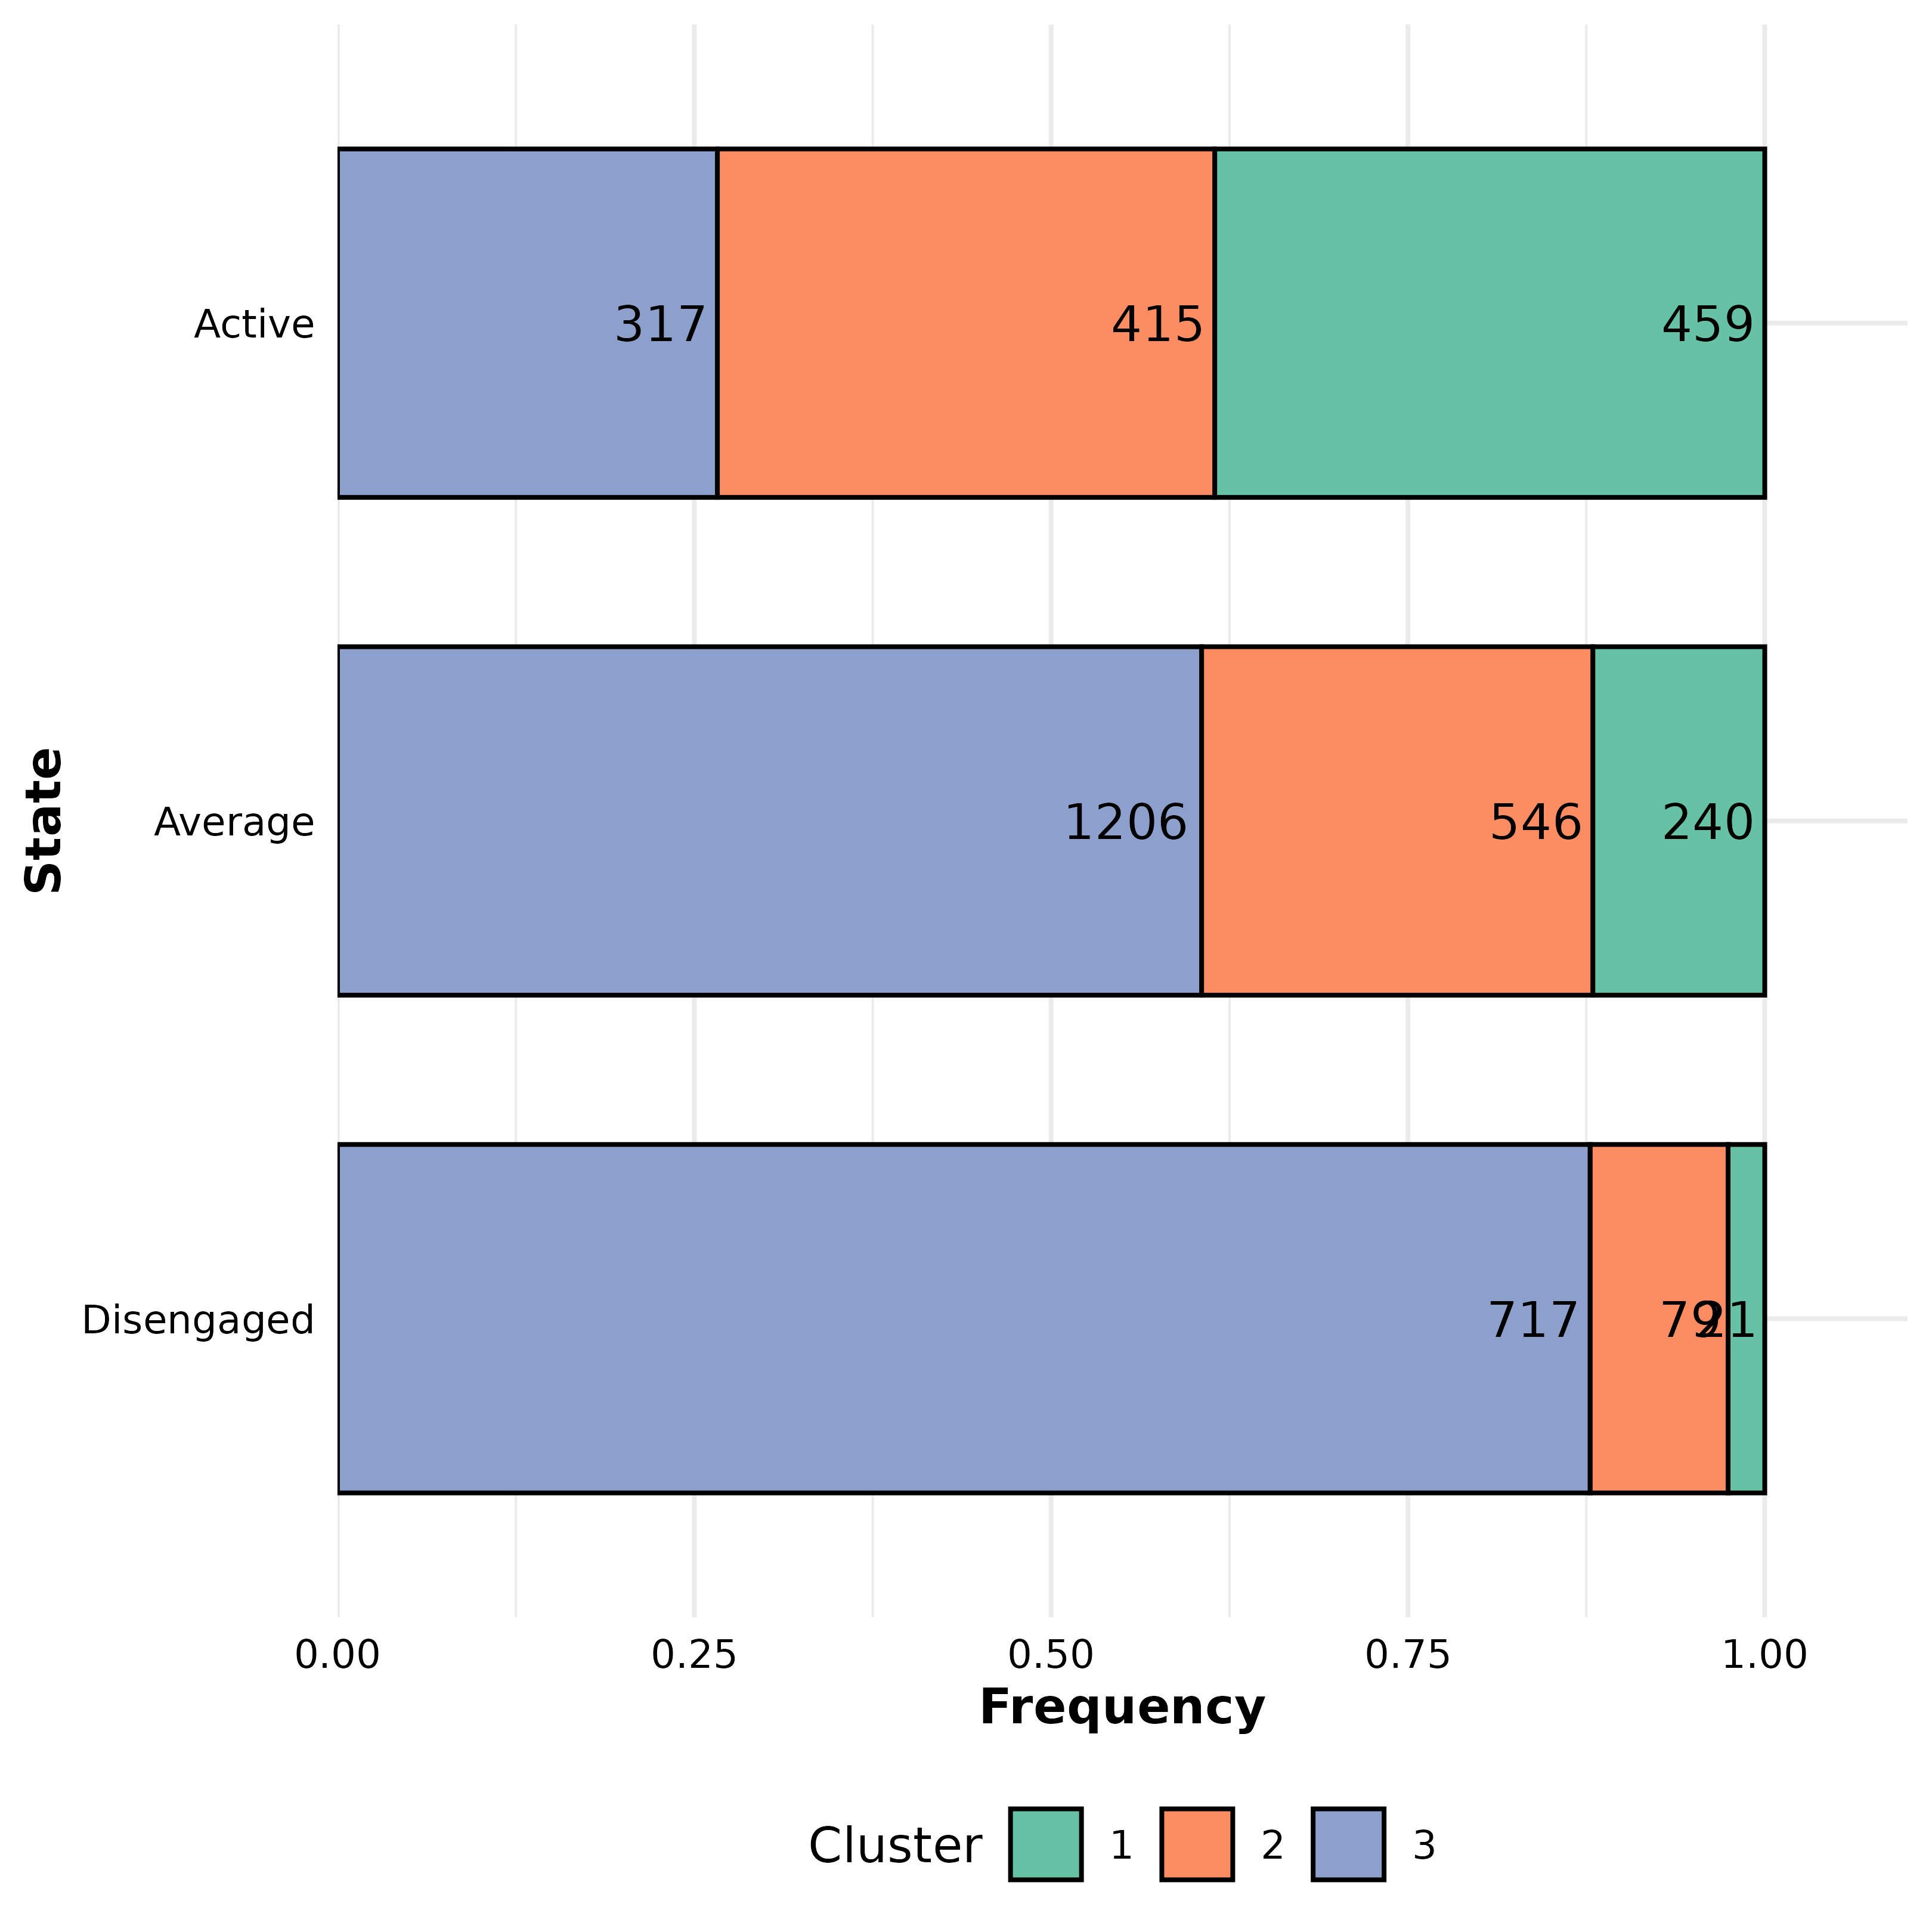
 # Fill
plot_frequencies(model, position = "fill", hjust = 1.1)
# Fill
plot_frequencies(model, position = "fill", hjust = 1.1)