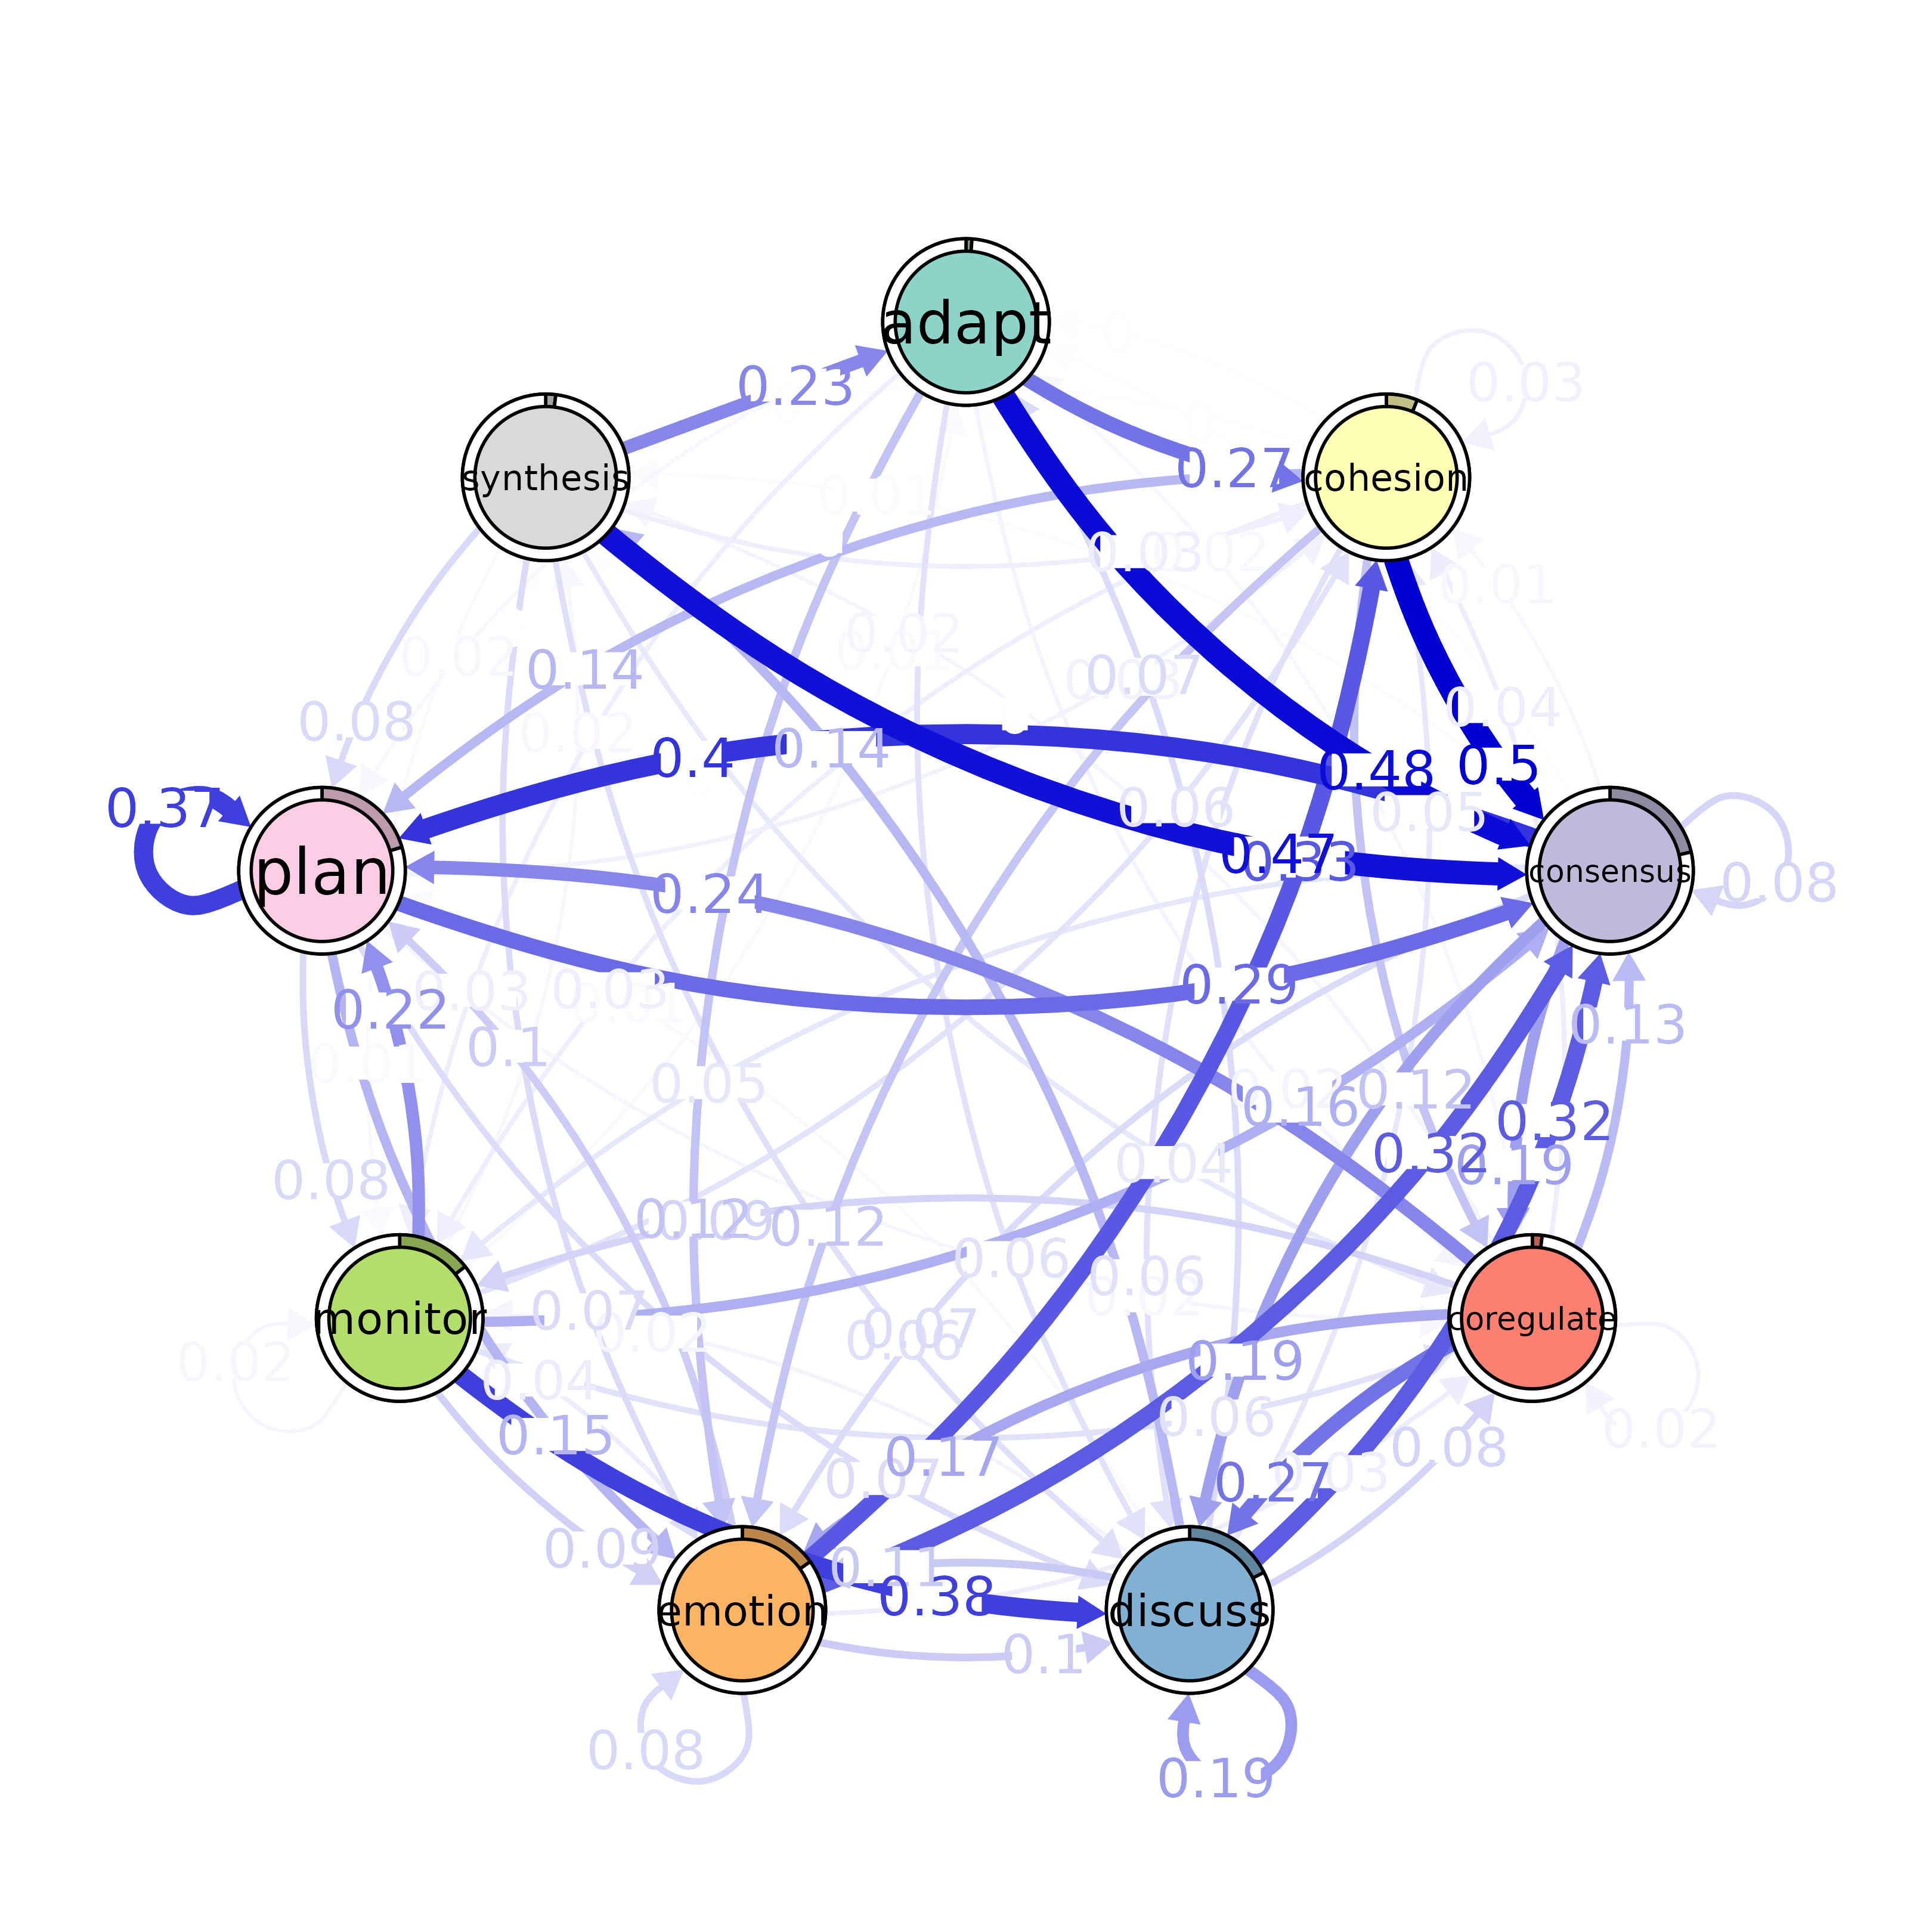
This function plots a transition network analysis (TNA) model using
the cograph package. The nodes in the graph represent states, with node
sizes corresponding to initial state probabilities. Edge labels represent
the edge weights of the network. See cograph::splot() for details on
how to further configure the plot.
Usage
# S3 method for class 'tna'
plot(
  x,
  node_list,
  use_list_order = TRUE,
  scale_nodes,
  scaling_factor = 0.5,
  ...
)
Arguments
- x
A
tnaobject frombuild_model().- node_list
An optional
listof twocharactervectors that define two mutually exclusive groups of node labels.- use_list_order
A
logicalvalue. Ifnode_listis provided, defines how the order of the nodes in the plot is defined. ATRUEvalue uses the order innode_list. Otherwise, the nodes are ranked based on edge weights and ordered according to the rank.- scale_nodes
A
characterstring giving the name of a centrality measure to scale the node size by. Seecentralities()for valid names. If missing (the default), uses defaultcograph::splot()scaling. The value ofnode_sizeprovided via...is used as baseline size.- scaling_factor
A
numericvalue specifying how strongly to scale the nodes whenscale_nodesis provided. Values between 0 and 1 will result in smaller differences and values larger than 1 will result in greater differences. The default is0.5.- ...
Additional arguments passed to
cograph::splot()orcograph::plot_htna().
See also
Basic functions
build_model(),
hist.group_tna(),
hist.tna(),
plot.group_tna(),
plot_frequencies(),
plot_frequencies.group_tna(),
plot_mosaic(),
plot_mosaic.group_tna(),
plot_mosaic.tna_data(),
print.group_tna(),
print.summary.group_tna(),
print.summary.tna(),
print.tna(),
summary.group_tna(),
summary.tna(),
tna-package