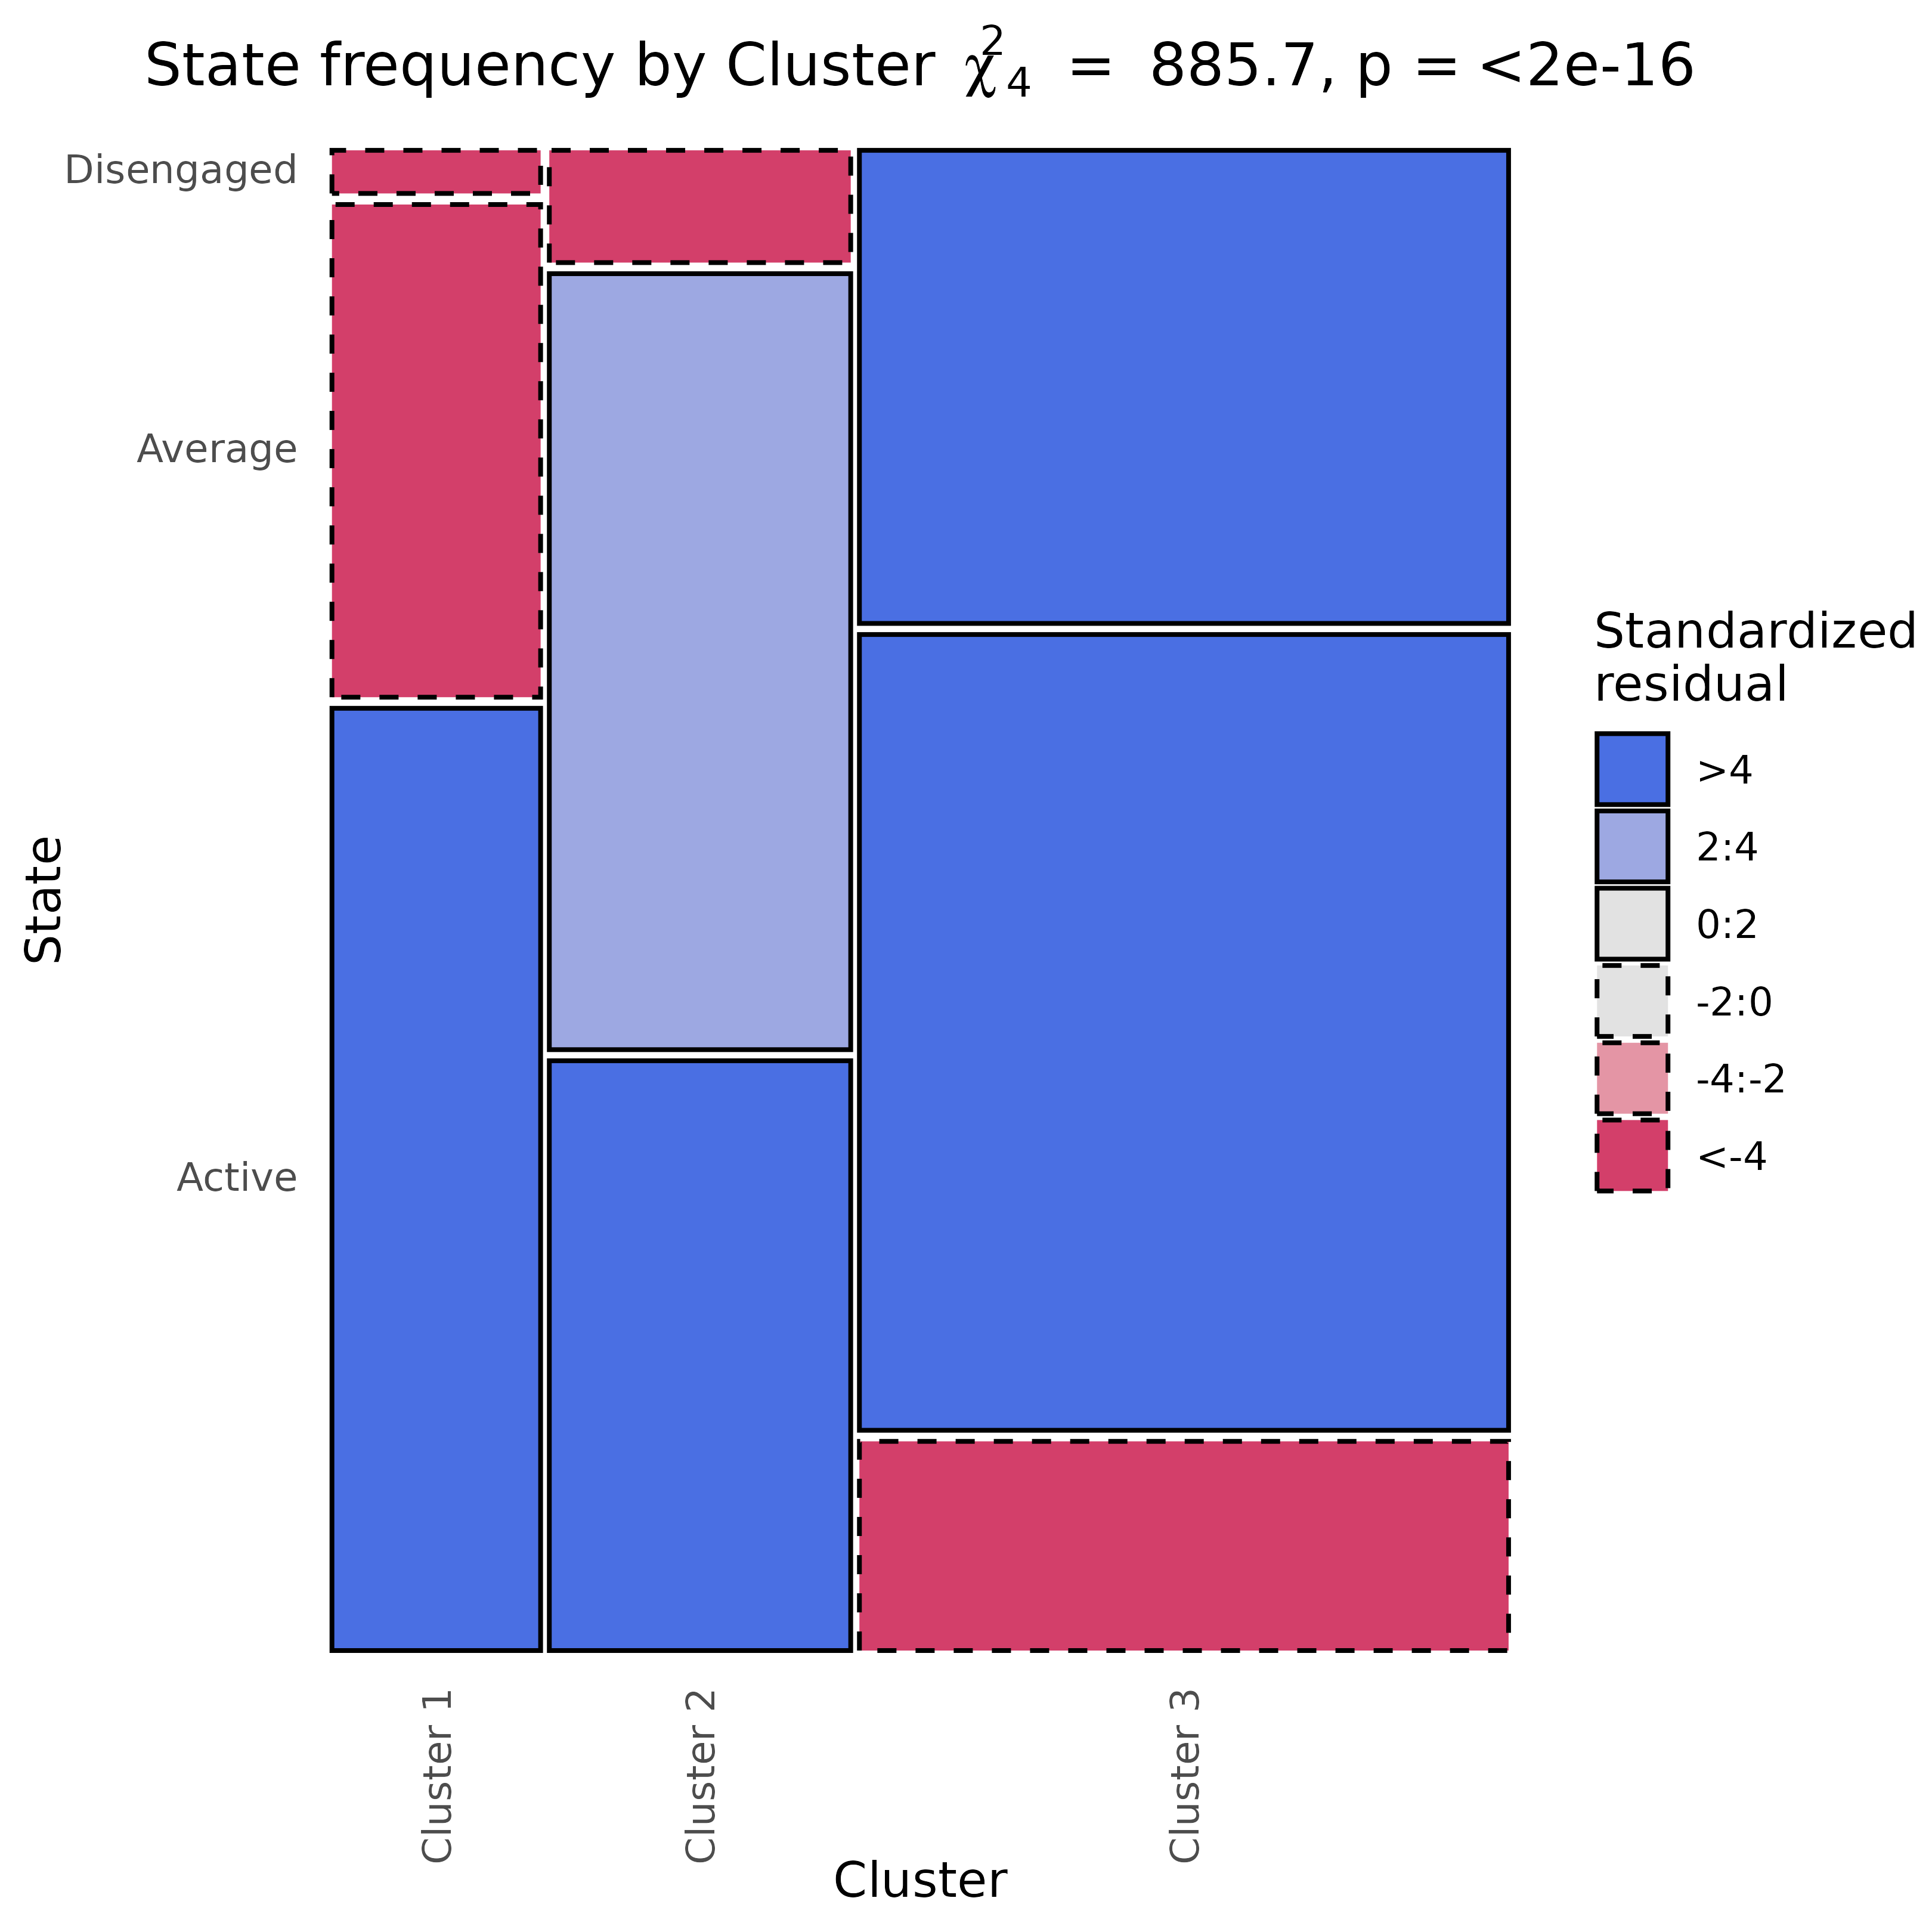
Plot State Frequencies as a Mosaic Between Two Groups
Usage
# S3 method for class 'group_tna'
plot_mosaic(x, label, ...)See also
Basic functions
build_model(),
hist.group_tna(),
hist.tna(),
plot.group_tna(),
plot.tna(),
plot_frequencies(),
plot_frequencies.group_tna(),
plot_mosaic(),
plot_mosaic.tna_data(),
print.group_tna(),
print.summary.group_tna(),
print.summary.tna(),
print.tna(),
summary.group_tna(),
summary.tna(),
tna-package
Examples
model <- group_model(engagement, group = rep(1:3, length.out = 1000))
plot_mosaic(model)