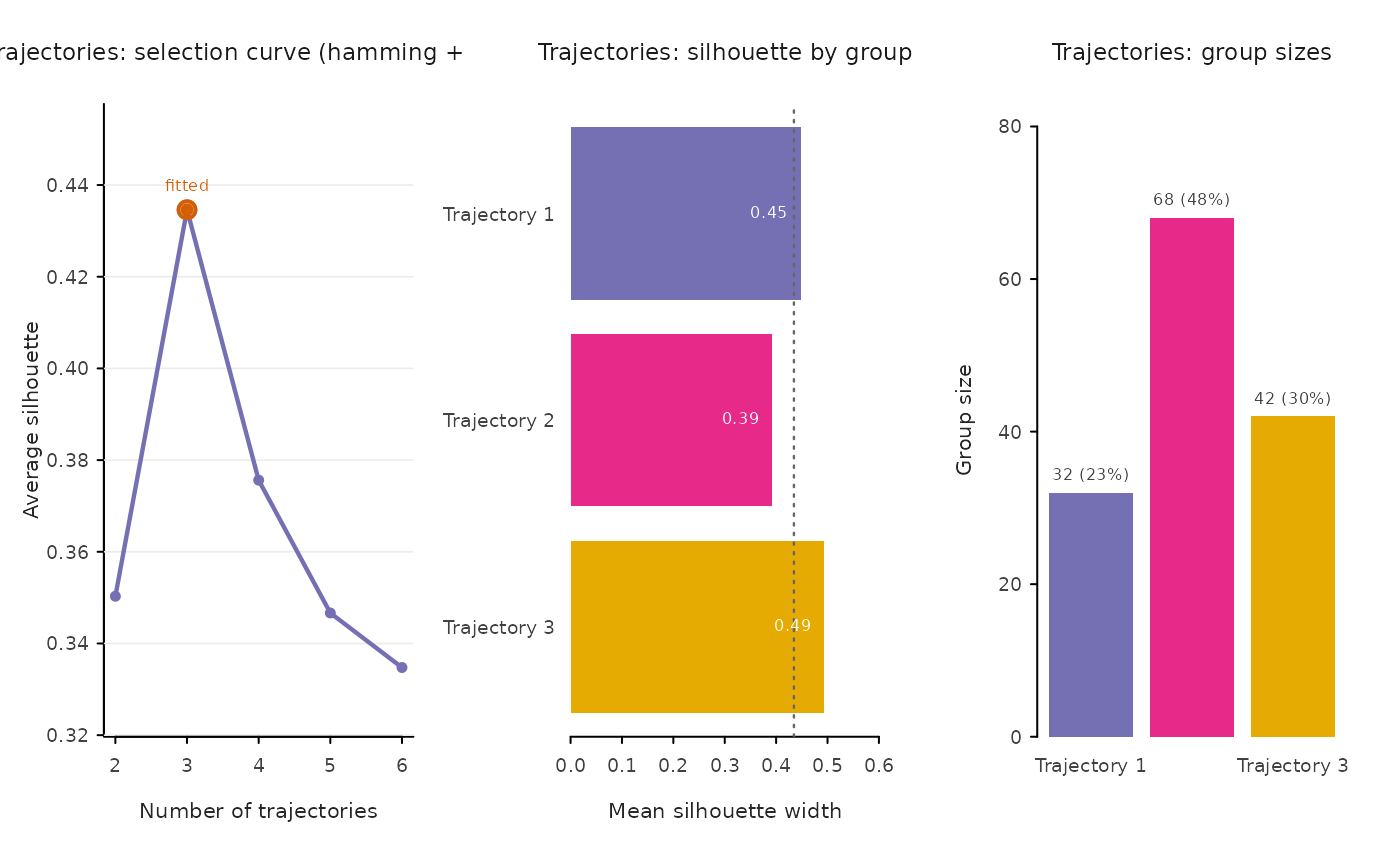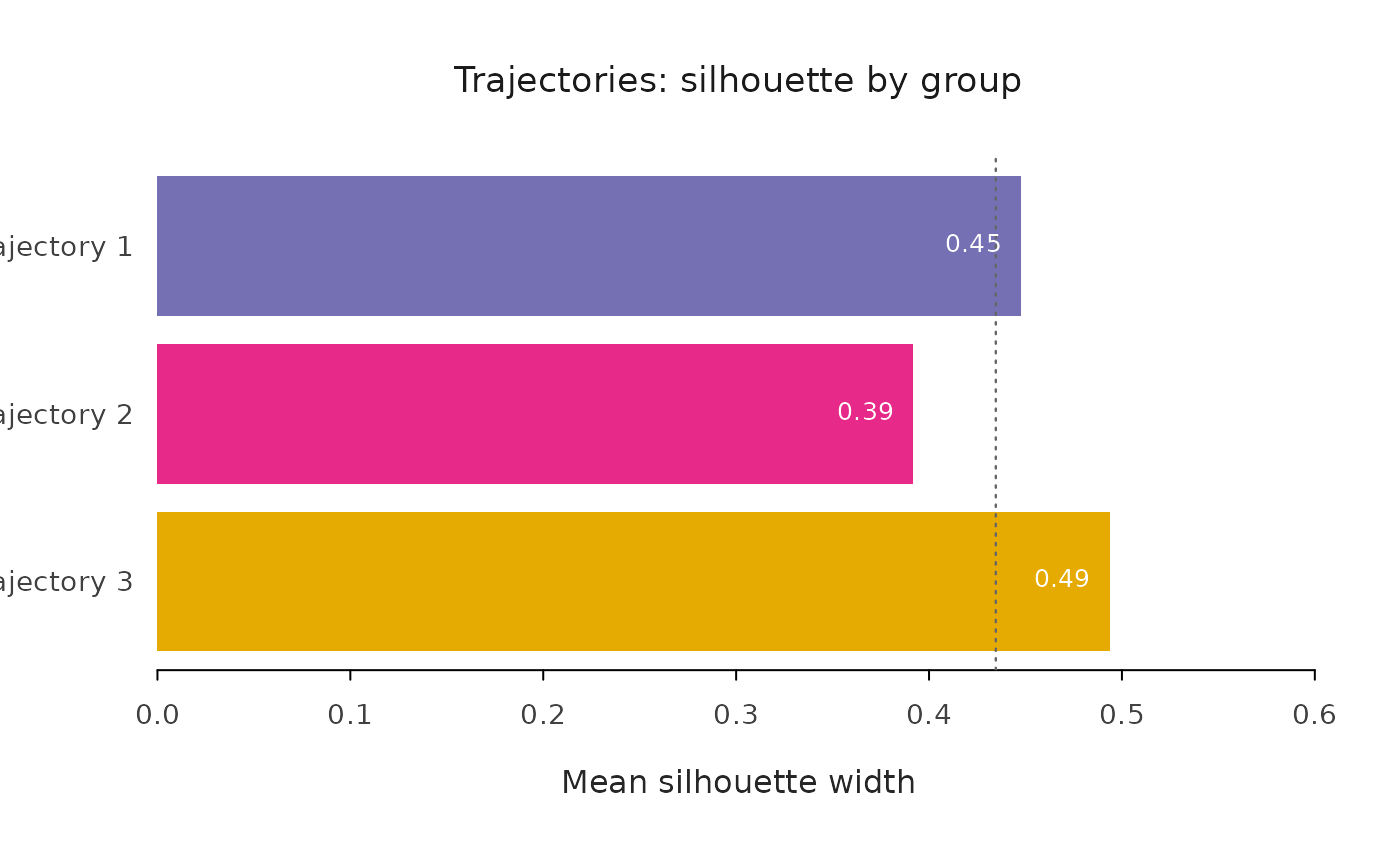
Draws the selection curve, per-cluster silhouette widths, and cluster
sizes for one evaluate() result. The default "summary" layout places
the three panels side by side.
Arguments
- x
A
vasstra_evaluationobject fromevaluate().- type
One of
"summary"(default),"curve","silhouette", or"sizes".- colors
Optional colors, one per fitted cluster. The selection curve uses the first color.
- main
Optional plot title. A panel-specific title is used by default.
- ...
Additional graphical arguments passed to the panel functions.