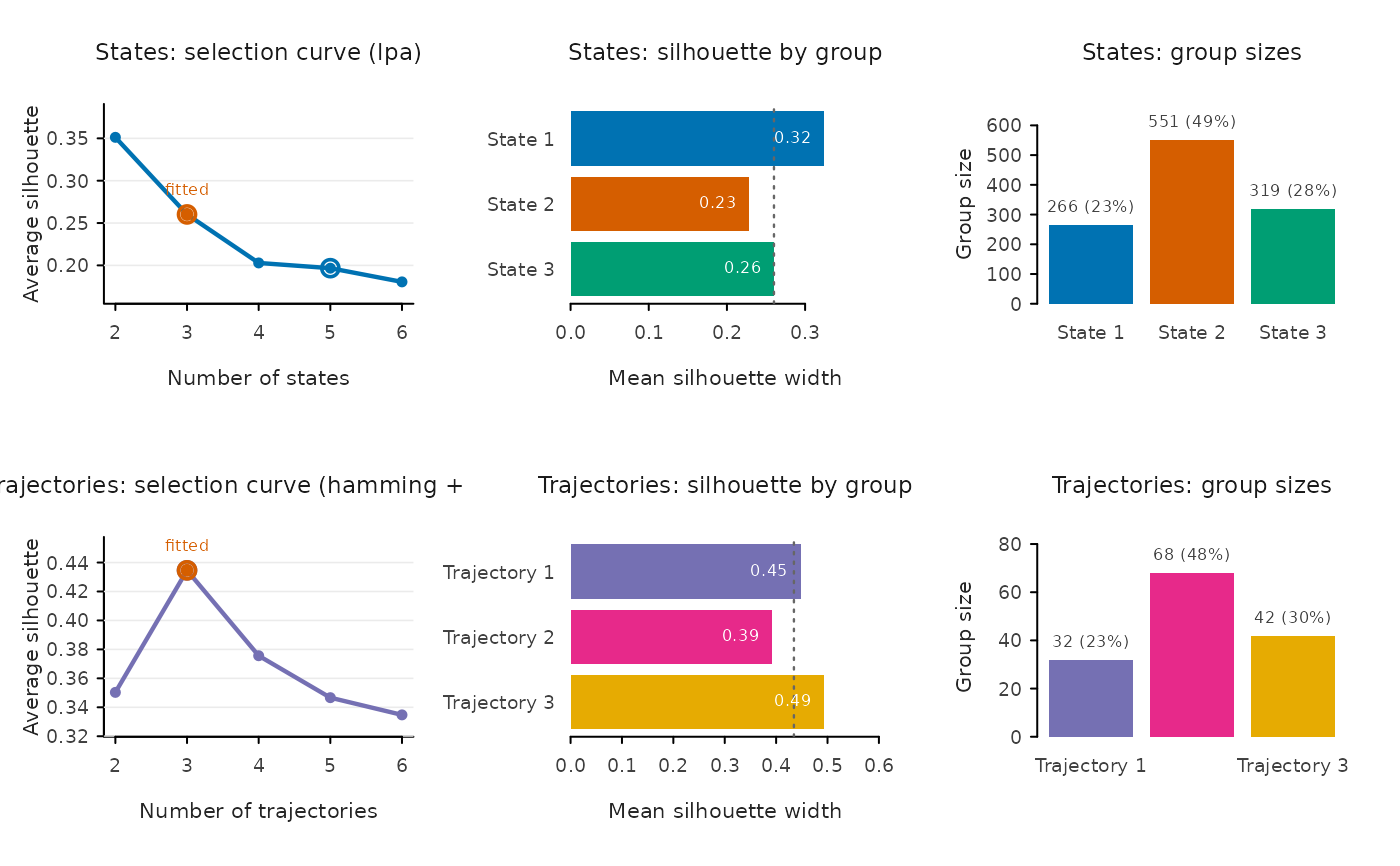
Draws one row of evaluation panels per clustering step: the state clustering on top and the trajectory clustering below.
Usage
# S3 method for class 'vasstra_evaluations'
plot(x, colors = NULL, ...)
Arguments
- x
A
vasstra_evaluationsobject fromevaluate()on a completevasstrafit.- colors
Optional colors recycled within each evaluation row. By default the state row reuses the palette pinned on the fit (
state_colors), so it matches every other state plot, while the trajectory row keeps a distinct palette so the two groupings are not read as corresponding.- ...
Additional graphical arguments passed to the panel functions.