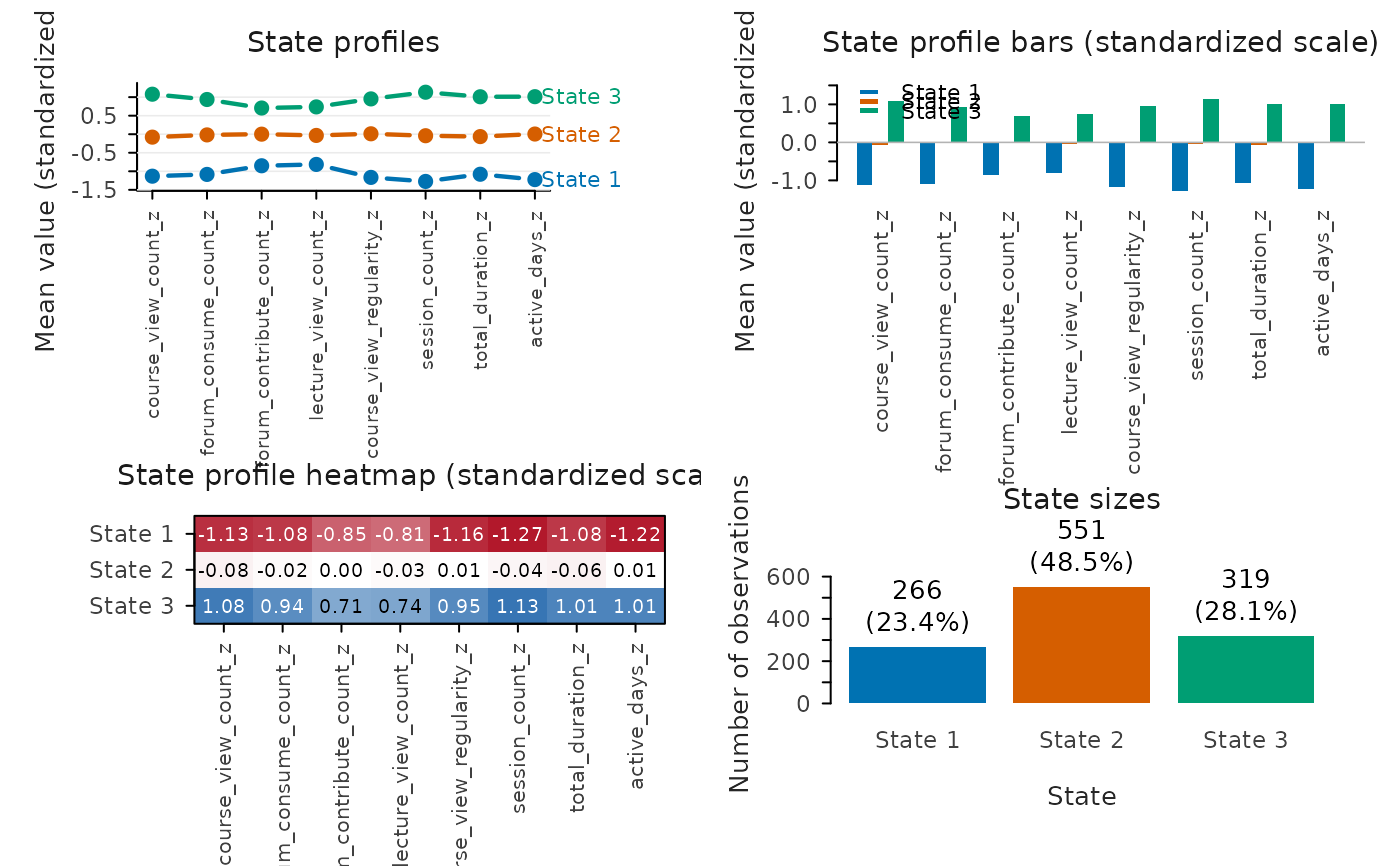
Plot Estimated VaSSTra States
Arguments
- x
A
vasstra_statesobject.- colors
Optional colors, one per state. Used by profile, bar, and size plots; heatmaps use a value-based sequential or diverging palette.
- main
Optional plot title. A type-specific title is used by default.
- ...
Additional graphical arguments passed to
graphics::matplot(),graphics::image(),graphics::barplot(), orgraphics::boxplot().- type
One of
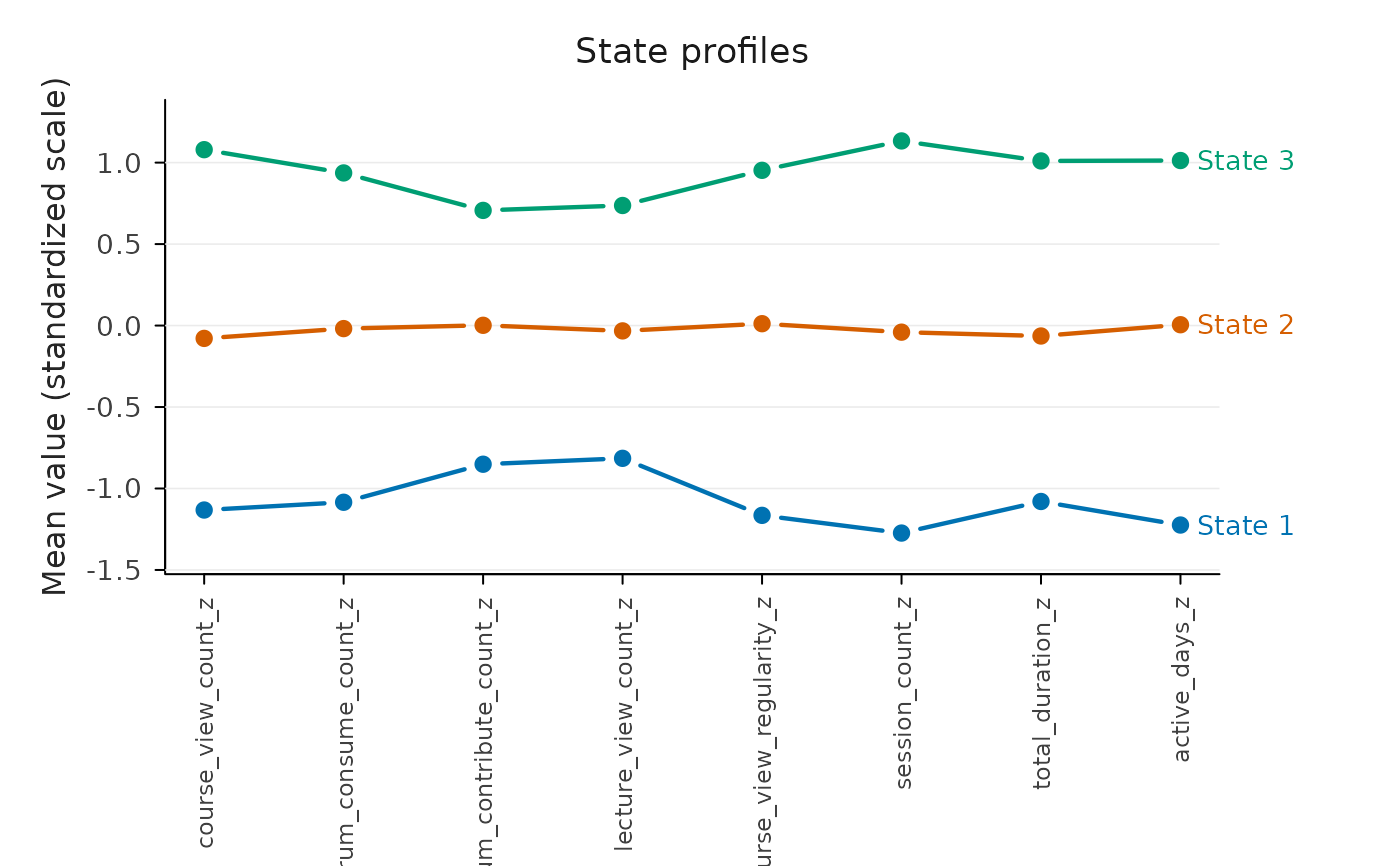
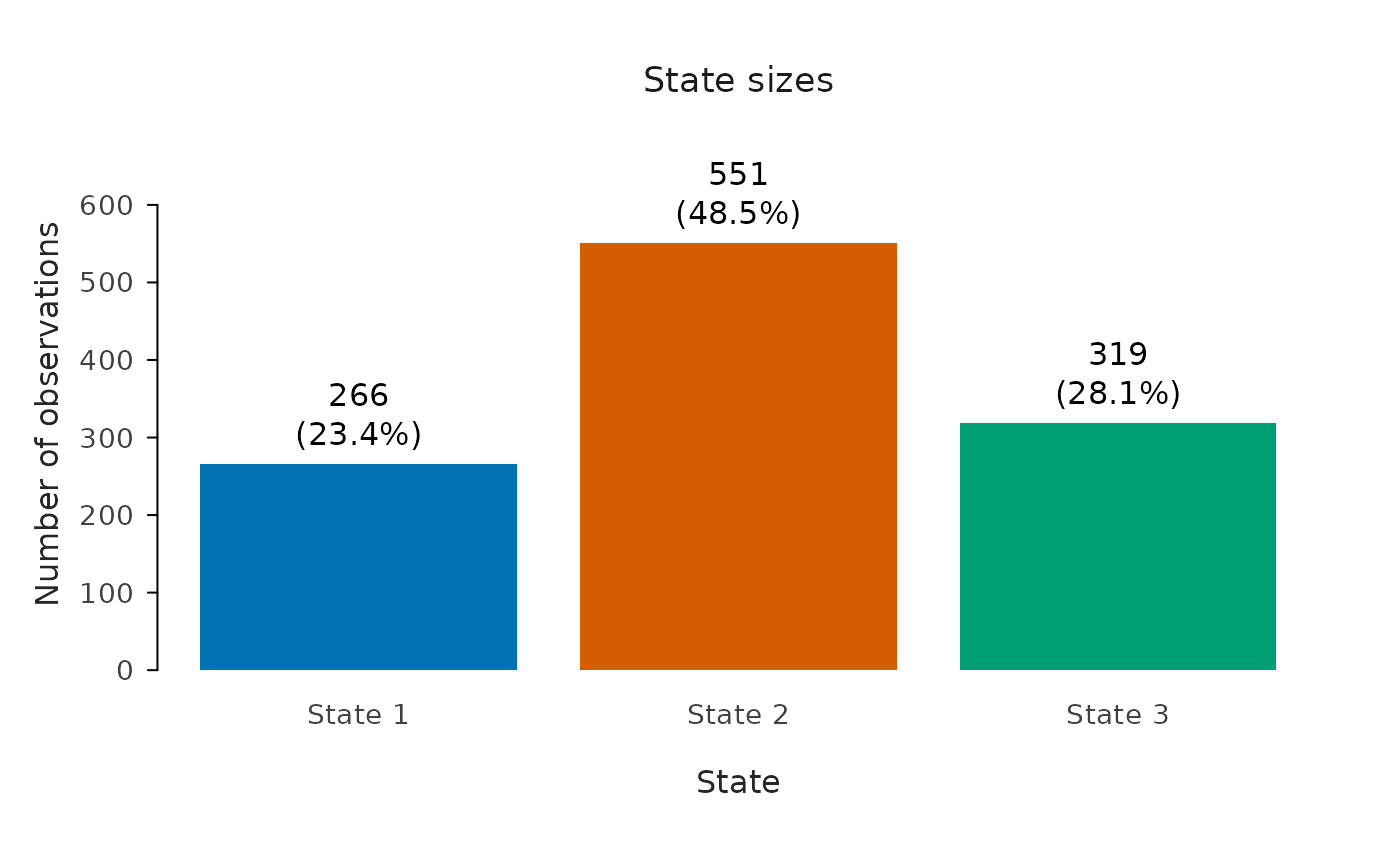
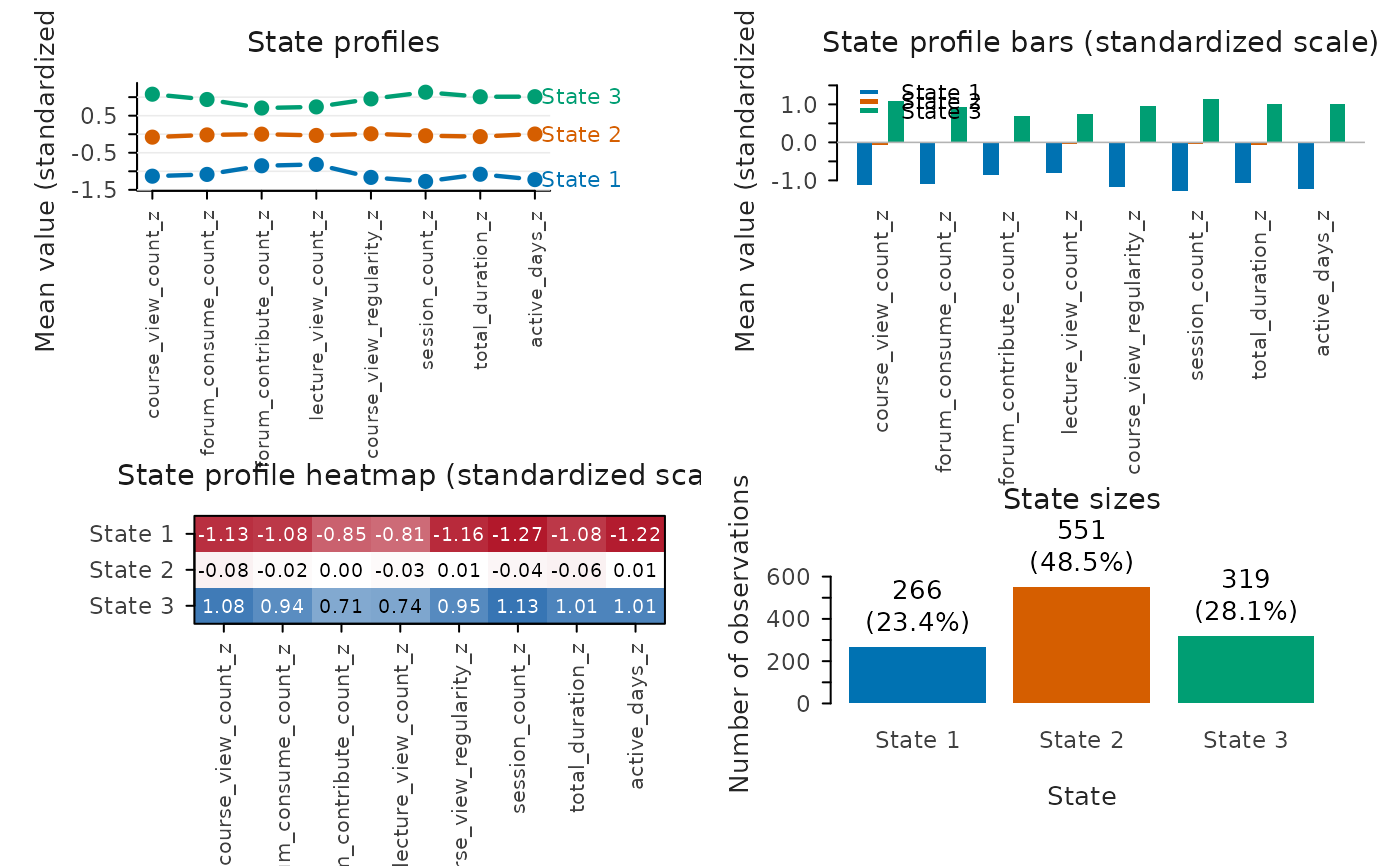
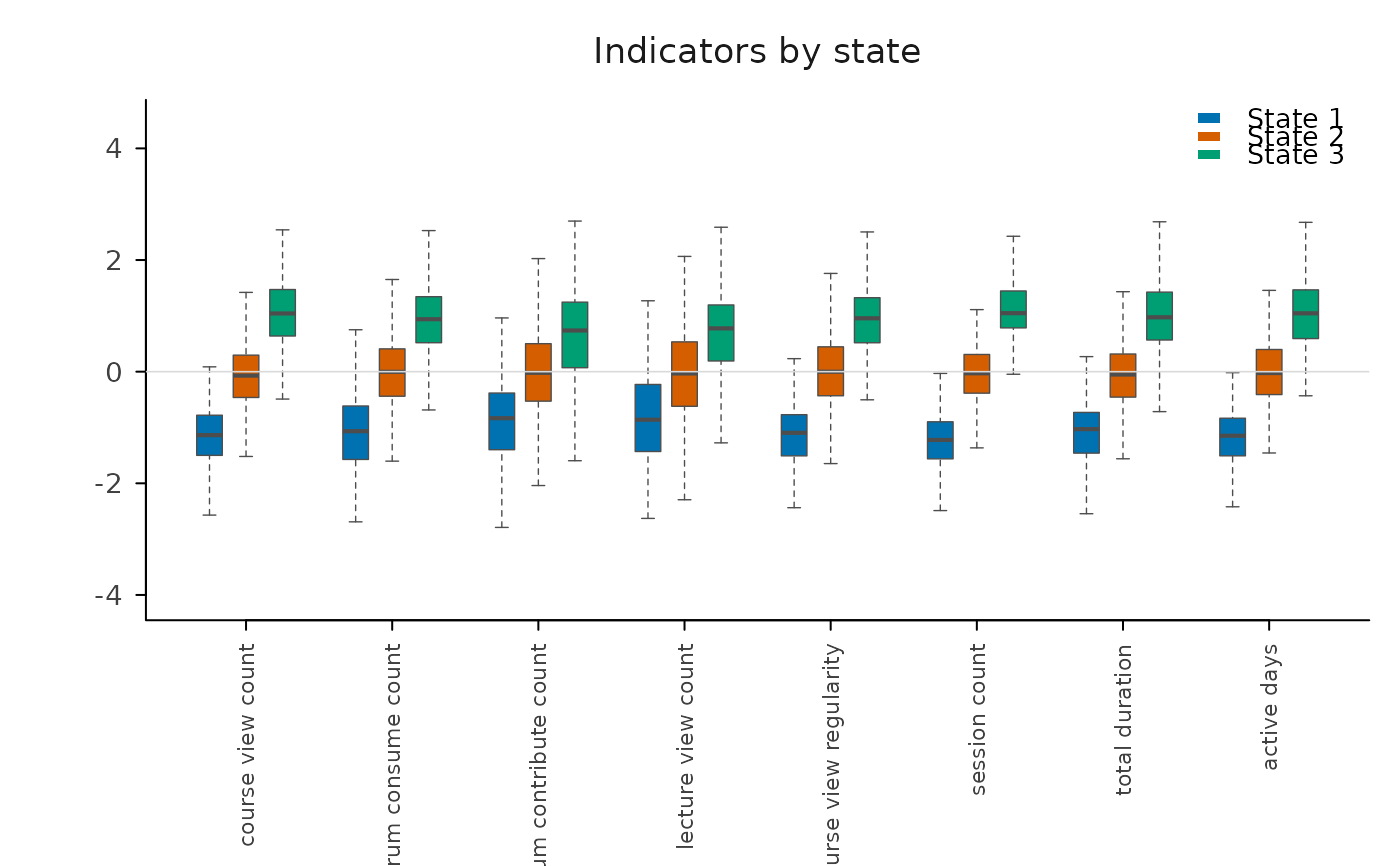
"profile"(default),"heatmap","bars","sizes","variables", or"all"for a two-by-two overview of the first four."variables"draws grouped boxplots of the clustering indicators, one panel per time point and one box per state within each indicator, so it shows whether each indicator keeps separating the states at every point rather than only on average.- scale
Show state profiles on the
"standardized"(default) or"original"indicator scale. Ignored bytype = "sizes"andtype = "variables"(the latter always uses the scale the states were clustered on).- by_time
Used only by
type = "variables": draw one panel per time point (TRUE, default) or pool the time points into a single panel (FALSE).