Delegates grouped sequence index, distribution, and heatmap rendering to
Nestimate::sequence_plot() and per-trajectory transition networks to
transition_plot().
Arguments
- x
A
vasstra_trajectoriesobject.- type
One or more of
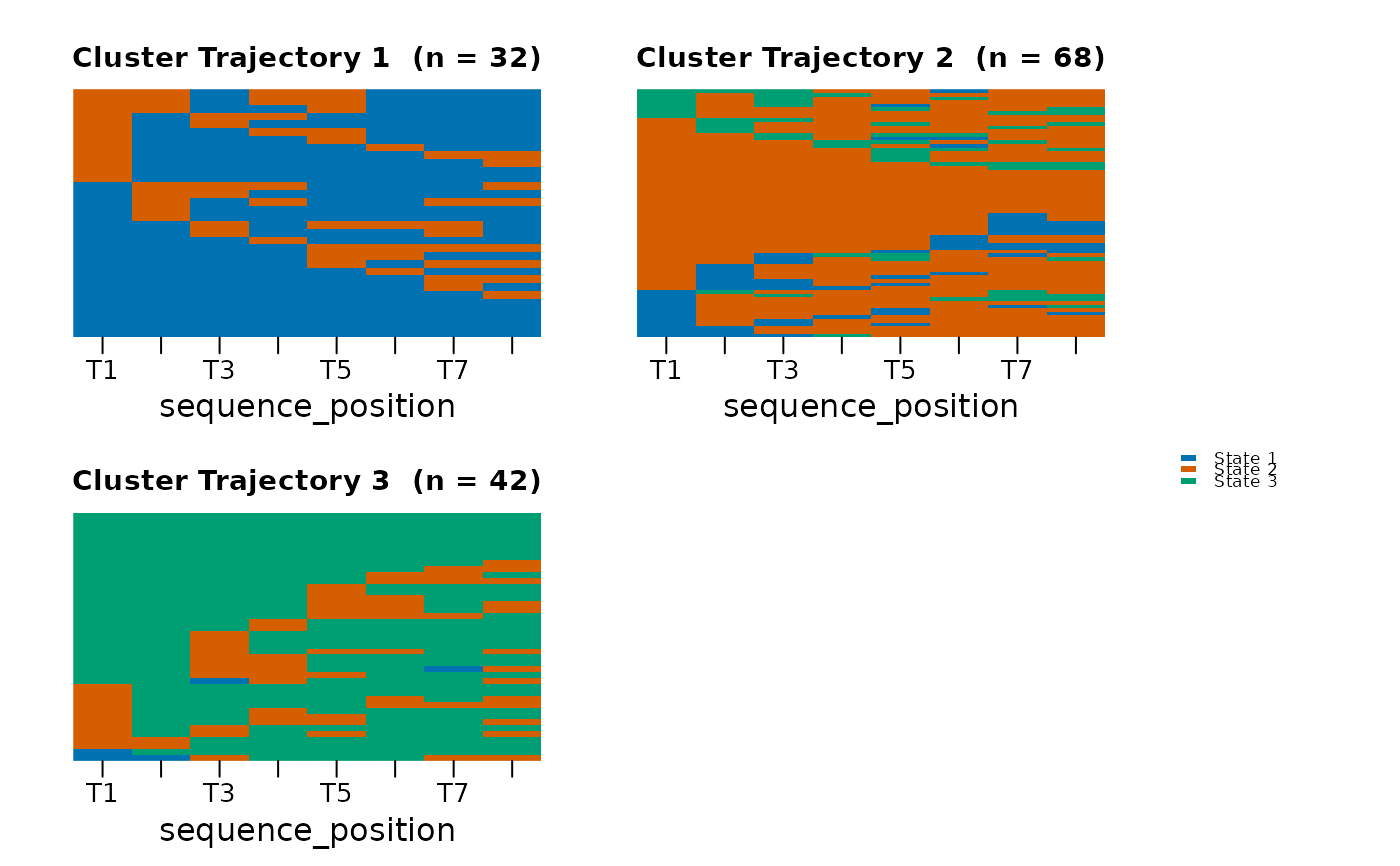
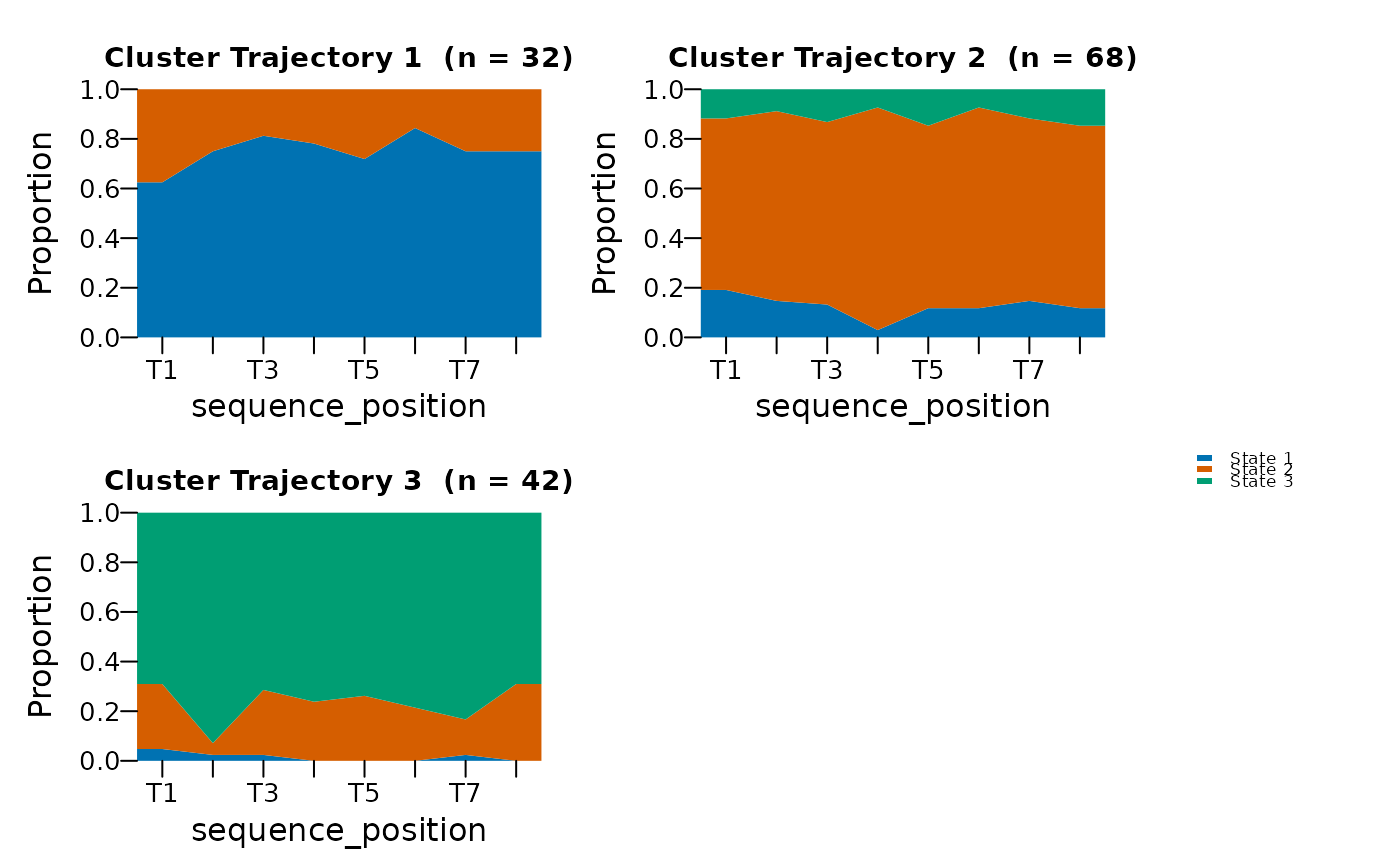
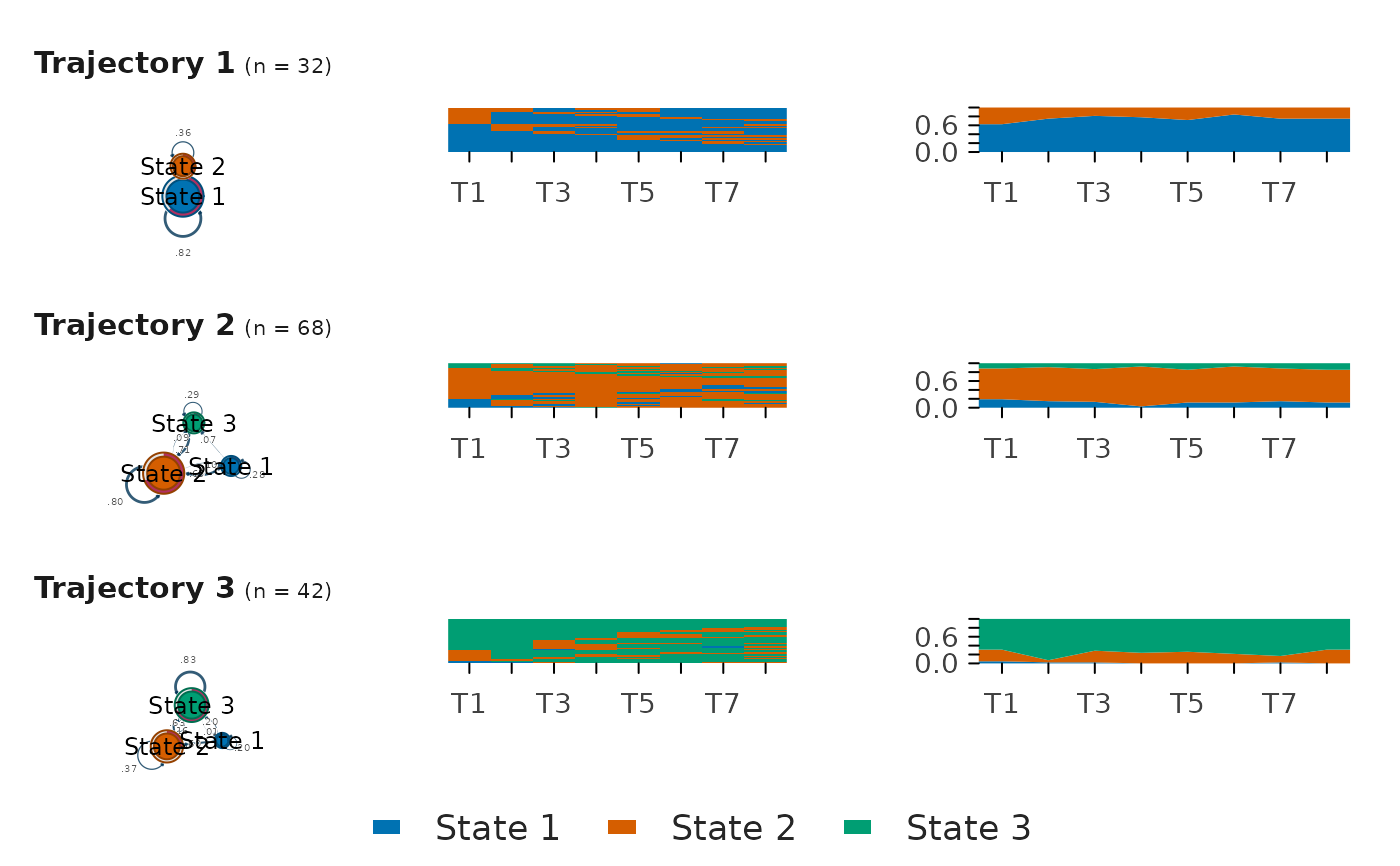
"index"(the default),"distribution","heatmap", and"transition". A character vector requests several views and switches to the per-trajectory grid described above; for exampletype = c("transition", "index", "distribution").- colors
Optional colors, one per state, passed to Nestimate as
state_colorsand totransition_plot()as node fills.- main
Plot title for the single faceted view. Ignored by the grid, where each row is titled with its trajectory label.
- sort
Sequence ordering passed to
Nestimate::sequence_plot(). The default is"start"for robust within-trajectory index plots, including trajectories containing one sequence.- na
Show missing cells as a separate distribution band. By default, this is
TRUEonly when the sequence data containNA.- ...
Additional arguments passed to the sequence panels (
Nestimate::sequence_plot()). In the grid,legend = "none"orlegend = FALSEsuppresses the shared bottom legend.
Value
For a single view, the value returned by
Nestimate::sequence_plot(). For the grid, NULL invisibly.
Details
A single view (the default) is drawn as one faceted figure with a panel
per trajectory. Passing several views, or the "transition" network,
instead lays out a grid with one row per trajectory and one column per
requested view (in the order given), which reproduces the familiar
per-cluster VaSSTra figure of a transition network beside its sequence
index and state-distribution plots. A single shared legend is drawn along
the bottom; pass legend = "none" (or legend = FALSE) to omit it.
See also
flow_plot() for alluvial and individual flow views,
transition_plot() for a single transition network.
Examples
data("engagement", package = "VaSSTra")
fit <- vasstra(engagement, n_states = 3, n_trajectories = 3)
plot(fit$trajectories)
 plot(fit$trajectories, type = "distribution")
 # \donttest{
if (requireNamespace("cograph", quietly = TRUE)) {
# One row per trajectory; columns are the requested views.
plot(fit$trajectories, type = c("transition", "index", "distribution"))
}
# \donttest{
if (requireNamespace("cograph", quietly = TRUE)) {
# One row per trajectory; columns are the requested views.
plot(fit$trajectories, type = c("transition", "index", "distribution"))
}
 # }
# }