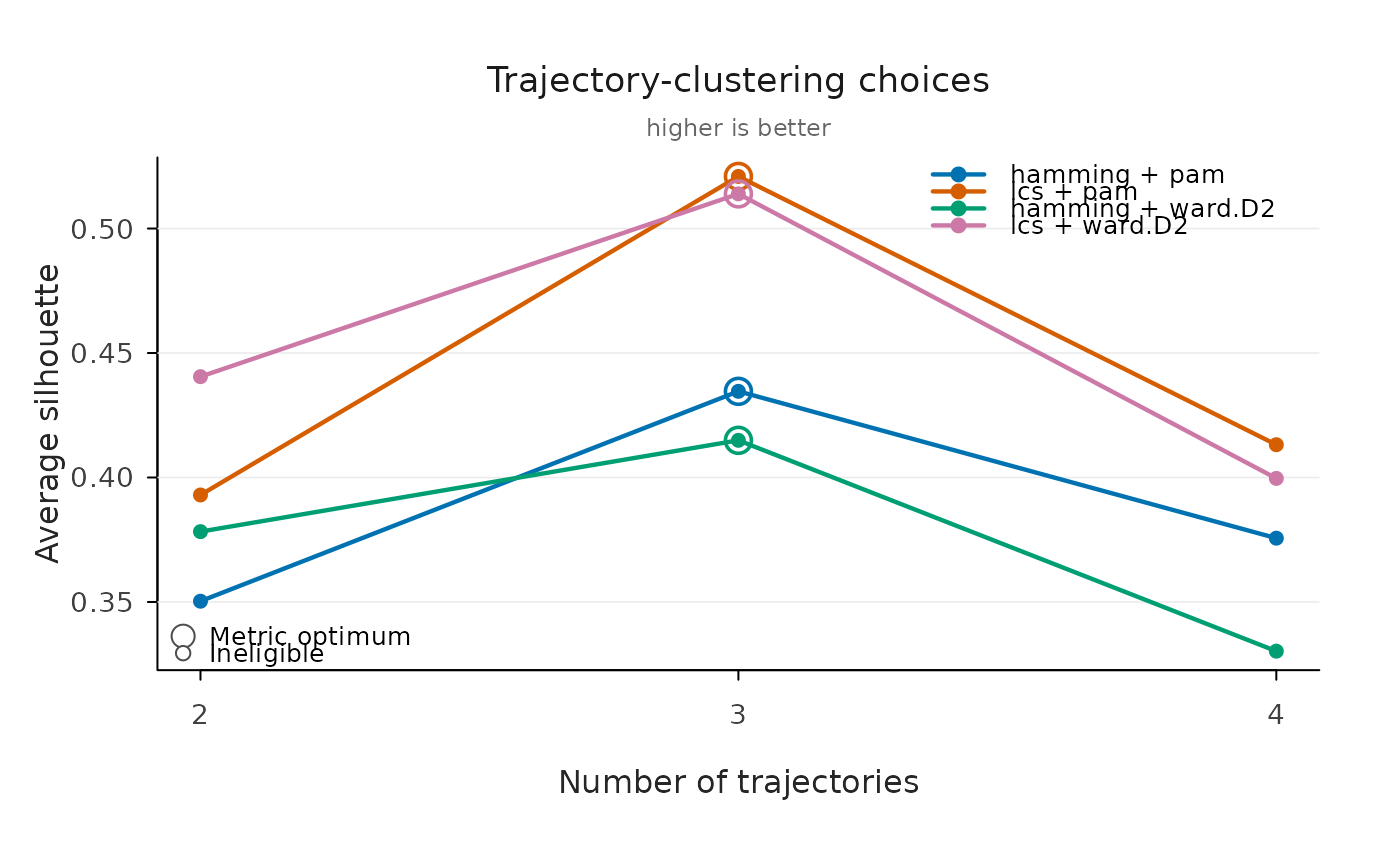
Draws a compact Nestimate model-selection plot from
trajectory_choices(). Each line is one distance-method combination.
A ring marks the optimal eligible value of the plotted metric within each
group; hollow points mark candidates that fail the requested size
constraints.
Arguments
- x
A
vasstra_trajectory_choicesobject.- metric
One of
"silhouette","mean_within_distance","min_size", or"size_ratio".- colors
Optional colors, one per displayed distance-method pair.
- main
Optional plot title.
- groups
Optional character vector of distance-method labels to display, such as
"lcs + ward.D2".- show_legend
Show the group and marker legends.
- ...
Additional arguments passed to
graphics::plot().
Examples
data("engagement", package = "VaSSTra")
sequences <- step2_sequences(step1_states(engagement, n_states = 3))
options <- trajectory_choices(sequences, n_trajectories = 2:4)
plot(options)