Overview
plot_bootstrap_forest() visualises bootstrapped edge
weights and confidence intervals for any network estimated with
bootstrap_network() or boot_glasso(). Three
layouts are available:
| Layout | Best for |
|---|---|
"linear" |
Many edges, precise comparison |
"circular" |
Medium networks, publication figures |
"grouped" |
Source-node grouping, colour by community |
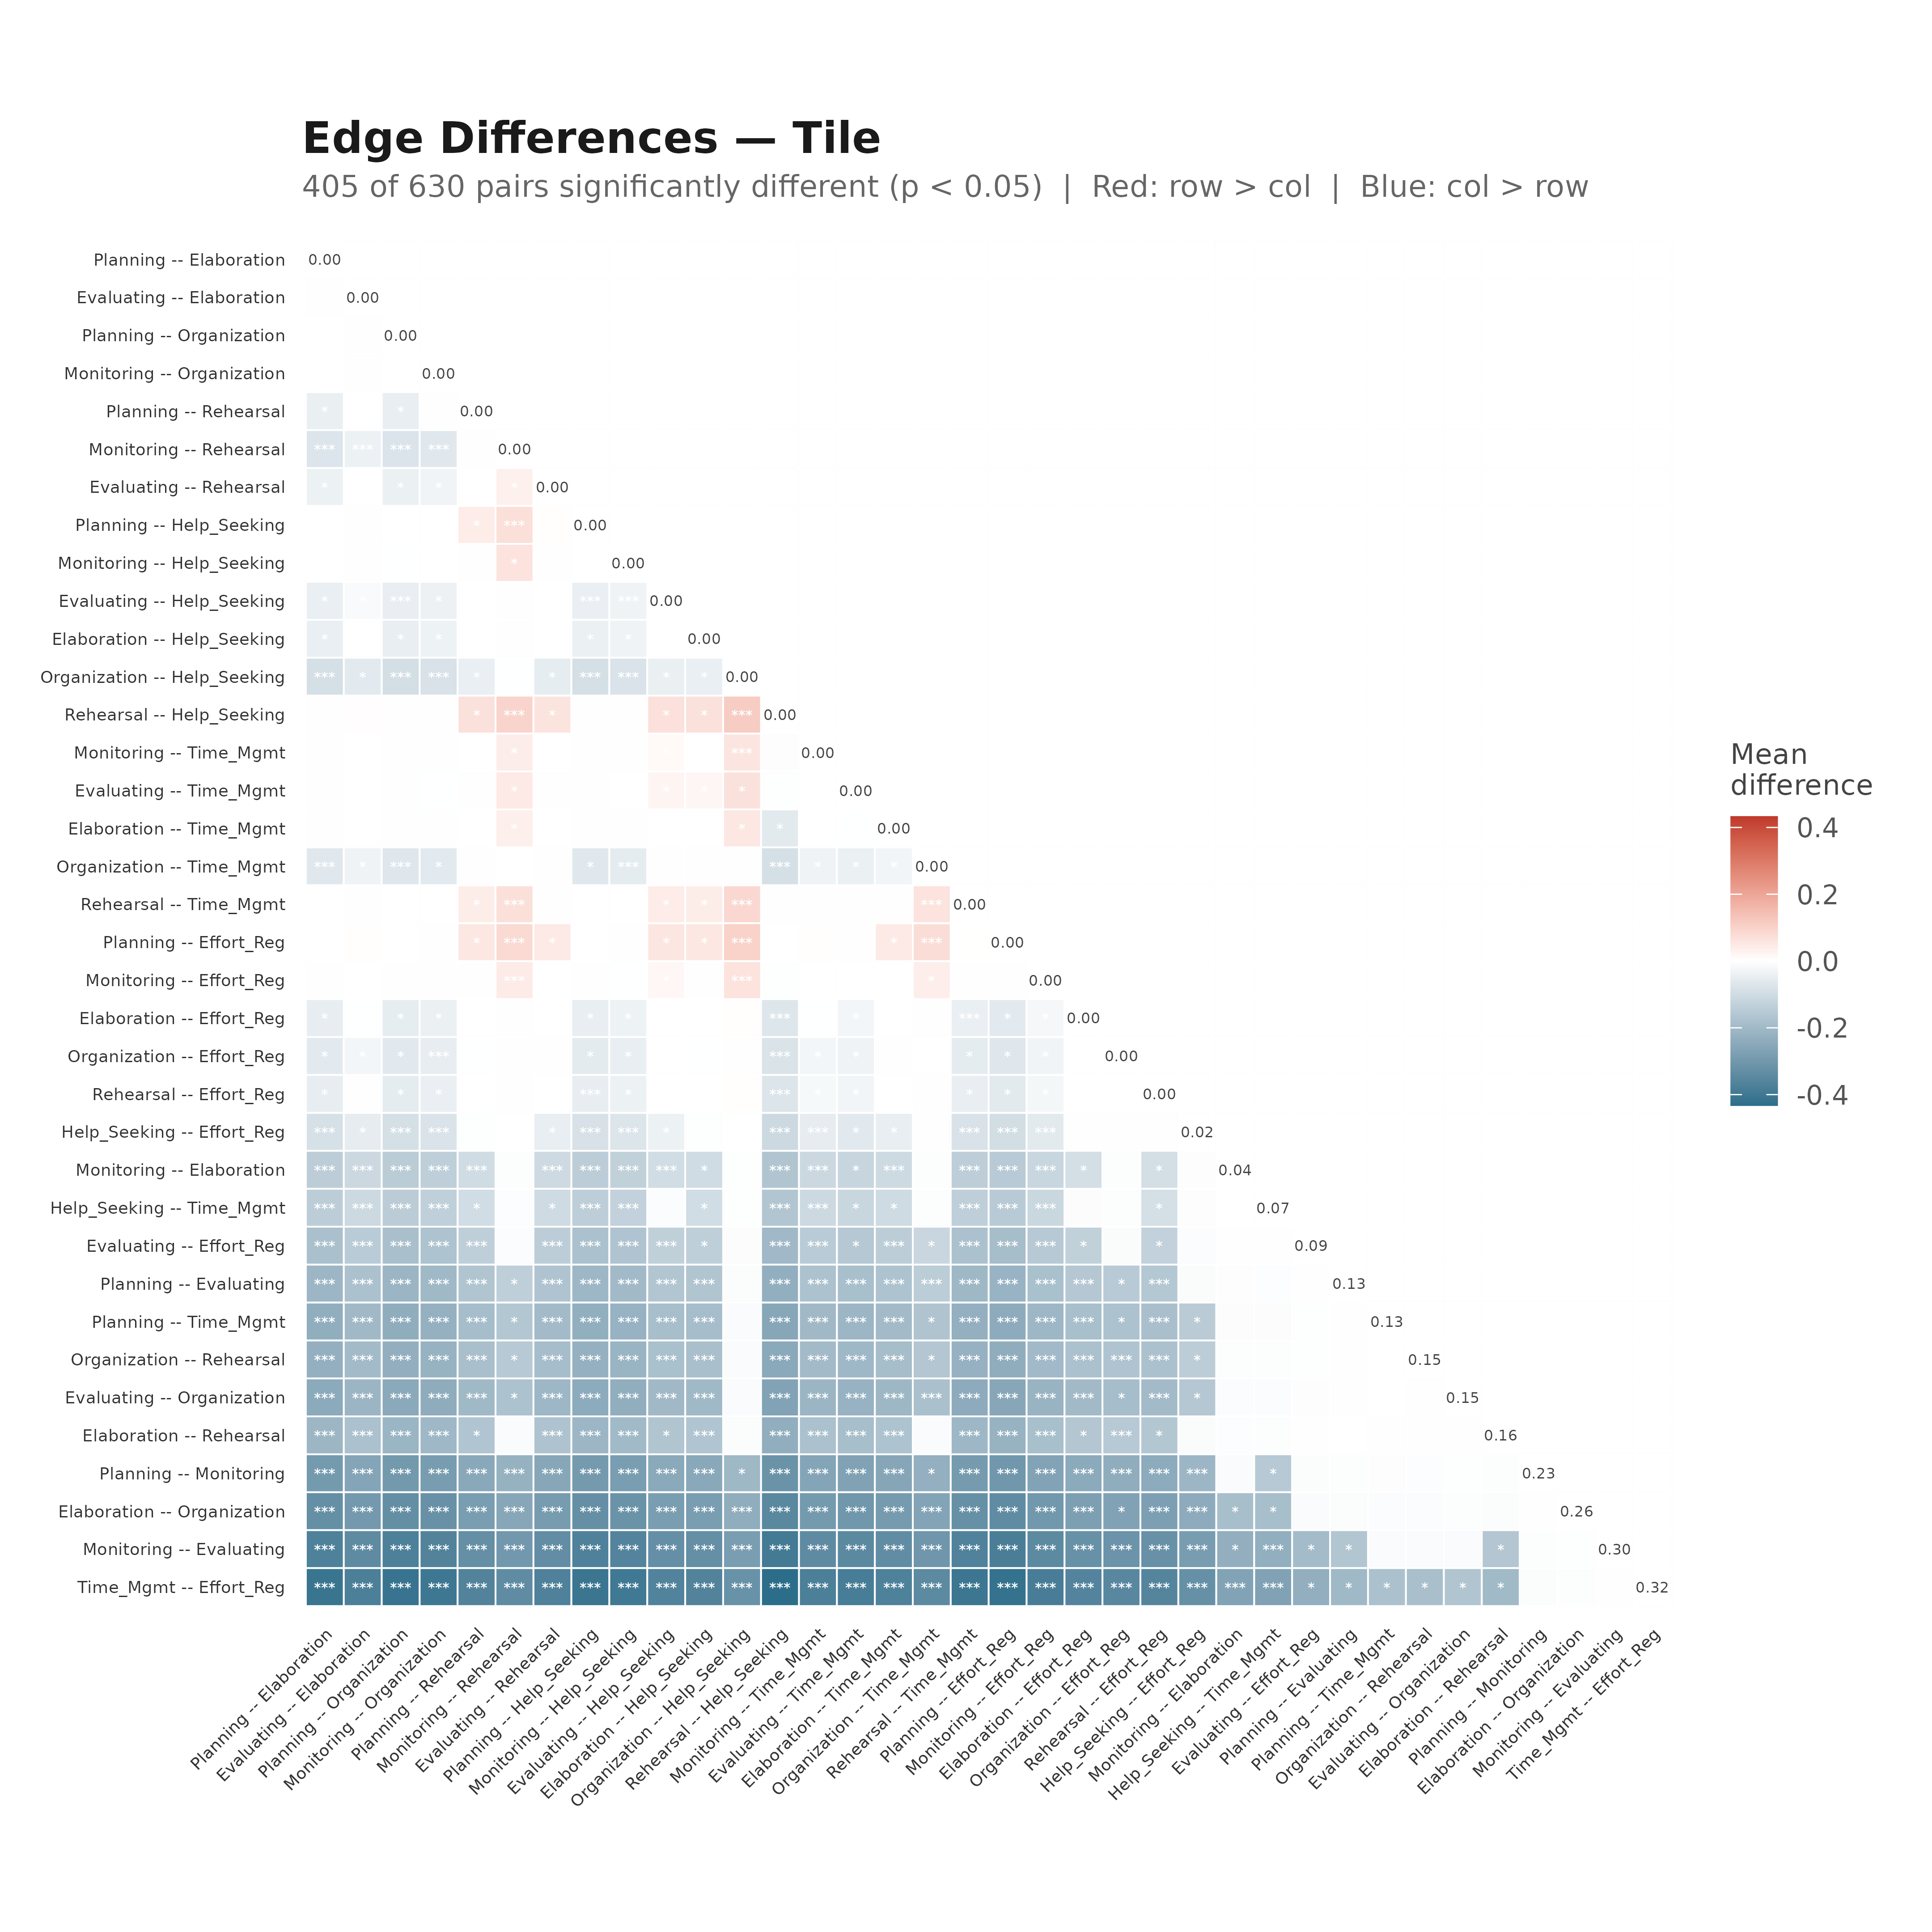
plot_edge_diff_forest() visualises pairwise edge
weight differences from a boot_glasso object. Four
layouts: "linear", "circular",
"chord", "tile".
1. TNA Network (relative transitions)
net_tna  <- build_network(human_wide, method = "relative")
boot_tna <- bootstrap_network(net_tna, iter = 200, seed = 42)
Linear
plot_bootstrap_forest(boot_tna,
  title    = "Human-AI Interaction Network",
  subtitle = "95% bootstrap CI  |  200 iterations")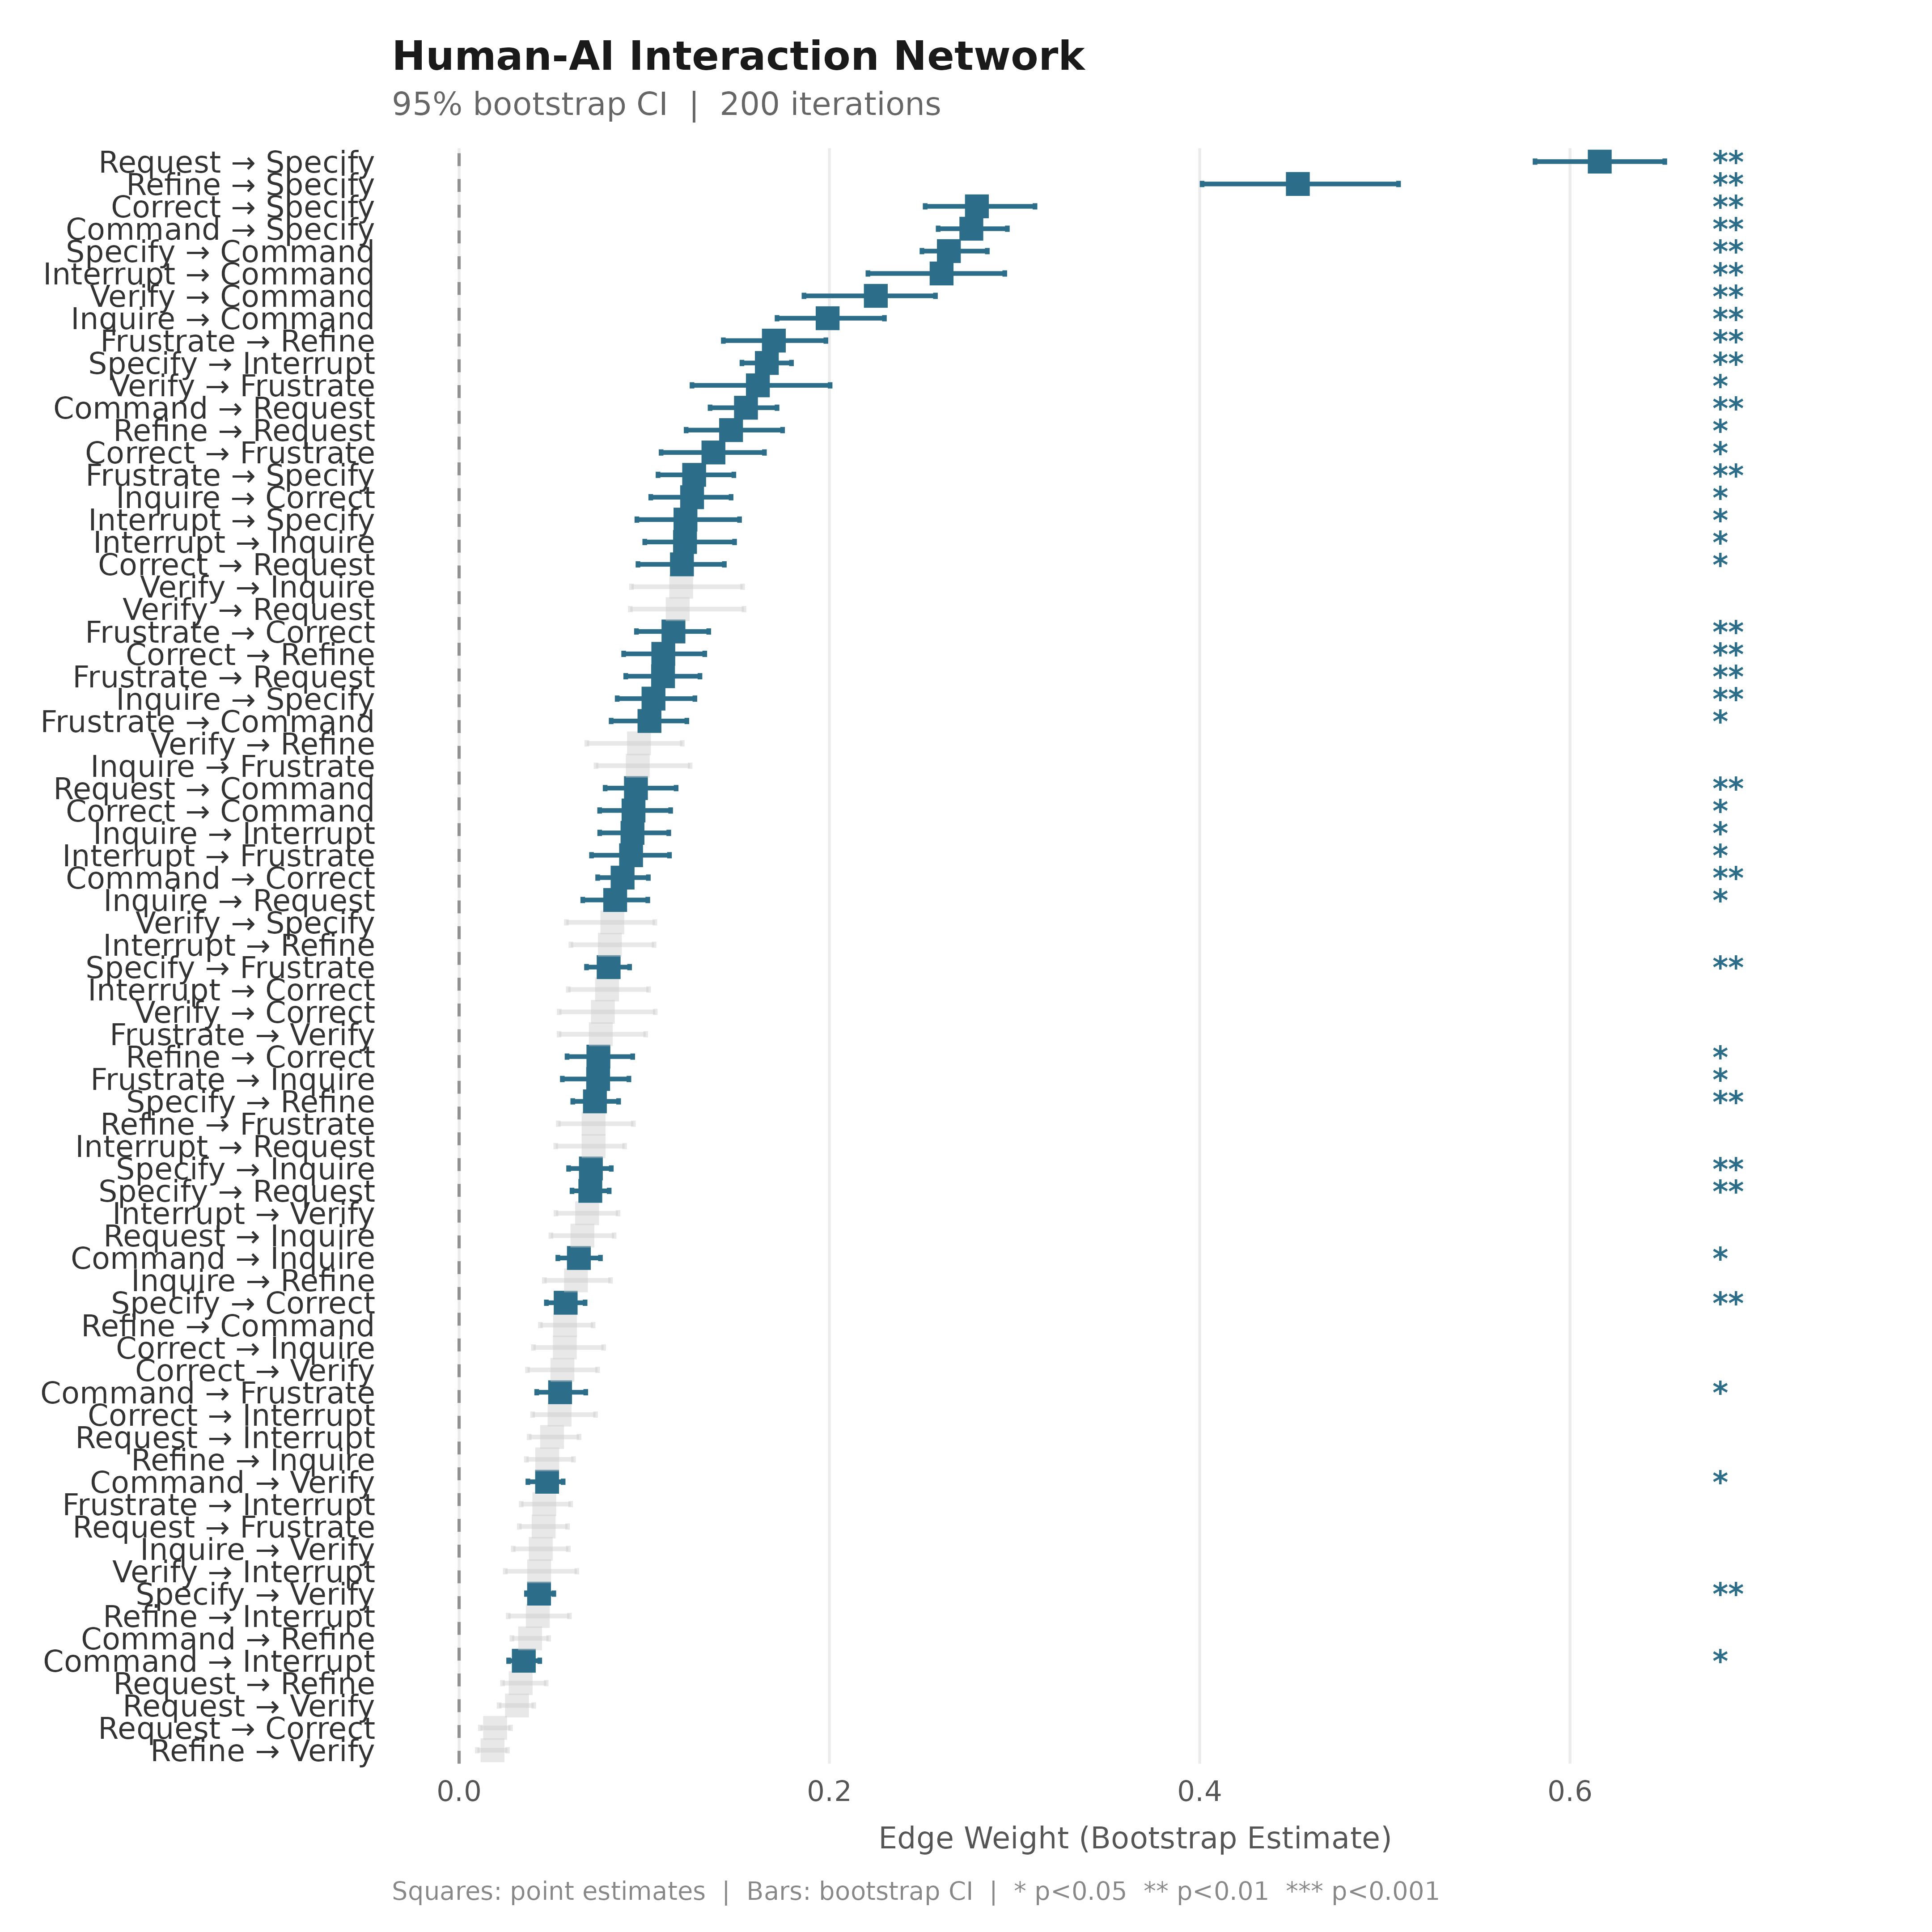
Circular
plot_bootstrap_forest(boot_tna, layout = "circular",
  title = "Human-AI Interaction Network — Circular")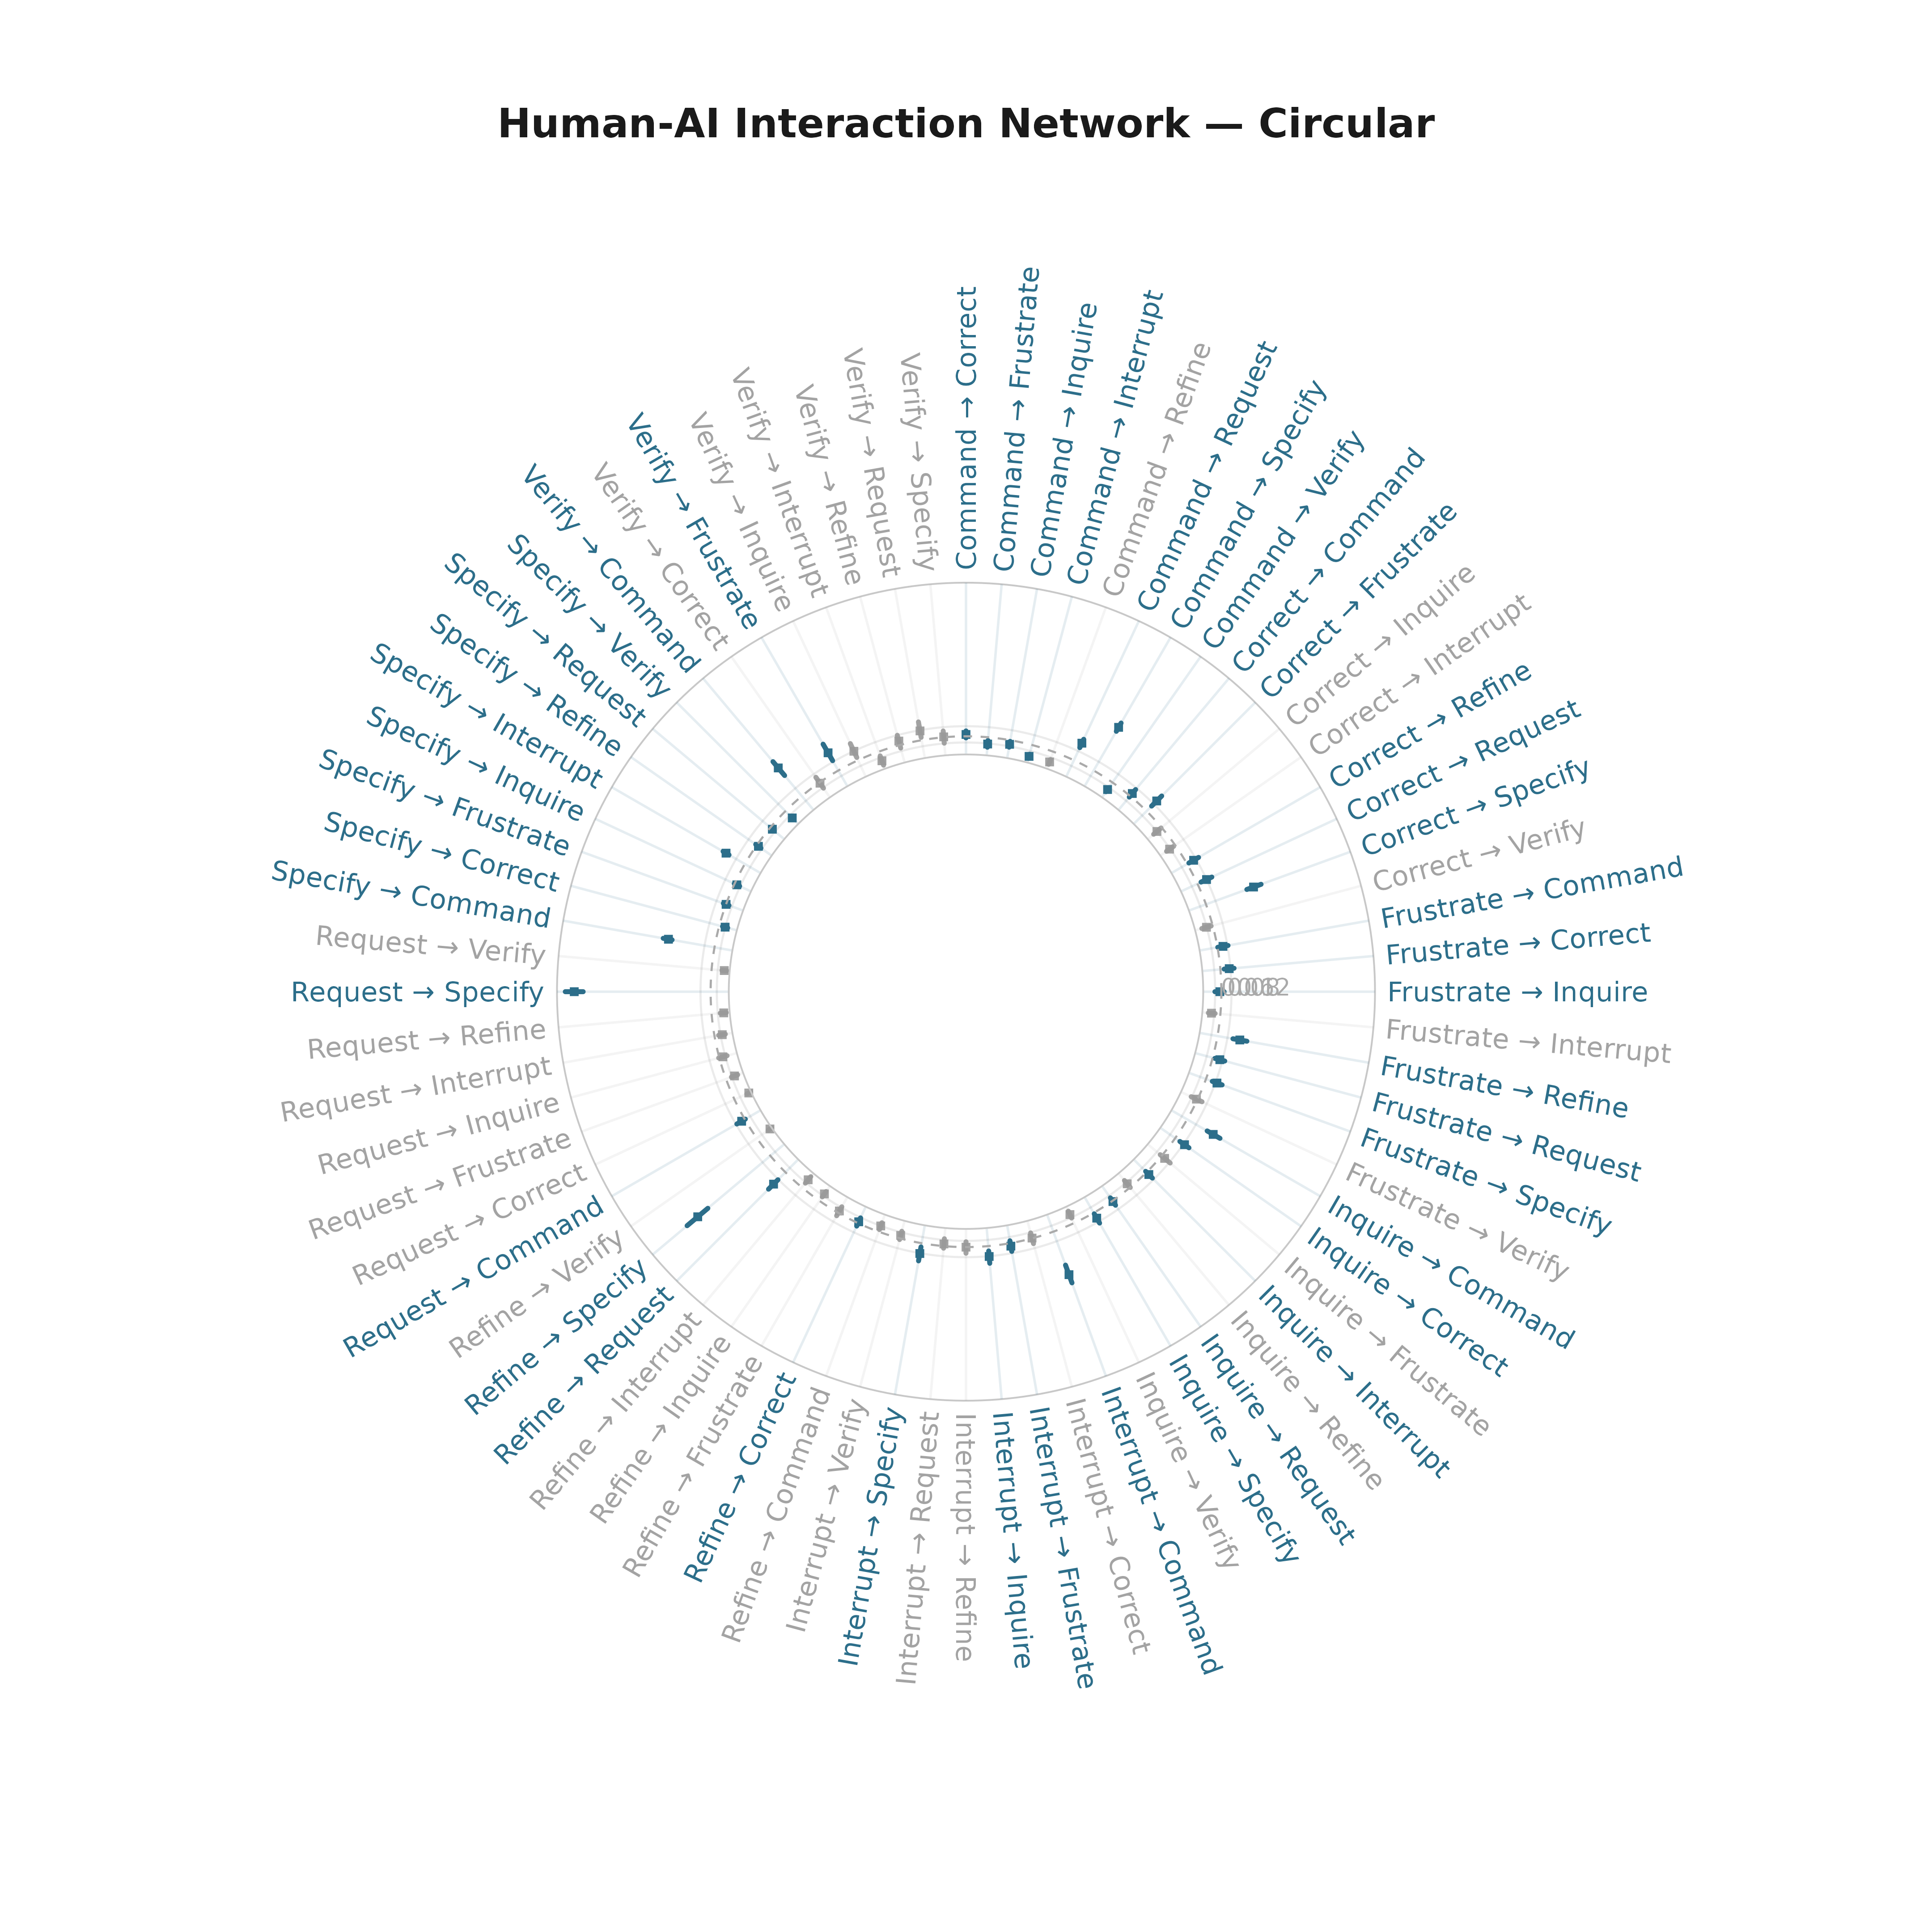
Grouped Radial
plot_bootstrap_forest(boot_tna, layout = "grouped",
  title = "Human-AI Interaction — Grouped by Source Node")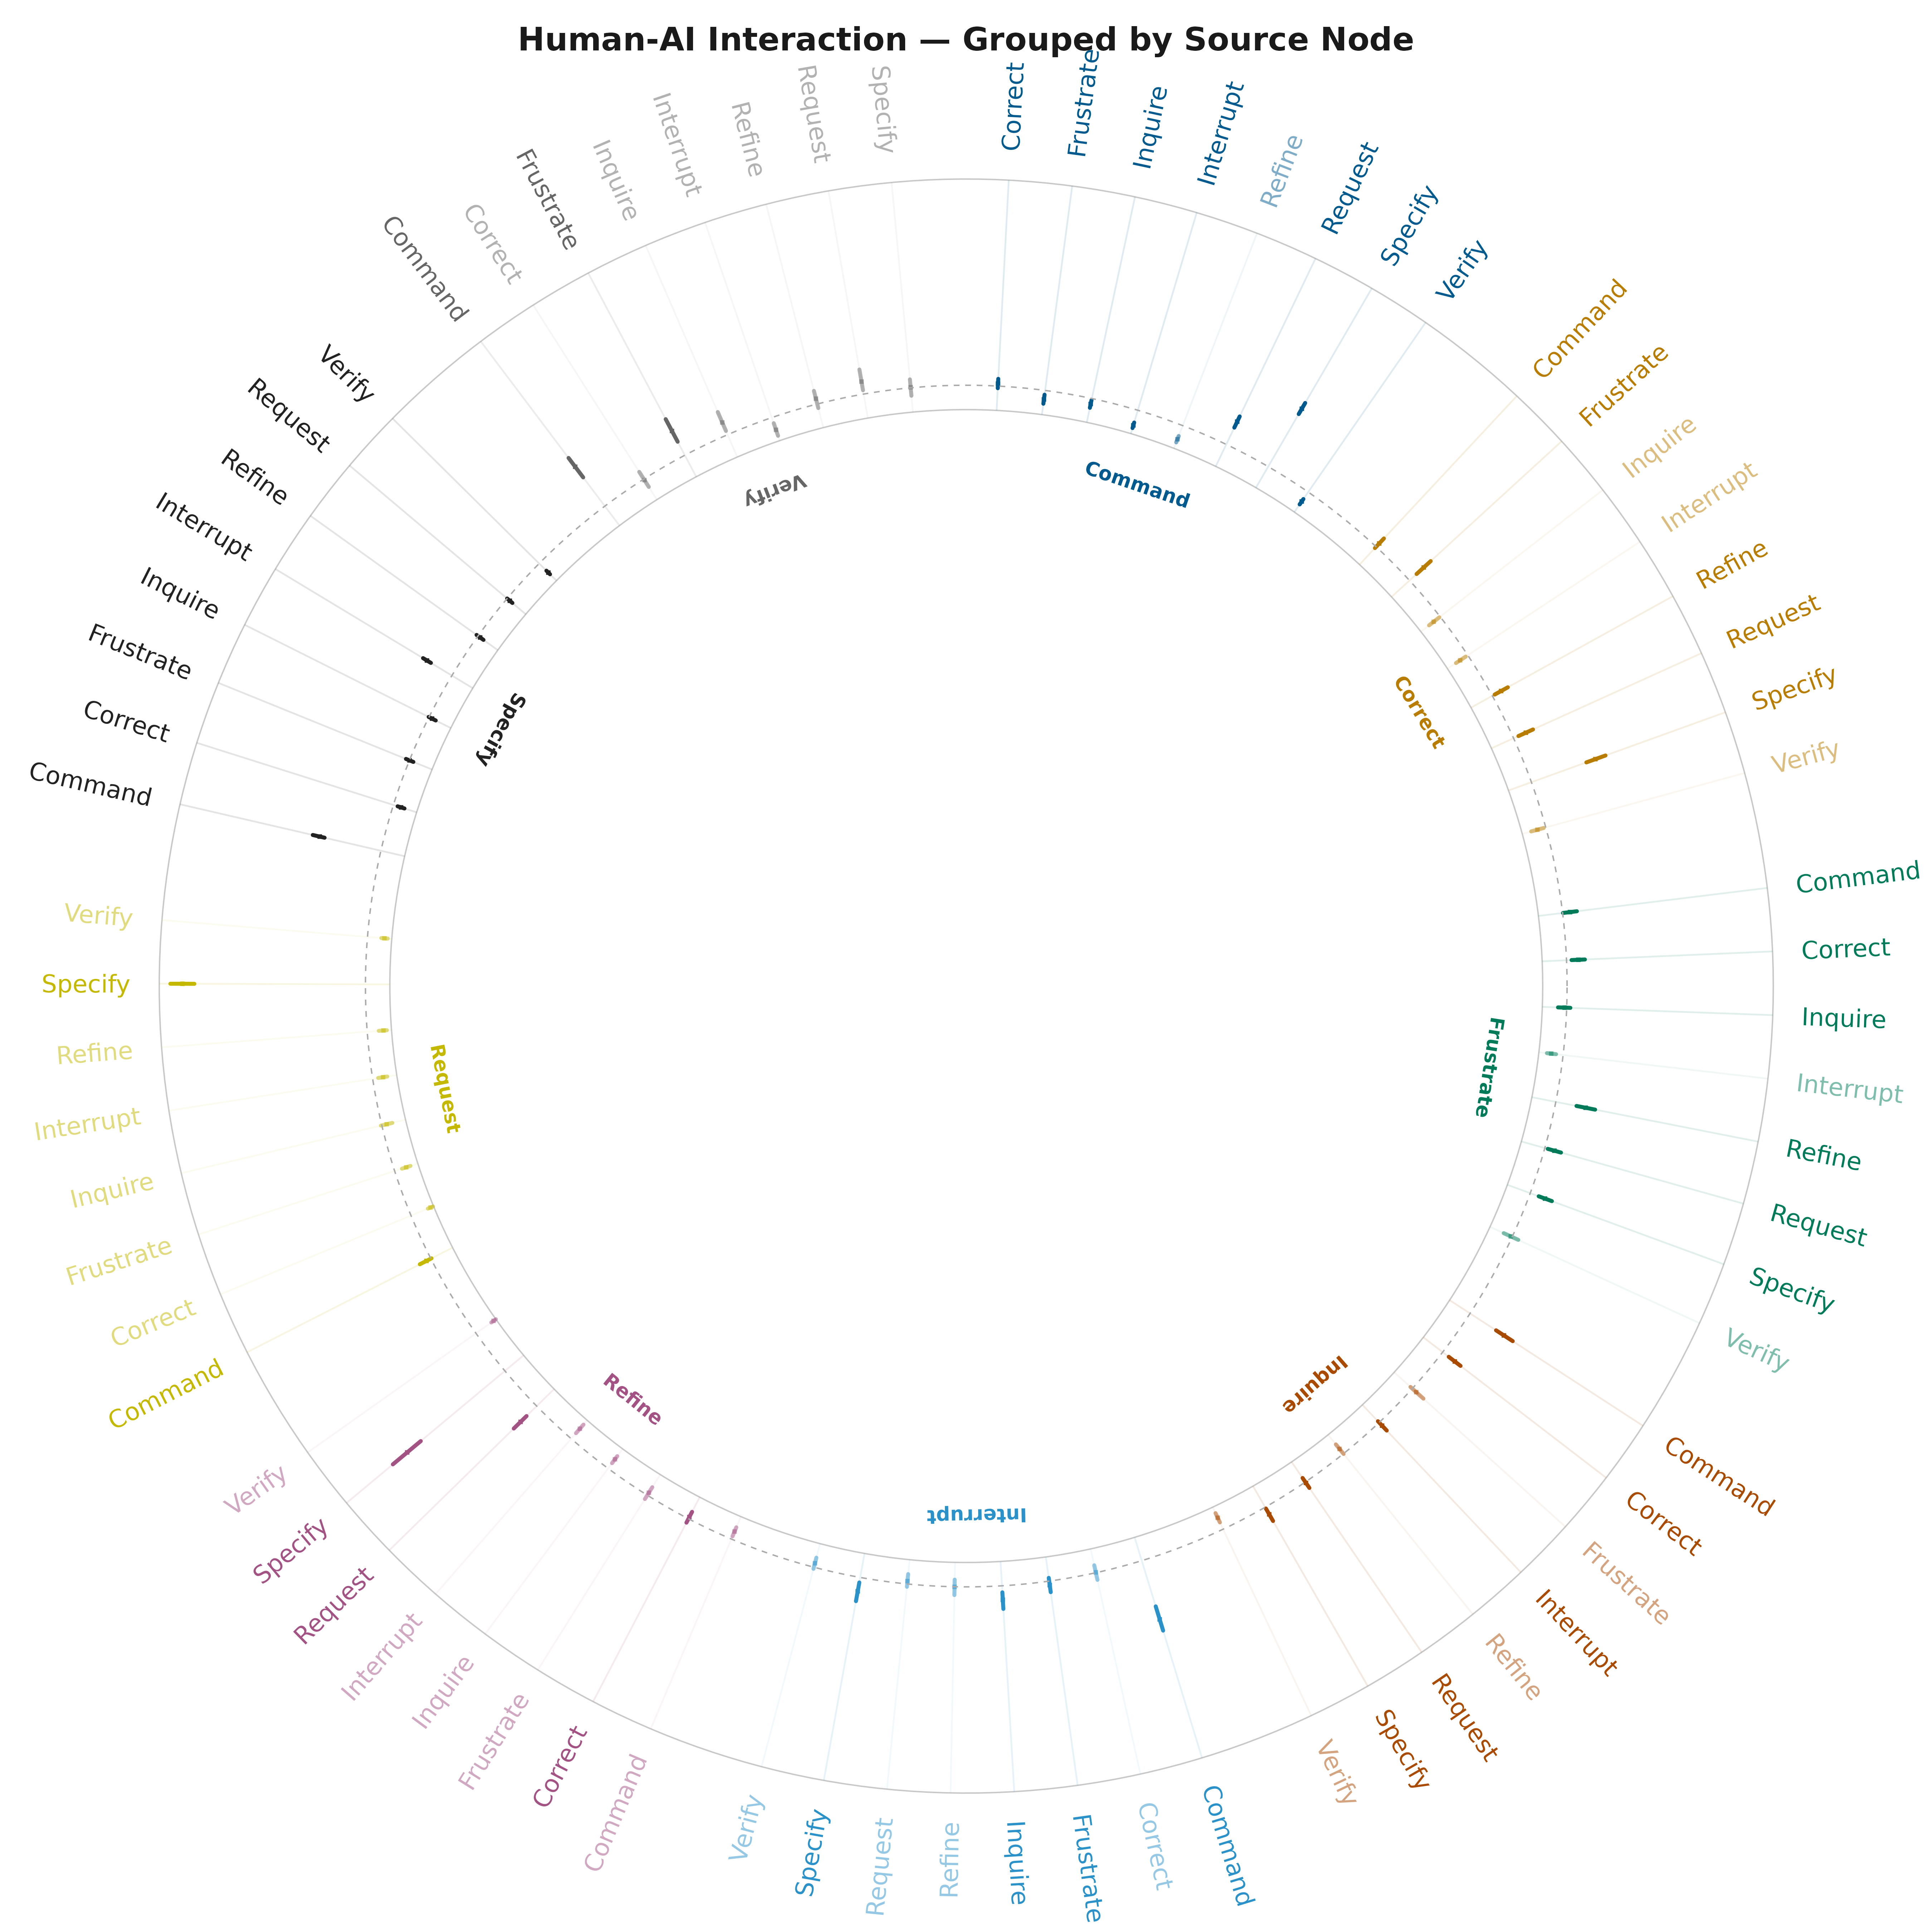
2. Glasso Network (partial correlations)
net_srl  <- build_network(srl_strategies, method = "glasso")
boot_srl <- boot_glasso(net_srl, iter = 200, seed = 42)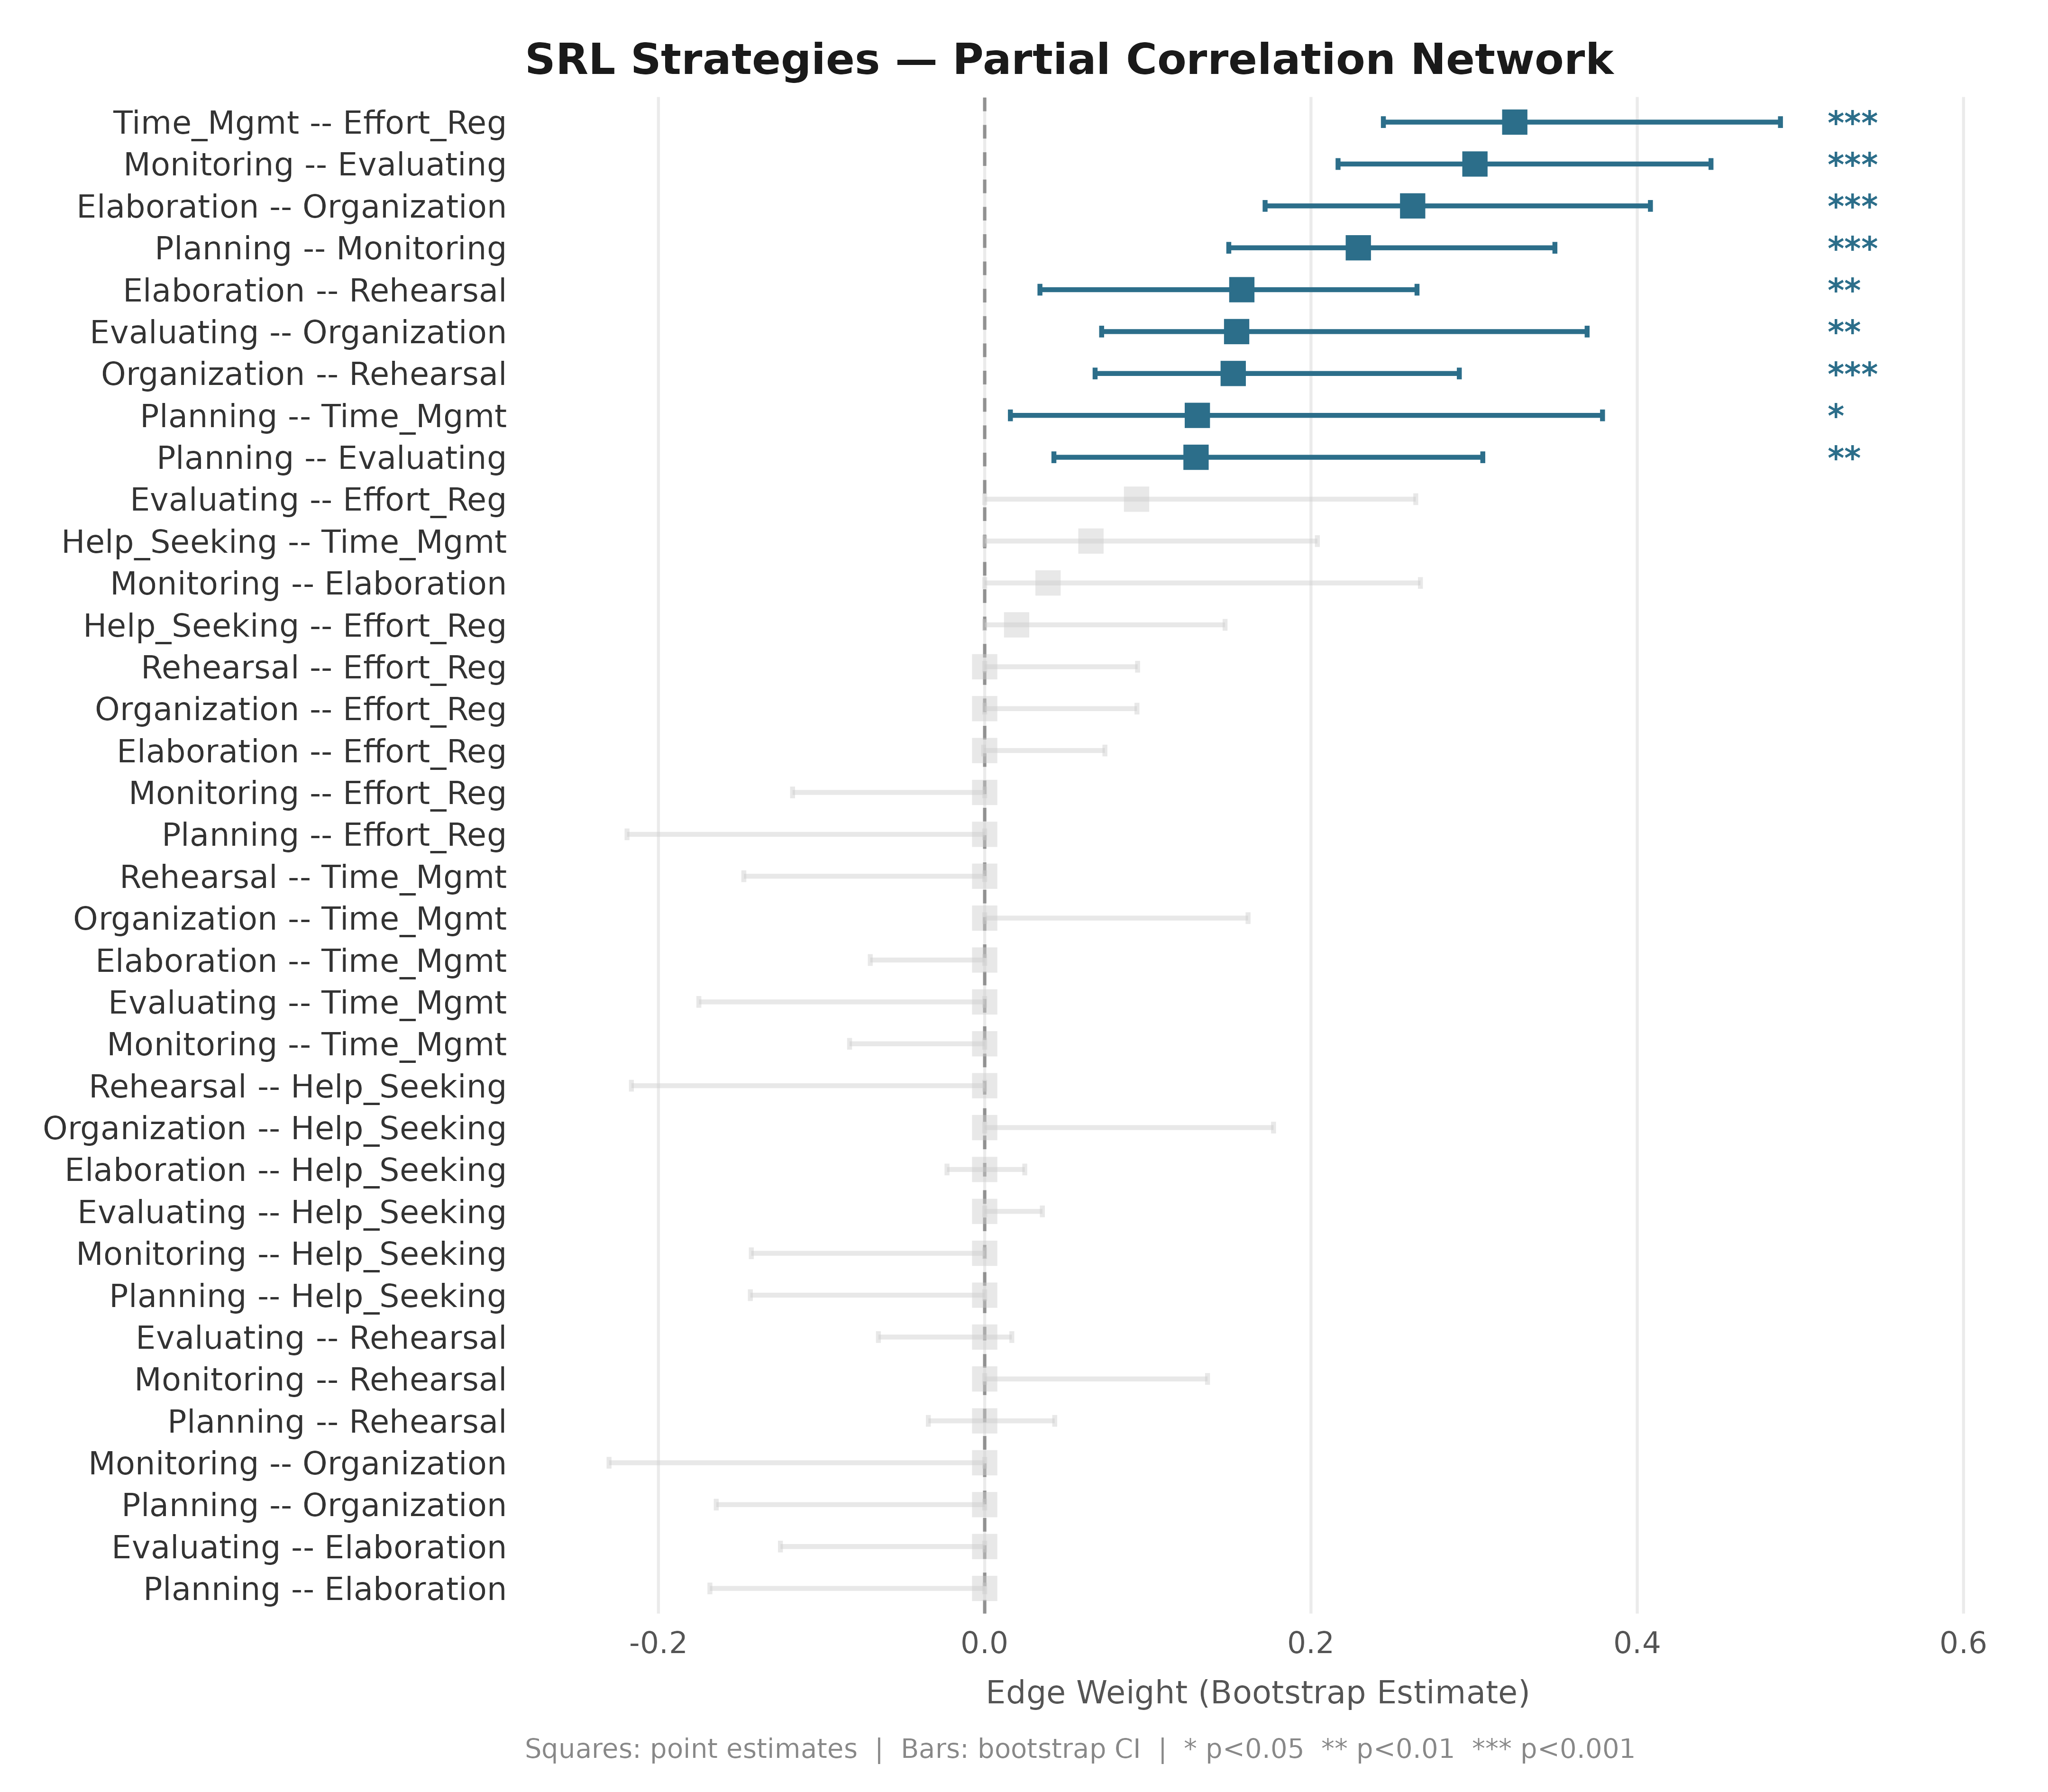
3. Edge Difference Plots (glasso)
Compare whether pairs of edges have significantly different weights.
Linear Forest
plot_edge_diff_forest(boot_srl, layout = "linear", n_top = 25,
  title = "Edge Differences — Linear")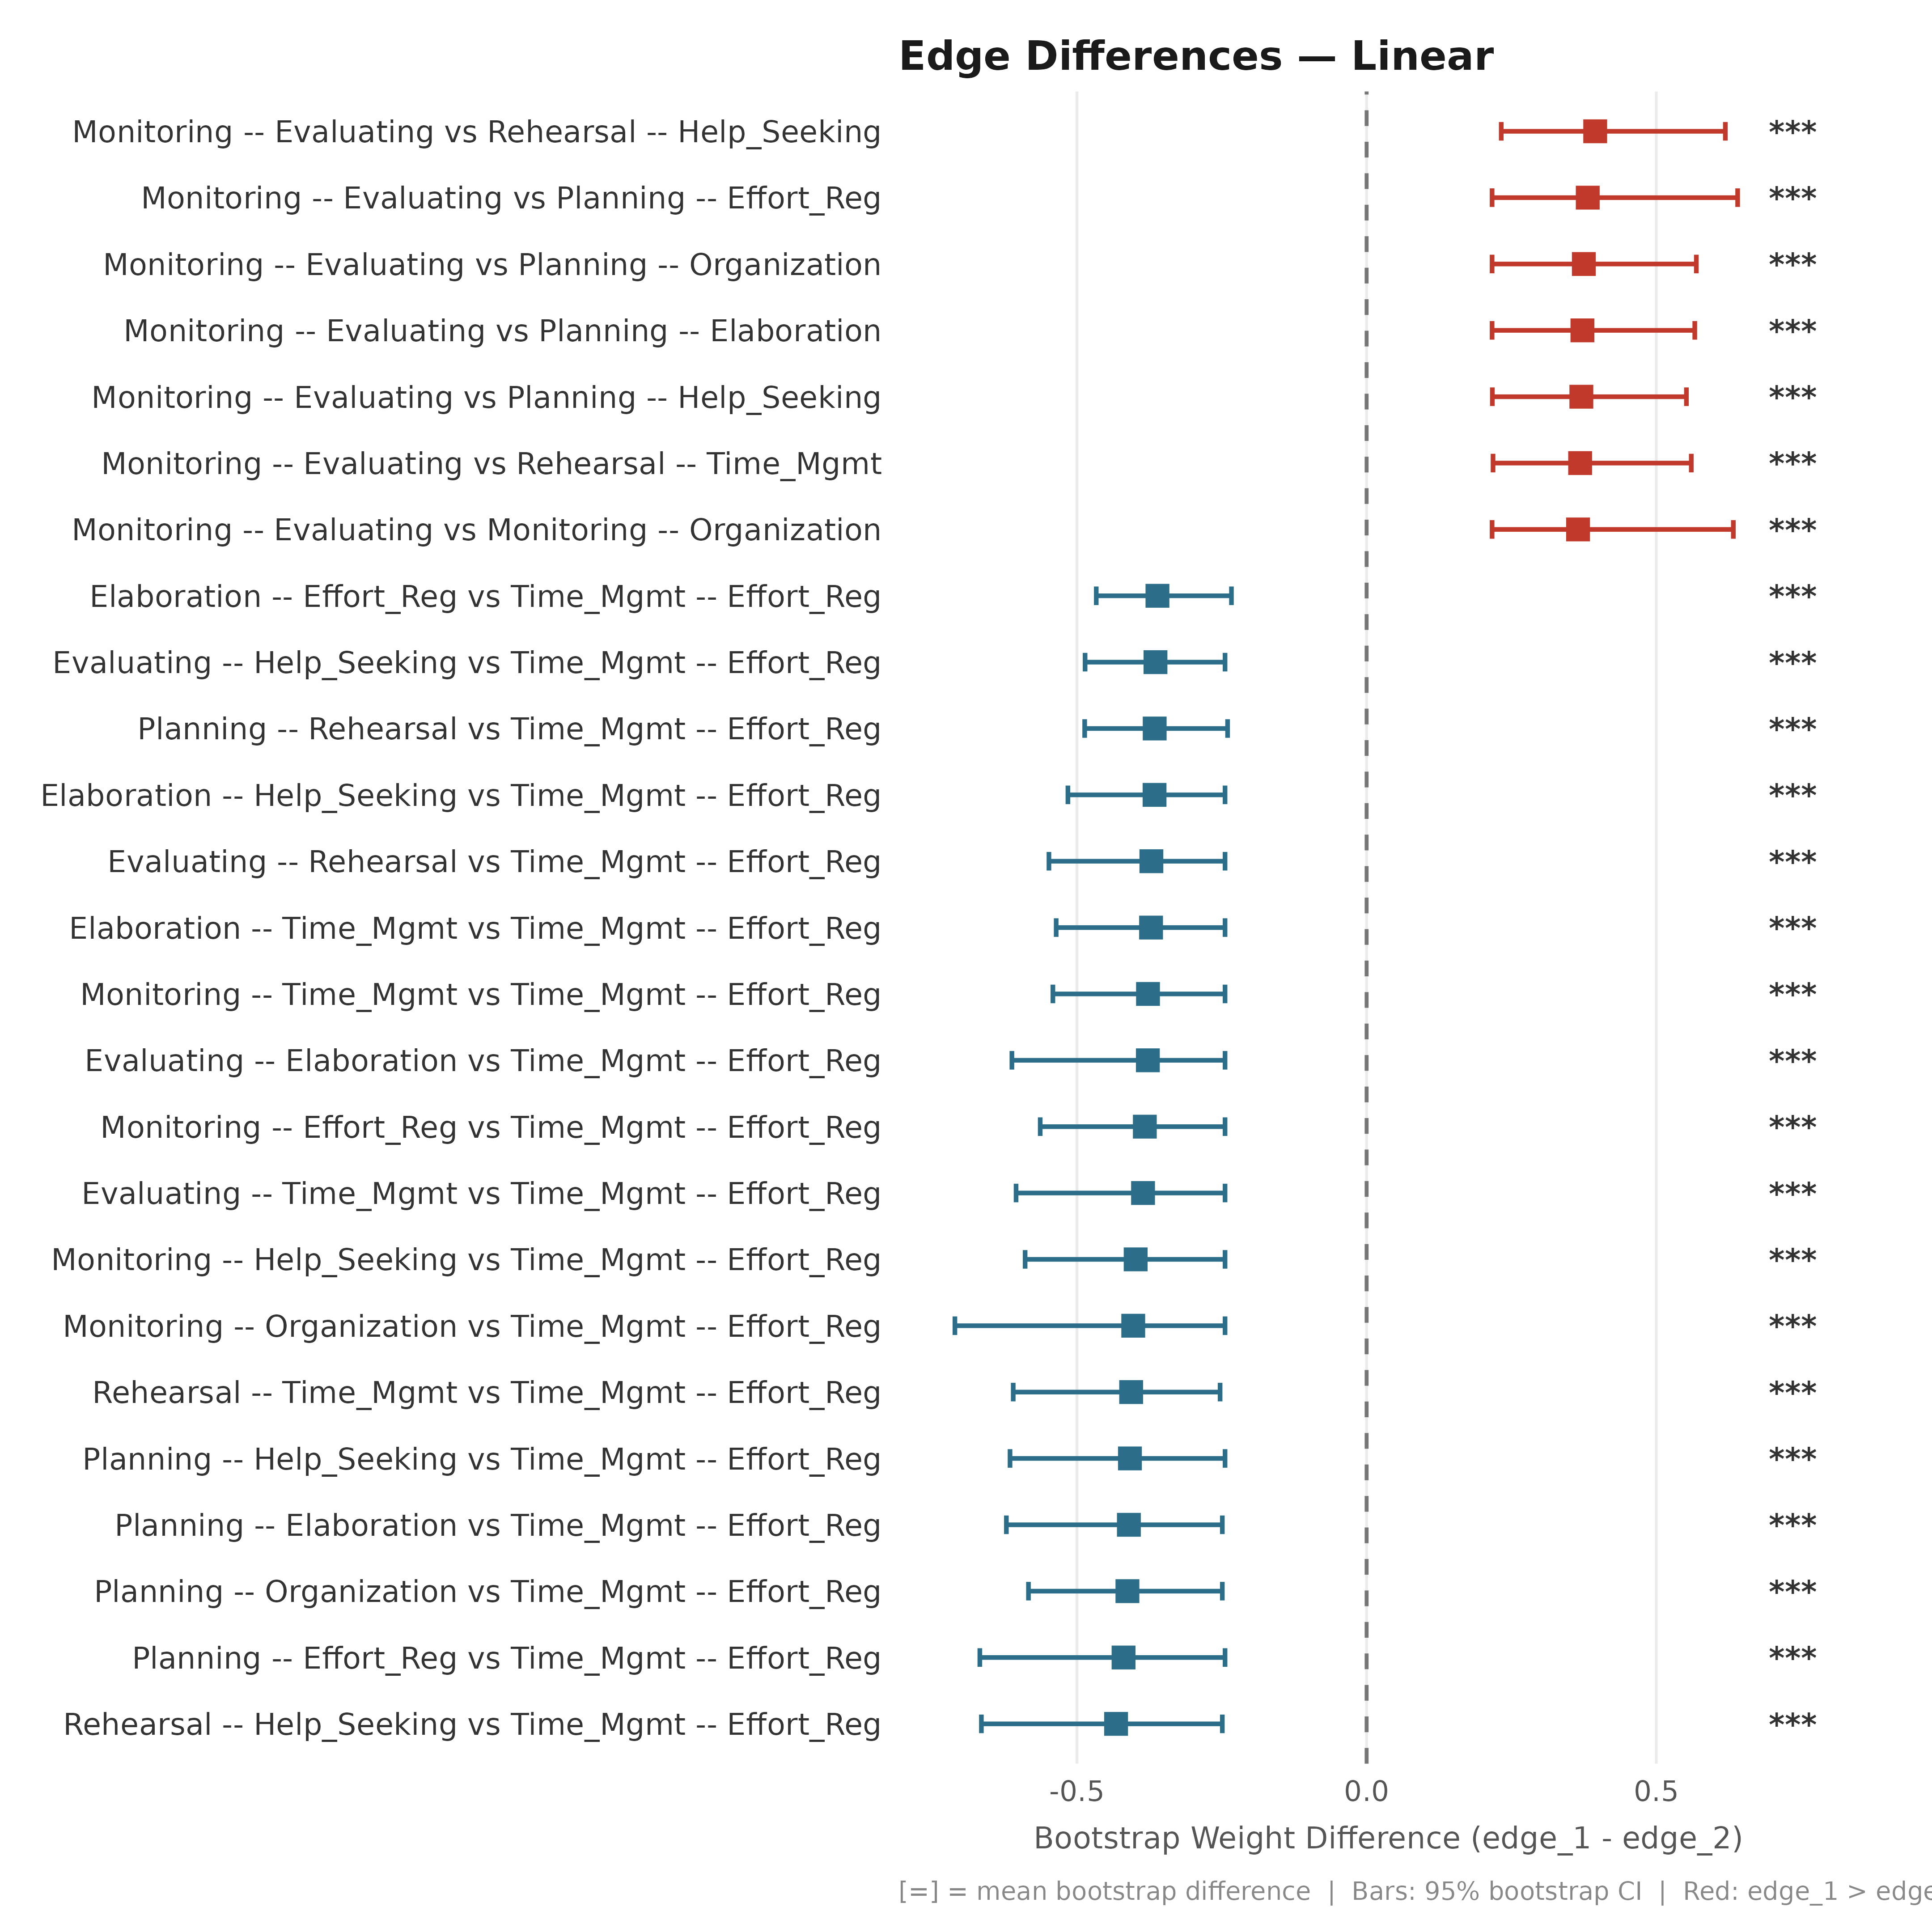
Chord Diagram
plot_edge_diff_forest(boot_srl,
  layout       = "chord",
  nonzero_only = TRUE,
  show_nonsig  = TRUE,
  title        = "Edge Differences — Chord",
  subtitle     = "Node colour = degree  |  ribbon = strength of difference")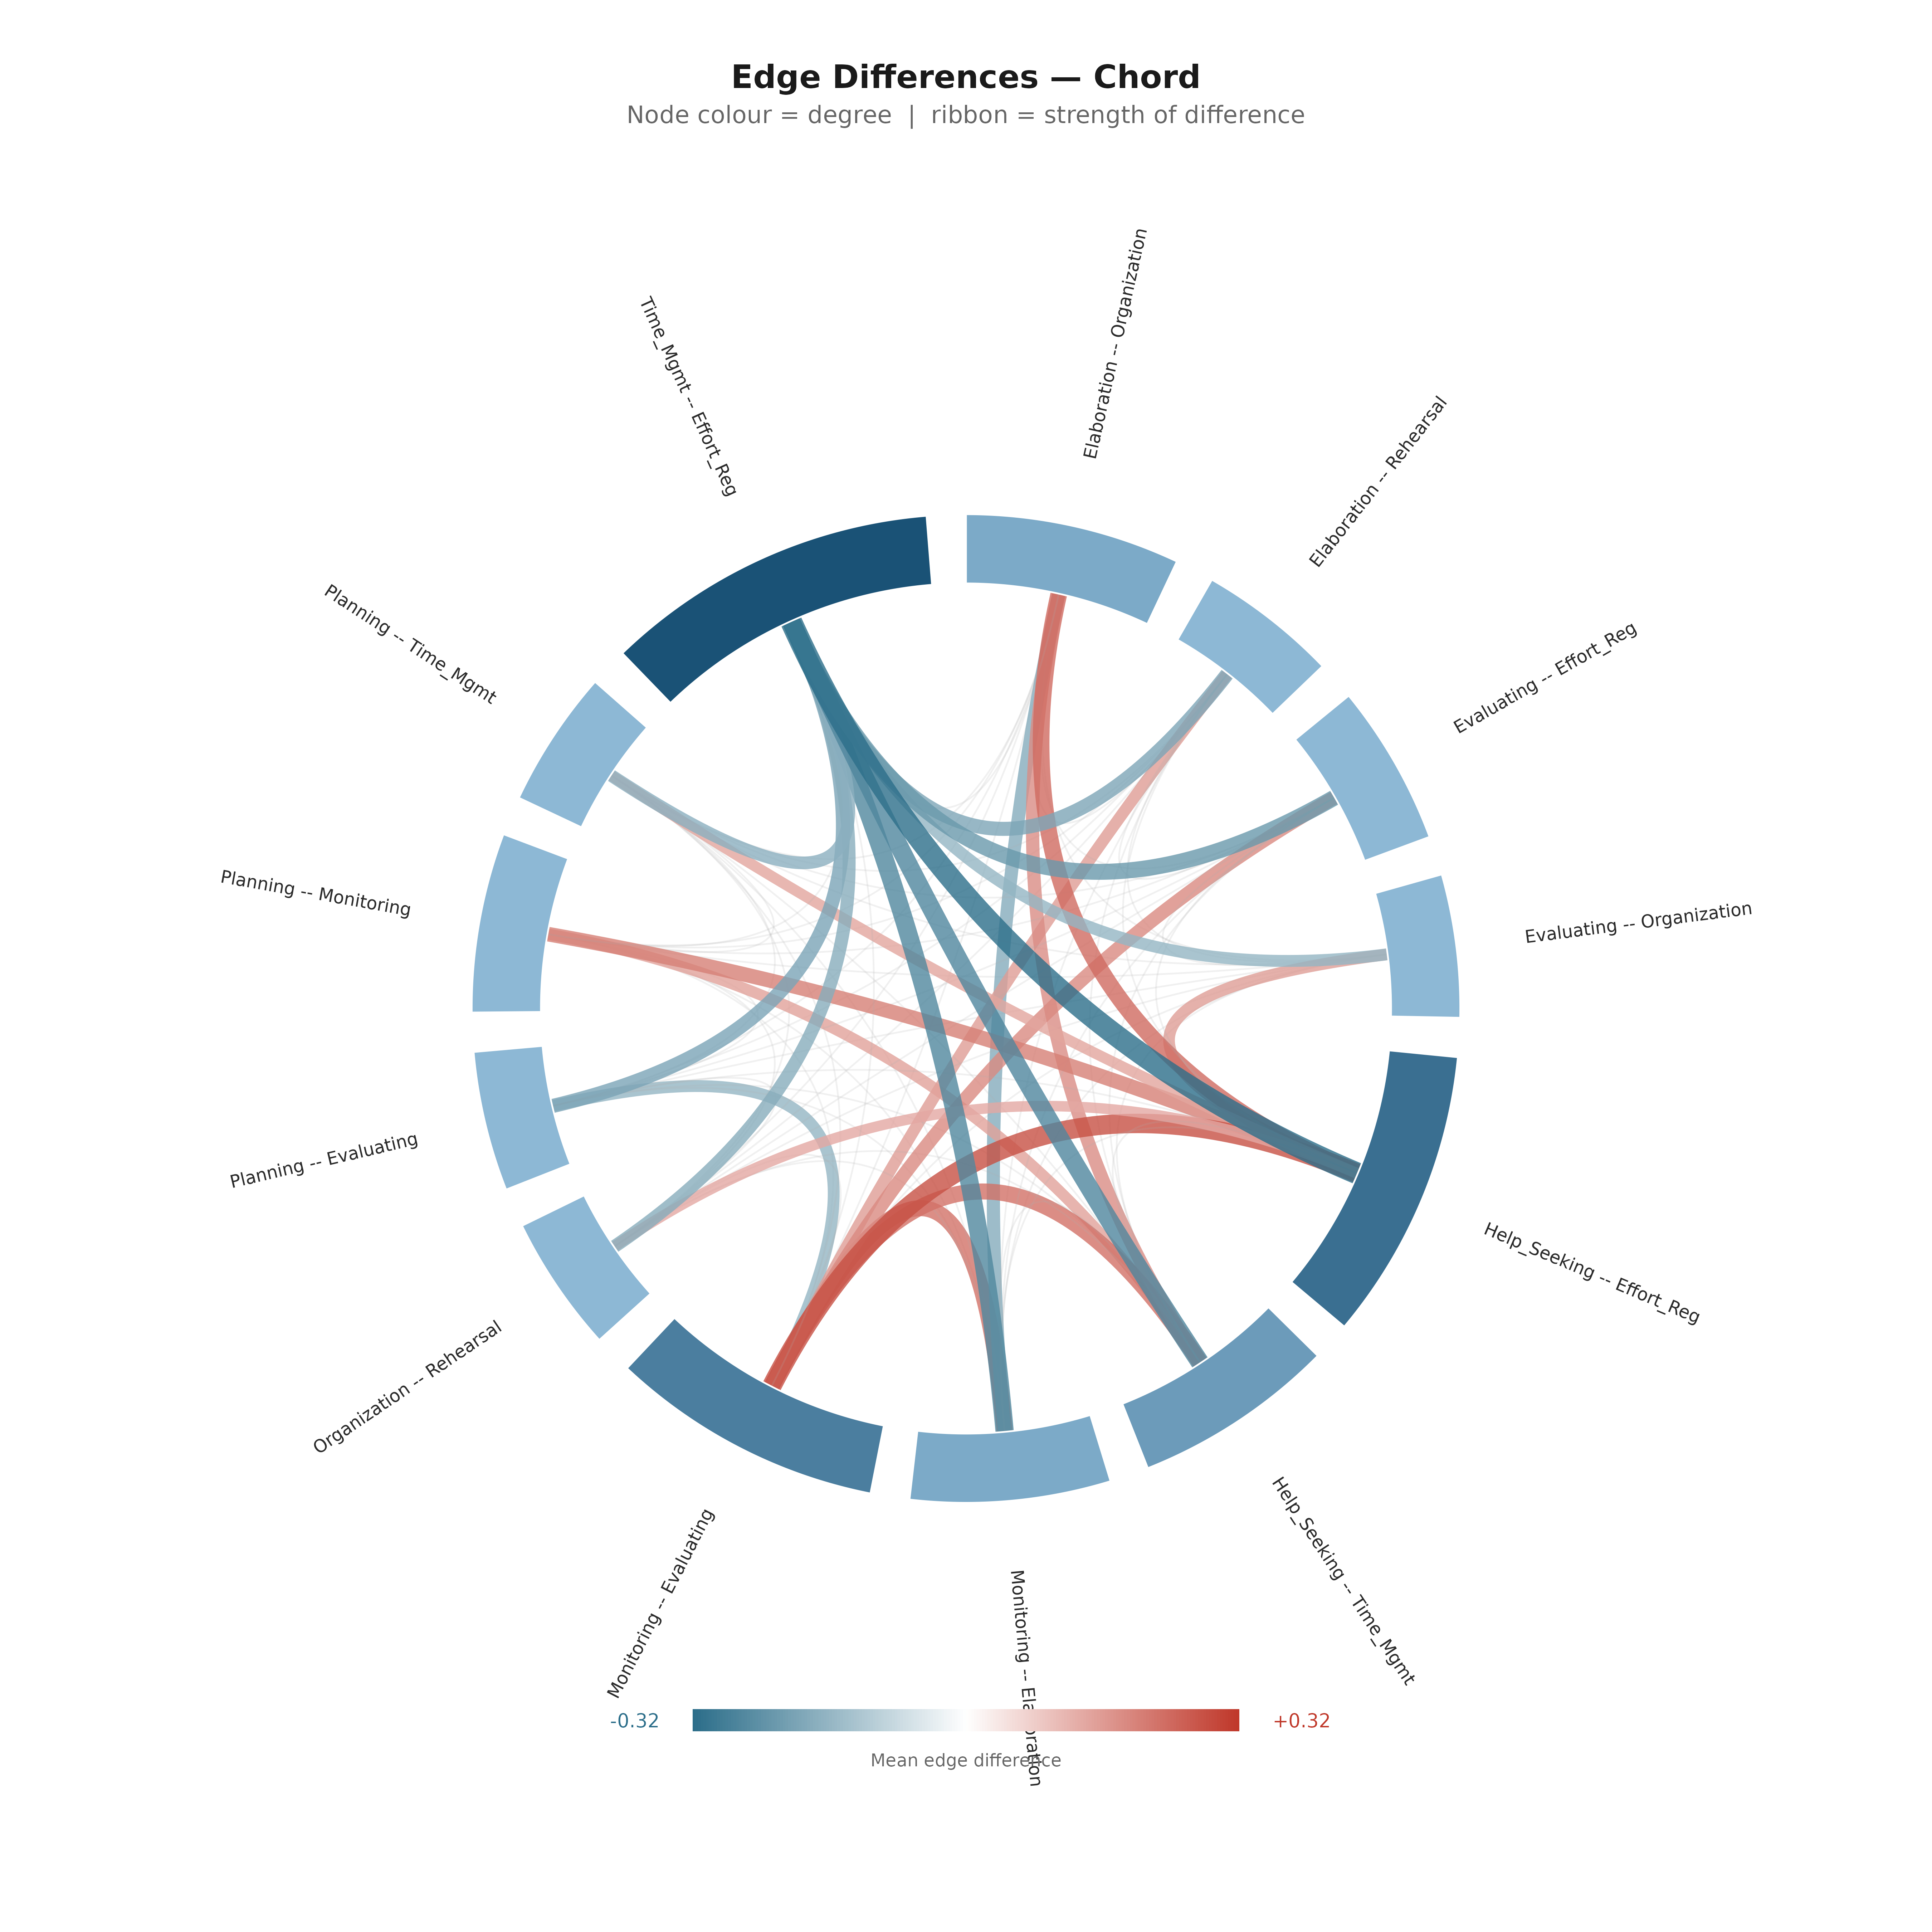
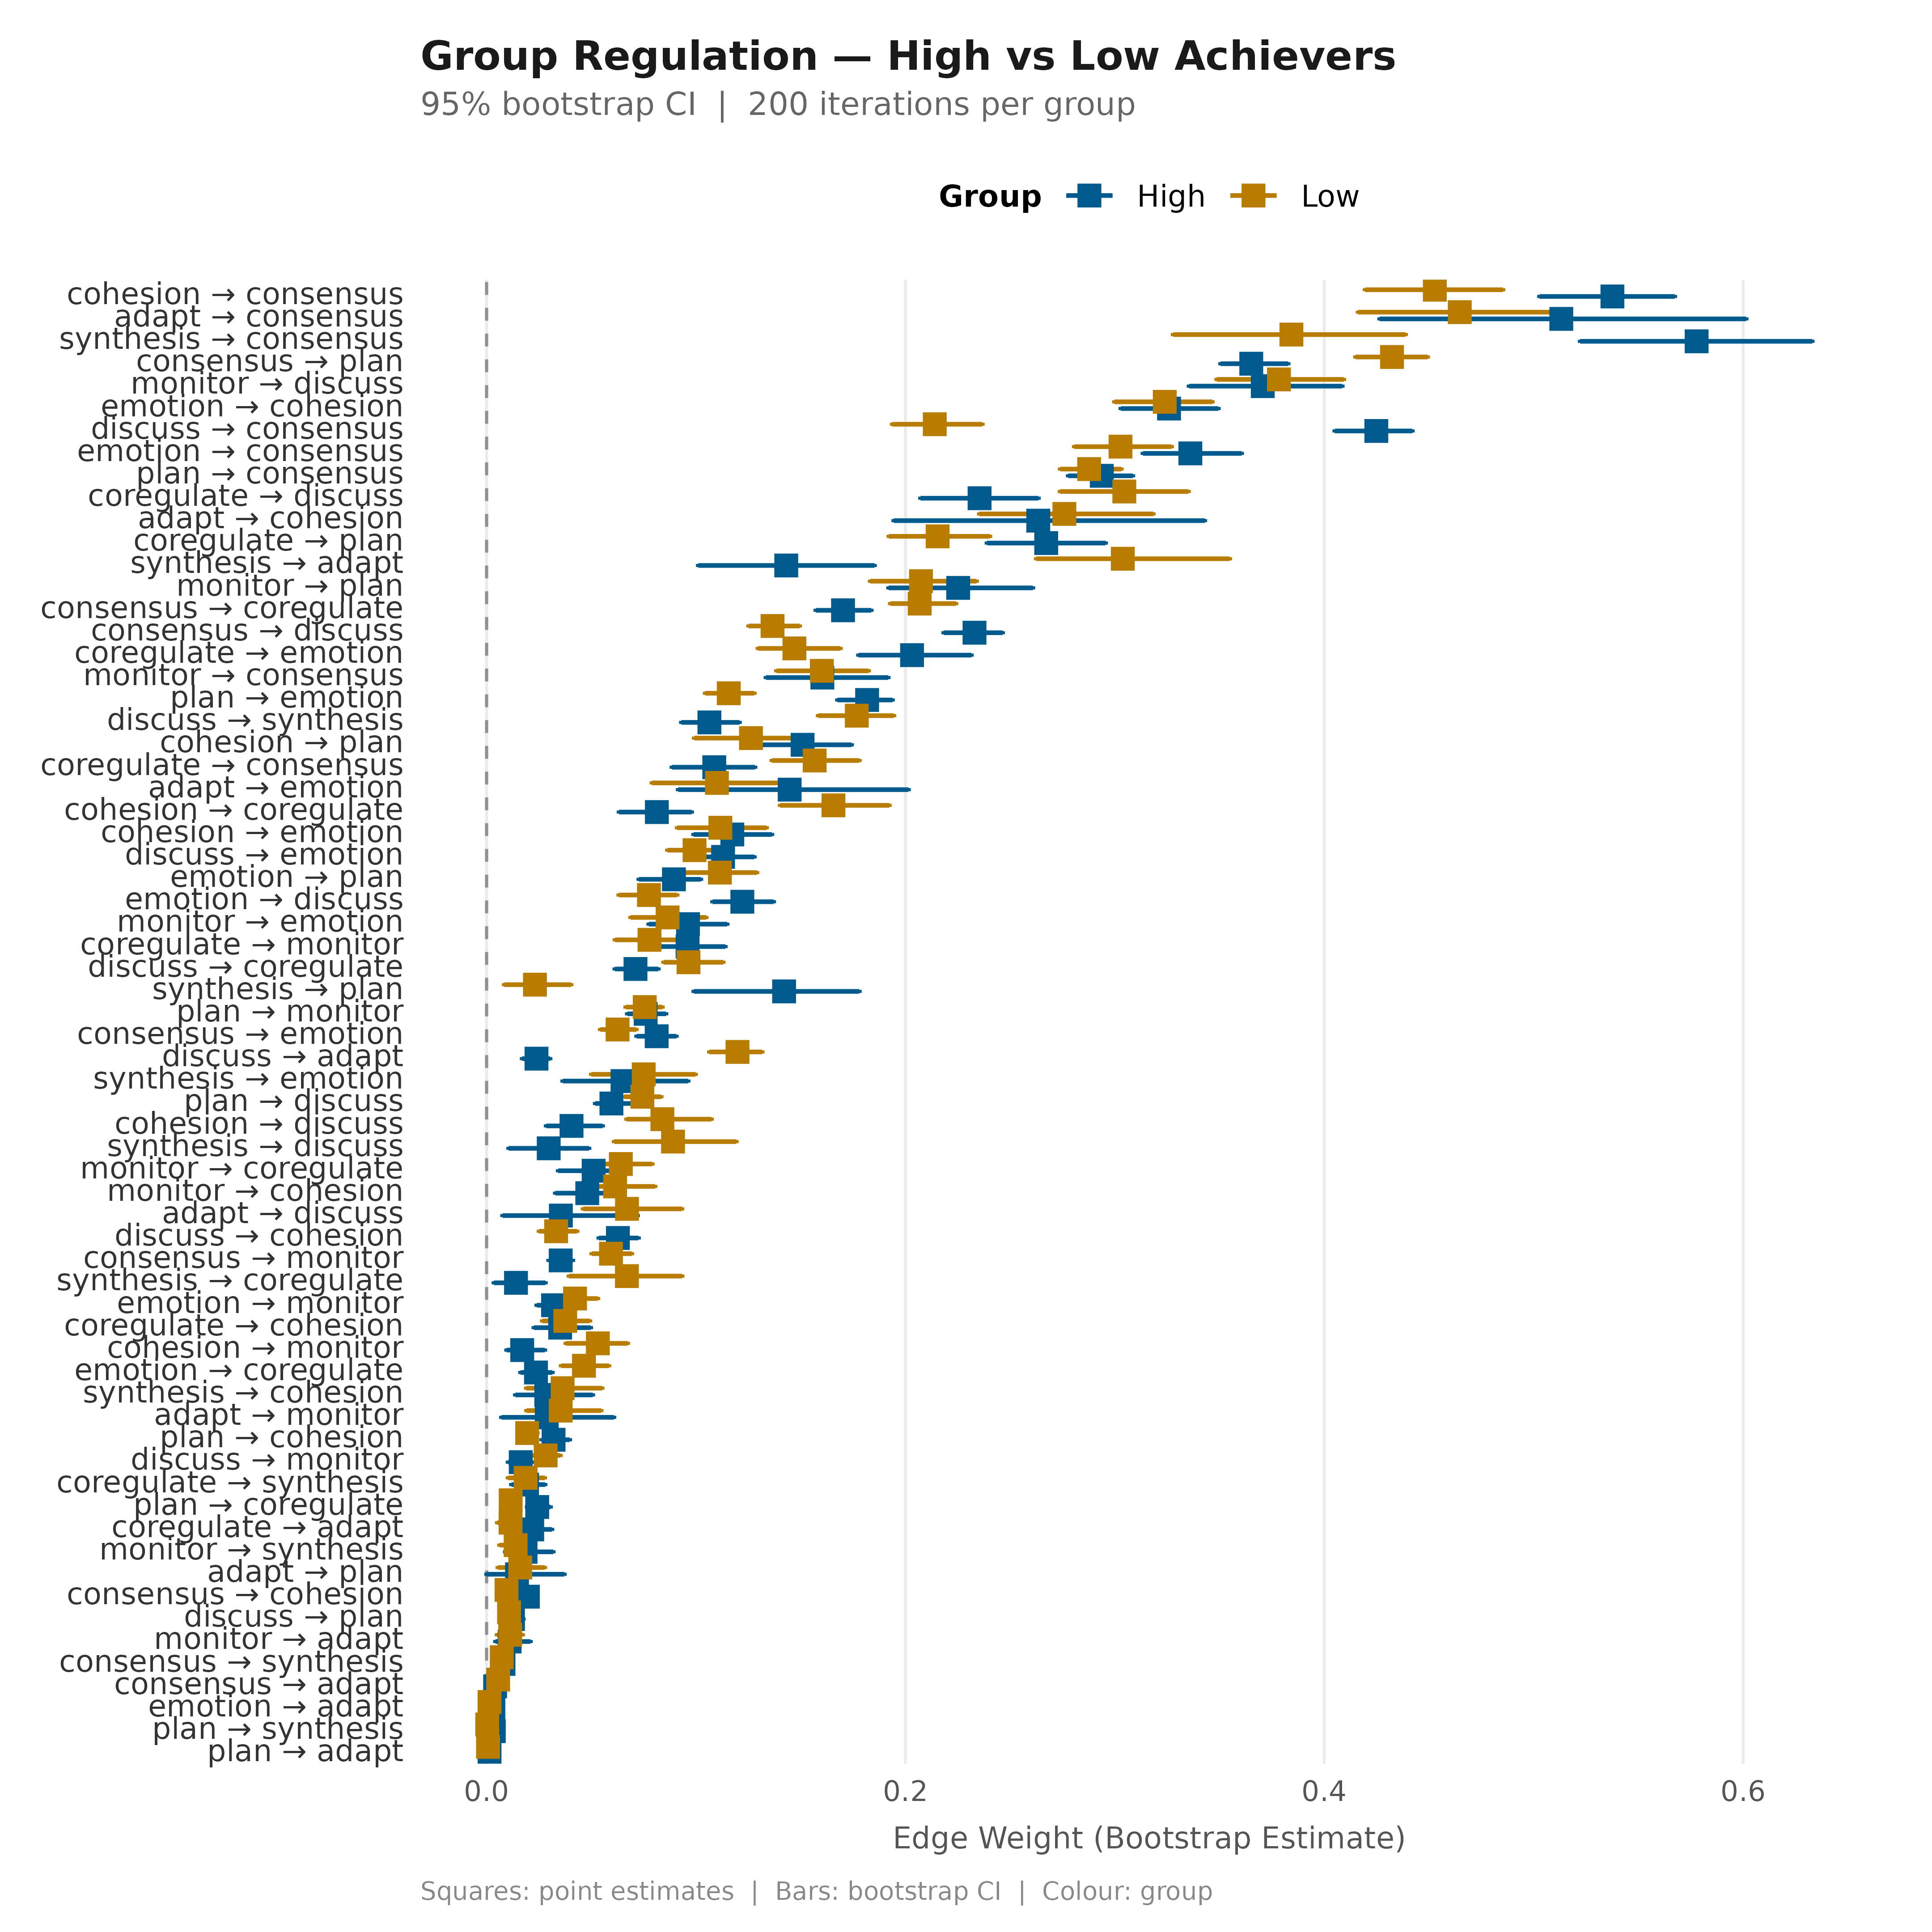
4. Grouped Networks
Compare bootstrap CIs across groups in one plot.
nets_grp  <- build_network(group_regulation_long,
  method = "relative", actor = "Actor",
  action = "Action",  time  = "Time",
  group  = "Achiever")
boots_grp <- bootstrap_network(nets_grp, iter = 200, seed = 42)
plot_bootstrap_forest(boots_grp,
  title    = "Group Regulation — High vs Low Achievers",
  subtitle = "95% bootstrap CI  |  200 iterations per group")