Plot a network combining symmetric (undirected) and asymmetric (directed) matrices with appropriate edge styling.
Creates a network visualization combining edges from a symmetric matrix (rendered as straight undirected edges) and an asymmetric matrix (rendered as curved directed edges).
Usage
plot_mixed_network(
  sym_matrix,
  asym_matrix,
  layout = "oval",
  sym_color = "ivory4",
  asym_color = COGRAPH_SCALE$tna_edge_color,
  curvature = 0.3,
  edge_width = NULL,
  node_size = 7,
  title = NULL,
  threshold = 0,
  edge_labels = TRUE,
  arrow_size = 0.61,
  edge_label_size = 0.6,
  edge_label_position = 0.7,
  initial = NULL,
  ...
)
Arguments
- sym_matrix
A symmetric matrix representing undirected relationships. These edges will be drawn straight without arrows.
- asym_matrix
An asymmetric matrix representing directed relationships. These edges will be drawn curved with arrows. Reciprocal edges curve in opposite directions.
- layout
Layout algorithm or coordinate matrix. Default "oval".
- sym_color
Color for symmetric/undirected edges. Default "#457B9D" (steel blue).
- asym_color
Color for asymmetric/directed edges. Can be a single color or a vector of two colors for positive/negative directions. Default "#003355" (dark blue, matching TNA style).
- curvature
Curvature magnitude for directed edges. Default 0.3.
- edge_width
Edge width(s). If NULL (default), scales automatically by edge weight like TNA plots. Pass a numeric value to override.
- node_size
Node size. Default 7.
- title
Plot title. Default NULL.
- threshold
Minimum absolute edge weight to display. Values with
abs(value) < thresholdare set to zero (edge removed). Default 0. Zero-weight edges are always removed regardless of this setting.- edge_labels
Show edge weight labels. Default TRUE.
- arrow_size
Arrow head size for directed edges. Default 0.61 (TNA style).
- edge_label_size
Size of edge labels. Default 0.6.
- edge_label_position
Position of edge labels along edge (0-1). Default 0.7.
- initial
Optional named numeric vector of initial state probabilities (length = number of nodes). When provided, nodes are drawn as donuts with the fill proportion equal to the initial probability. Default NULL.
- ...
Additional arguments passed to splot().
Examples
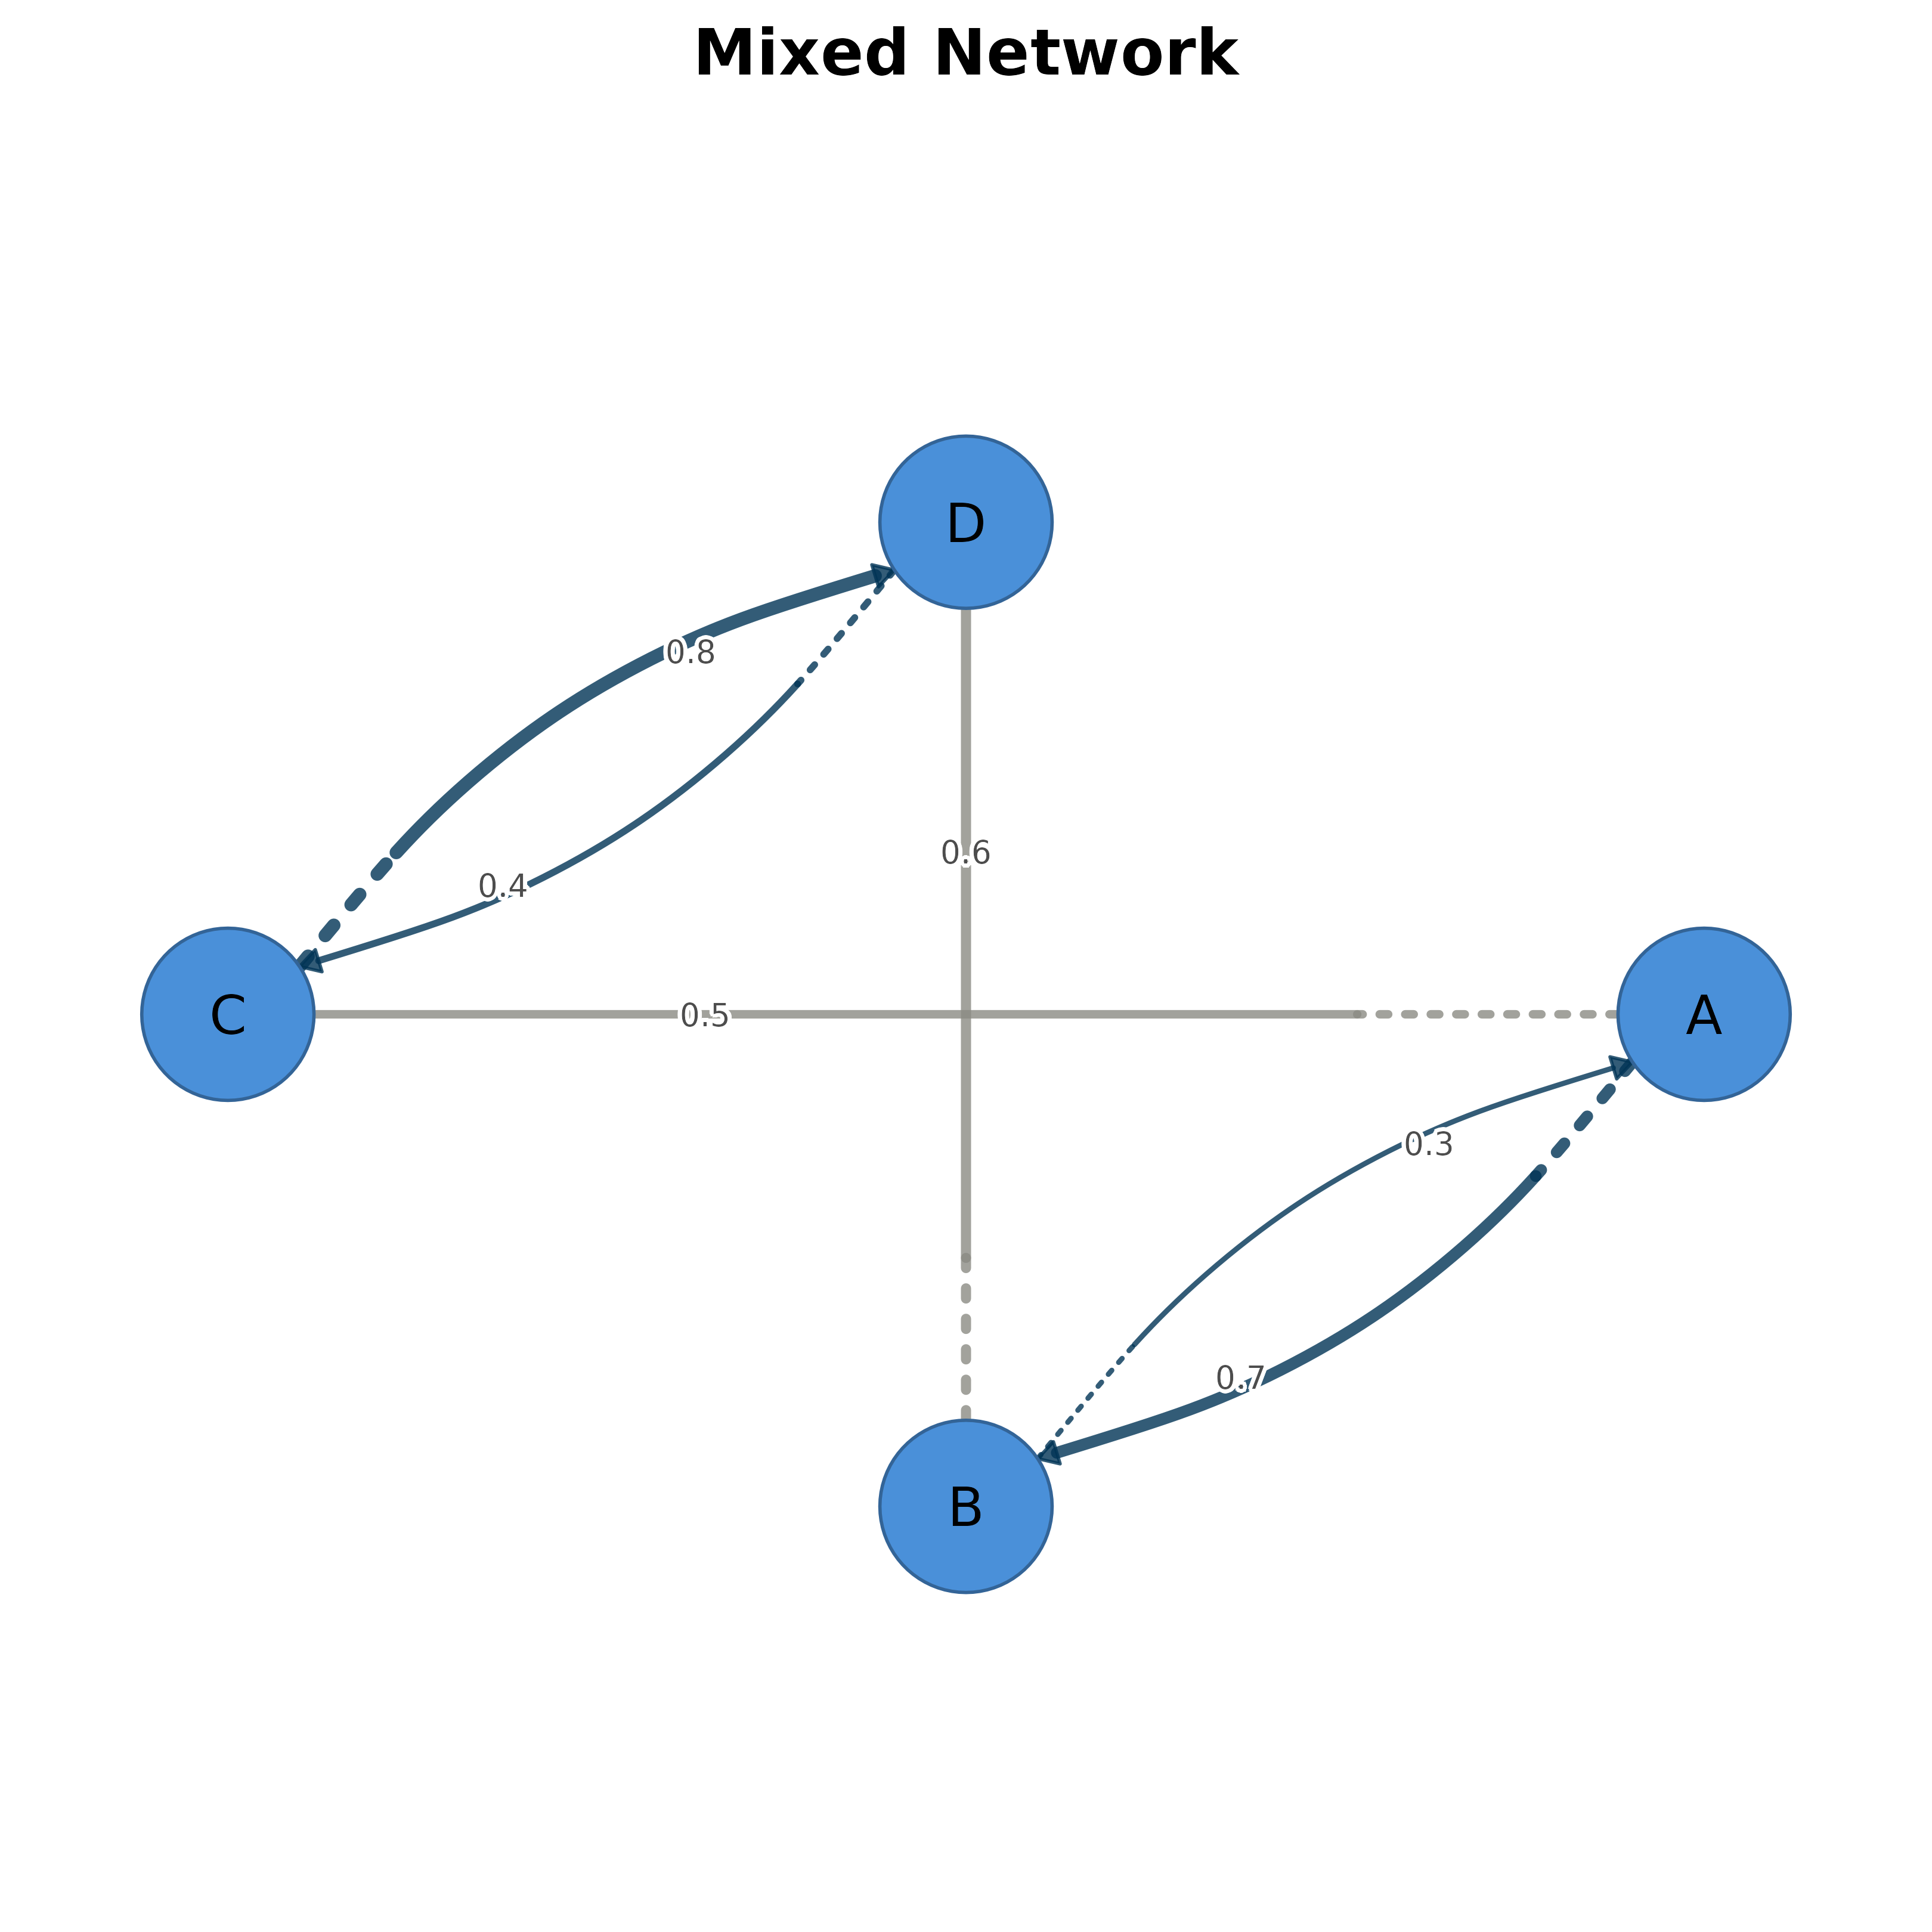
# Create symmetric matrix (undirected)
sym <- matrix(0, 4, 4, dimnames = list(LETTERS[1:4], LETTERS[1:4]))
sym[1,2] <- sym[2,1] <- 0.5
sym[3,4] <- sym[4,3] <- 0.6

# Create asymmetric matrix (directed)
asym <- matrix(0, 4, 4, dimnames = list(LETTERS[1:4], LETTERS[1:4]))
asym[1,3] <- 0.7
asym[3,1] <- 0.3
asym[2,4] <- 0.8
asym[4,2] <- 0.4

# Plot combined network
plot_mixed_network(sym, asym, title = "Mixed Network")