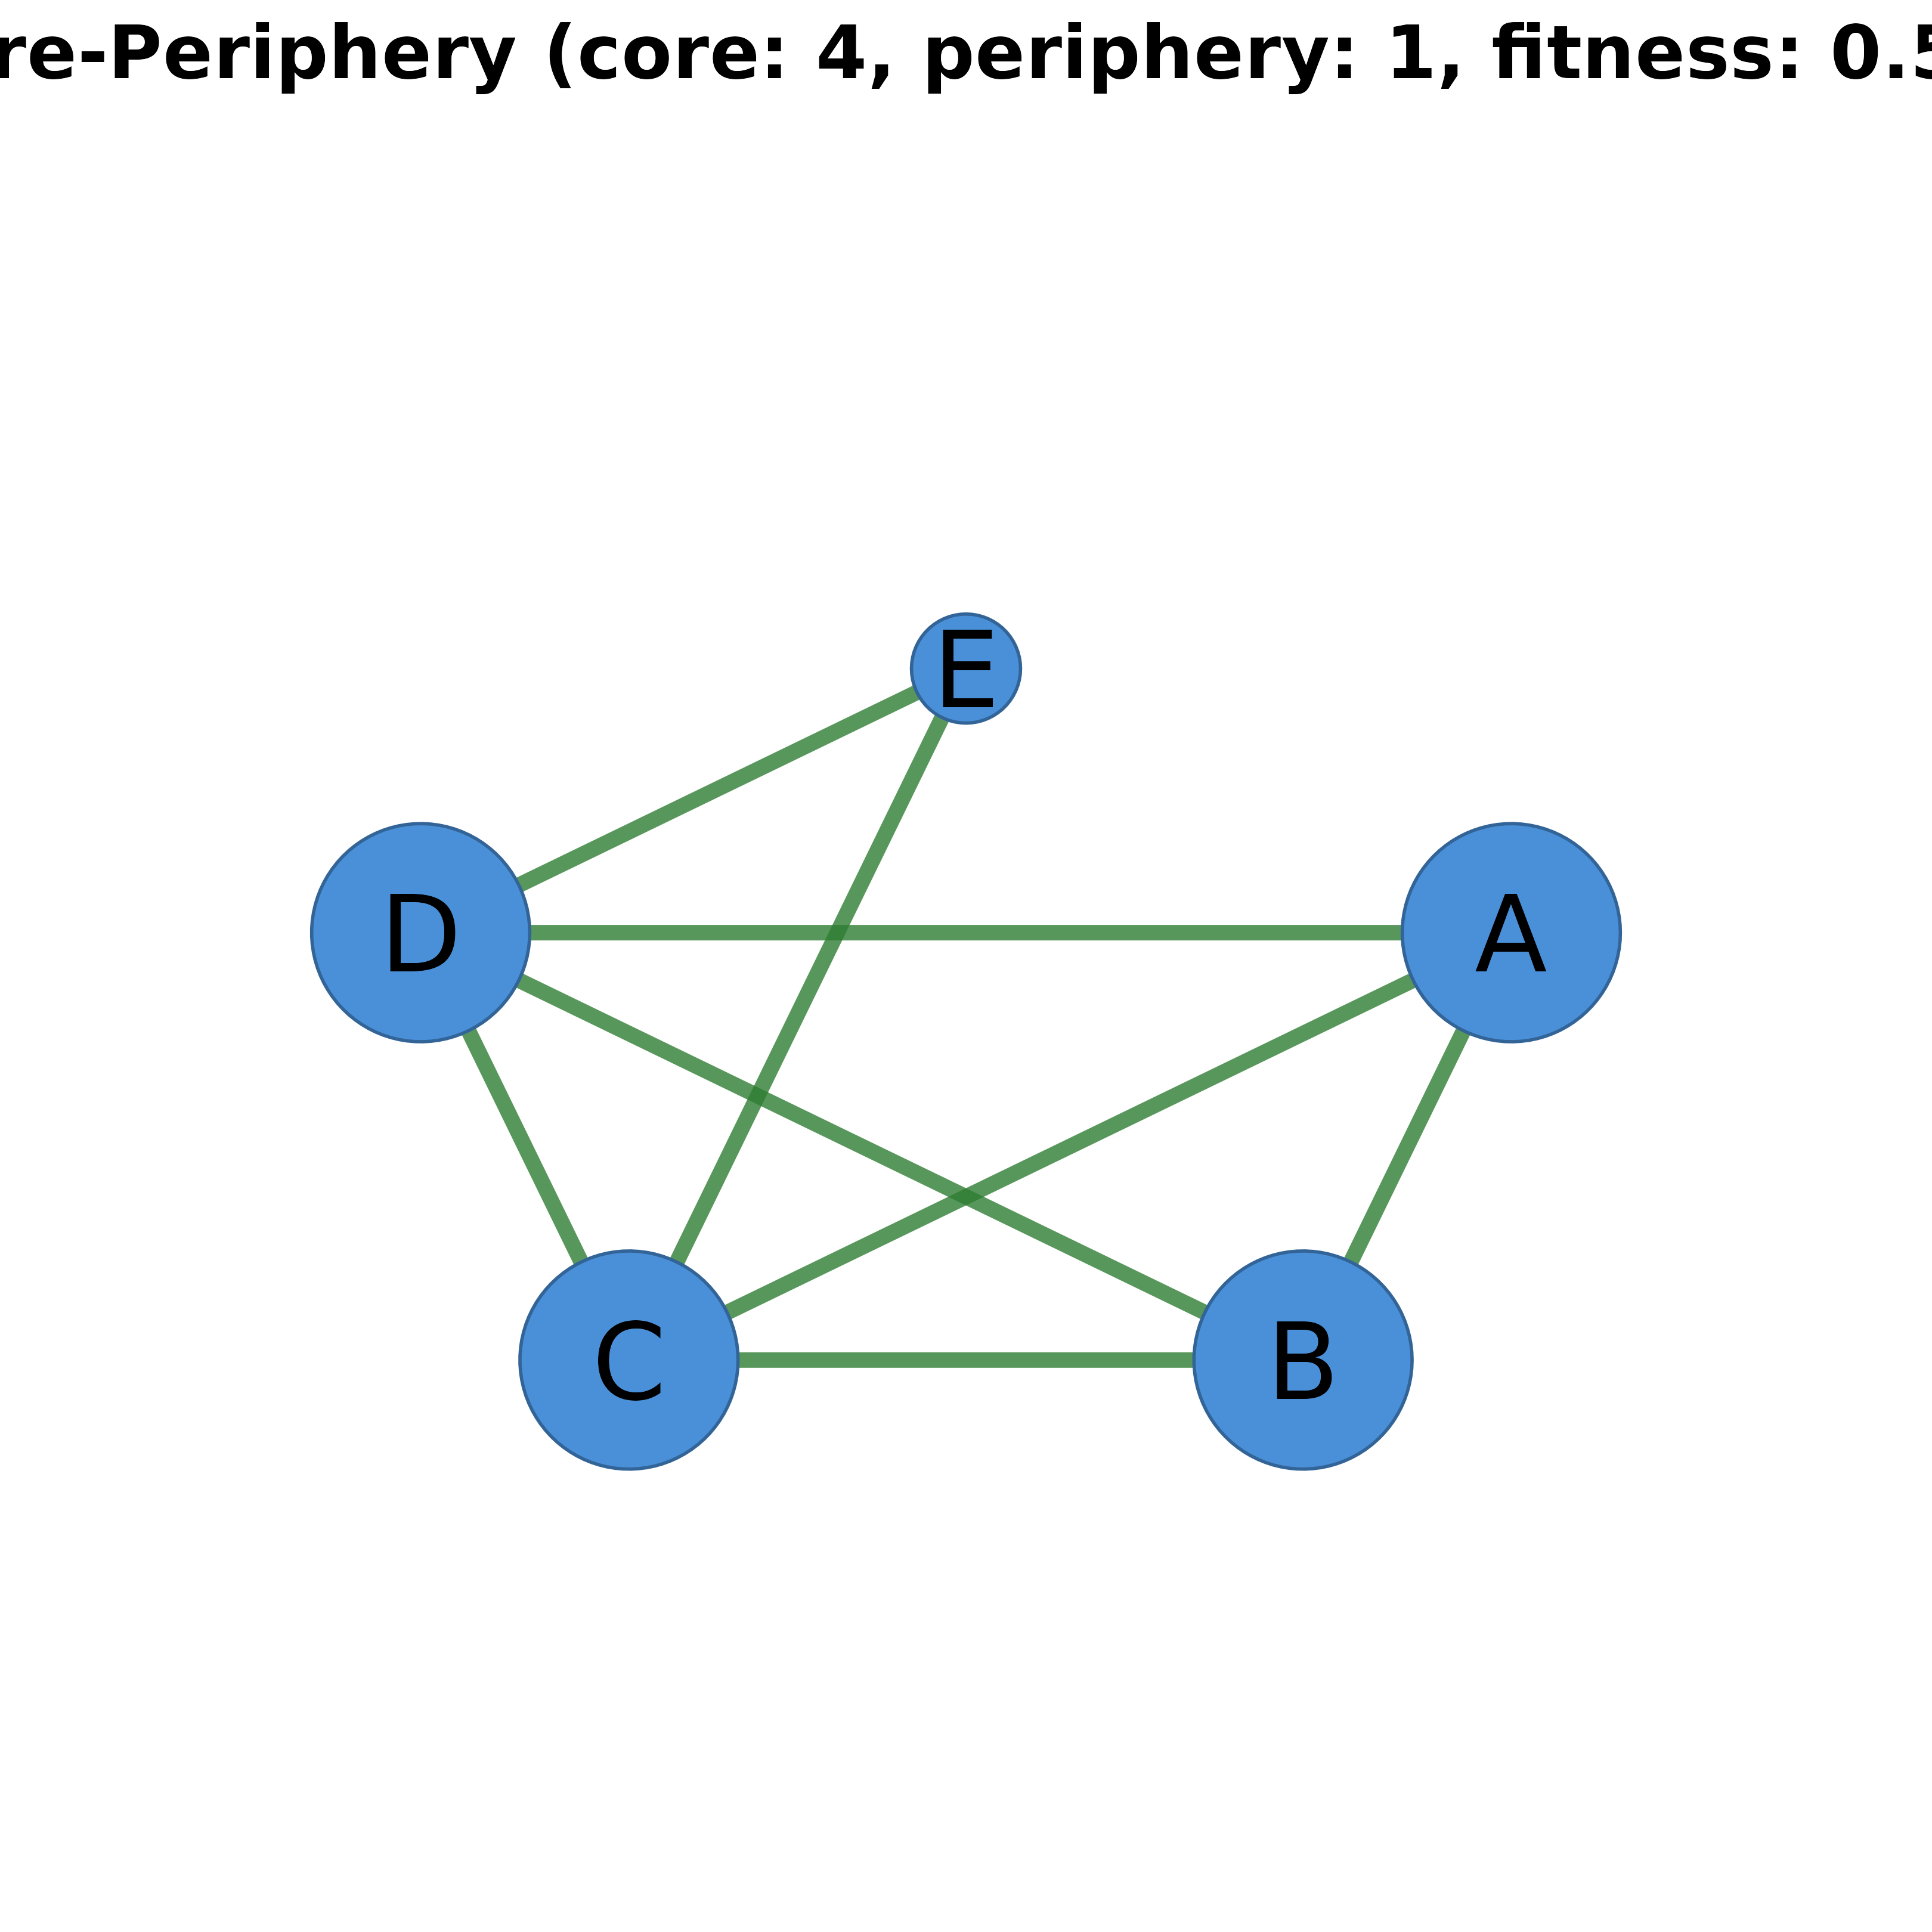
Visualizes the network with core nodes highlighted (larger, red) and periphery nodes de-emphasized (smaller, blue).
Usage
# S3 method for class 'cograph_core_periphery'
plot(
  x,
  core_color = "#E41A1C",
  periphery_color = "#377EB8",
  core_size = 12,
  periphery_size = 6,
  ...
)
Arguments
- x
A
cograph_core_peripheryobject fromcore_periphery.- core_color
Color for core nodes. Default
"#E41A1C".- periphery_color
Color for periphery nodes. Default
"#377EB8".- core_size
Numeric size for core nodes. Default 12.
- periphery_size
Numeric size for periphery nodes. Default 6.
- ...
Additional arguments passed to
splot.