Plot Nestimate Bootstrap Results
Source:R/plot-bootstrap.R, R/plot-communities.R, R/plot-mlvar.R, and 3 more
splot.RdVisualizes net_bootstrap objects from the Nestimate package.
Mirrors splot.tna_bootstrap but adapts to Nestimate's field layout:
weights live under $original$weights, directed is not always TRUE,
and there are no donut/inits.
Plots the original tna model with nodes colored by community membership.
The original model is retrieved from attr(x, "tna"), which
tna::communities() sets automatically. Uses walktrap if
present in x$assignments; otherwise falls back to the first
available algorithm column.
Plots the original network with nodes colored by community membership.
The network is retrieved from attr(x, "network"), which
detect_communities() / .wrap_communities() sets automatically.
Applies TNA-compatible styling defaults before delegating to splot():
directed networks get oval layout, coloured nodes, and sized arrows;
undirected networks get spring layout with no arrows or dashes.
All parameters can be overridden by the caller.
Visualizes boot_glasso objects from the Nestimate package.
Plots a partial-correlation network with edge inclusion probabilities
mapped to edge transparency.
Plot a wtna_mixed object either as a single overlaid network or as
two separate group panels.
Visualizes net_permutation objects from the Nestimate package.
Differs from plot_permutation: p_values and effect_size are already
p×p matrices (no edge-name parsing needed), and directed comes from
x$x$directed.
Network visualization using base R graphics (similar to qgraph).
Creates a network visualization using base R graphics functions (polygon, lines, xspline, etc.) instead of grid graphics. This provides better performance for large networks and uses the same snake_case parameter names as soplot() for consistency.
Usage
splot.net_bootstrap(
  x,
  display = c("styled", "significant", "full"),
  show_ci = FALSE,
  show_stars = TRUE,
  inherit_style = TRUE,
  ...
)

splot.tna_communities(x, ...)

splot.cograph_communities(x, ...)

splot.net_mlvar(x, type = "temporal", combined = TRUE, ...)

splot.netobject(x, ...)

splot.boot_glasso(
  x,
  use_thresholded = TRUE,
  show_inclusion = TRUE,
  inclusion_threshold = NULL,
  edge_positive_color = "#2E7D32",
  edge_negative_color = "#C62828",
  ...
)

splot.wtna_mixed(x, type = c("overlay", "group"), ...)

splot.net_permutation(
  x,
  show_nonsig = FALSE,
  show_effect = FALSE,
  edge_positive_color = "#009900",
  edge_negative_color = "#C62828",
  edge_nonsig_color = "#888888",
  edge_nonsig_style = 2L,
  show_stars = TRUE,
  ...
)

splot(
  x,
  layout = "oval",
  directed = NULL,
  seed = 42,
  theme = NULL,
  node_size = NULL,
  node_size2 = NULL,
  scale_nodes_by = NULL,
  node_size_range = c(2, 8),
  scale_nodes_scale = 1,
  node_shape = "circle",
  node_svg = NULL,
  svg_preserve_aspect = TRUE,
  node_fill = NULL,
  node_border_color = NULL,
  node_border_width = 1,
  node_alpha = 1,
  labels = TRUE,
  label_size = NULL,
  label_color = "black",
  label_position = "center",
  label_fontface = "plain",
  label_fontfamily = "sans",
  label_hjust = 0.5,
  label_vjust = 0.5,
  label_angle = 0,
  pie_values = NULL,
  pie_colors = NULL,
  pie_border_width = NULL,
  donut_fill = NULL,
  donut_values = NULL,
  donut_color = NULL,
  donut_colors = NULL,
  donut_border_color = NULL,
  donut_border_width = NULL,
  donut_inner_border_color = NULL,
  donut_inner_border_width = NULL,
  donut_outer_border_color = NULL,
  donut_line_type = "solid",
  donut_border_lty = NULL,
  donut_inner_ratio = 0.8,
  donut_bg_color = "gray90",
  donut_shape = "circle",
  donut_show_value = FALSE,
  donut_value_size = 0.8,
  donut_value_color = "black",
  donut_value_fontface = "bold",
  donut_value_fontfamily = "sans",
  donut_value_digits = 2,
  donut_value_prefix = "",
  donut_value_suffix = "",
  donut_empty = TRUE,
  donut2_values = NULL,
  donut2_colors = NULL,
  donut2_inner_ratio = 0.4,
  edge_color = NULL,
  edge_width = NULL,
  edge_size = NULL,
  esize = NULL,
  edge_width_range = c(0.1, 4),
  edge_scale_mode = "linear",
  edge_cutoff = NULL,
  cut = NULL,
  edge_alpha = 0.8,
  edge_labels = FALSE,
  edge_label_size = 0.8,
  edge_label_color = "gray30",
  edge_label_bg = NA,
  edge_label_position = 0.5,
  edge_label_offset = 0,
  edge_label_fontface = "plain",
  edge_label_shadow = FALSE,
  edge_label_shadow_color = "gray40",
  edge_label_shadow_offset = 0.5,
  edge_label_shadow_alpha = 0.5,
  edge_label_halo = TRUE,
  edge_style = 1,
  curvature = 0,
  curve_scale = TRUE,
  curve_shape = 0,
  curve_pivot = 0.5,
  curves = TRUE,
  arrow_size = 1,
  arrow_angle = pi/6,
  show_arrows = TRUE,
  bidirectional = FALSE,
  loop_rotation = NULL,
  show = NULL,
  edge_start_style = "solid",
  edge_start_length = 0.15,
  edge_start_dot_density = "12",
  edge_ci = NULL,
  edge_ci_scale = 2,
  edge_ci_alpha = 0.15,
  edge_ci_color = NA,
  edge_ci_style = 2,
  edge_ci_arrows = FALSE,
  edge_priority = NULL,
  edge_label_style = "none",
  edge_label_template = NULL,
  edge_label_digits = 2,
  edge_label_oneline = TRUE,
  edge_label_ci_format = "bracket",
  edge_label_leading_zero = TRUE,
  edge_ci_lower = NULL,
  edge_ci_upper = NULL,
  edge_label_p = NULL,
  edge_label_p_diff = NULL,
  edge_label_p_digits = 3,
  edge_label_p_prefix = "p=",
  edge_label_stars = NULL,
  weight_digits = 2,
  threshold = 0,
  minimum = 0,
  maximum = NULL,
  edge_positive_color = "#2E7D32",
  positive_color = NULL,
  edge_negative_color = "#C62828",
  negative_color = NULL,
  edge_duplicates = NULL,
  title = NULL,
  title_size = 1.2,
  margins = c(0.1, 0.1, 0.1, 0.1),
  background = "white",
  rescale = TRUE,
  layout_scale = 1,
  layout_margin = 0.15,
  aspect = TRUE,
  use_pch = FALSE,
  usePCH = NULL,
  scaling = "default",
  align_panels = FALSE,
  legend = FALSE,
  legend_position = "topright",
  legend_size = 0.8,
  legend_edge_colors = TRUE,
  legend_node_sizes = FALSE,
  groups = NULL,
  node_names = NULL,
  tna_styling = NULL,
  psych_styling = NULL,
  predictability = NULL,
  i = NULL,
  filetype = "default",
  filename = file.path(tempdir(), "splot"),
  width = 7,
  height = 7,
  res = 600,
  ...
)
Arguments
- x
Network input. Can be:
A square numeric matrix (adjacency/weight matrix)
A data frame with edge list (from, to, optional weight columns)
An igraph object
A CographNetwork or cograph_network object
A tna object (from tna package)
A group_tna object (list of tna objects from tna package). Use parameter
ito select a specific group, or omit to plot all groups.
- display
Display mode:
"styled"(default),"significant", or"full".- show_ci
Logical: overlay CI bounds on edge labels? Default FALSE.
- show_stars
Logical: show significance stars? Default TRUE.
- inherit_style
Logical: inherit labels/layout/colors from network? Default TRUE.
- ...
Additional arguments passed to layout functions. One ride-along worth calling out:
combined(defaultTRUE). Whenxis a multi-panel input (agroup_tna,group_tna_bootstrap,group_tna_permutation,net_permutation_group, or any class routed to asplot.*method that draws multiple panels such assplot.net_mlvarwithtype = "all"),combined = FALSEskips the internalgraphics::par(mfrow = ...)grid so the caller can drive layout explicitly viapanel_layout()orgraphics::layout(). For single-network inputs (a singletna,netobject, matrix, etc.)combinedhas no effect — there is no panel grid to gate.- type
Character.
"overlay"(default) renders both networks on a single canvas viaplot_mixed_network— co-occurrence as straight undirected edges, transitions as curved directed arrows."group"plots each component as a separate panel.- combined
Logical: when
type = "all", controls whether the three panels are arranged in an internal 1 x 3 grid (TRUE, default) or drawn into a layout the caller has already configured (FALSE — pair withpanel_layout()). Ignored for single-network types.- use_thresholded
Logical: use
$thresholded_pcor? If FALSE, uses$original_pcor. Default TRUE.- show_inclusion
Logical: scale edge alpha by inclusion probability? Default TRUE.
- inclusion_threshold
Numeric: minimum inclusion probability to show an edge. Default
1 - x$alpha(i.e. the complement of the alpha level).- edge_positive_color
Color for positive weights.
- edge_negative_color
Color for negative weights.
- show_nonsig
Logical: show non-significant edges? Default FALSE.
- show_effect
Logical: show effect size in parentheses? Default FALSE.
- edge_nonsig_color
Color for non-significant edges. Default
"#888888".- edge_nonsig_style
Line style for non-significant edges. Default 2L.
- layout
Layout algorithm: "oval" (default), "circle", "spring", "groups", "target" (qgraph-style focal-node BFS levels; node of interest via
target), "saqr" (Start/End transition flow;start/end/jitter), or a matrix of x,y coordinates, or an igraph layout function. Also supports igraph two-letter codes: "kk", "fr", "drl", "mds", "ni", etc.- directed
Logical. Force directed interpretation. NULL for auto-detect.
- seed
Random seed for deterministic layouts. Default 42.
- theme
Theme name: "classic", "dark", "minimal", "colorblind", etc.
- node_size
Node size(s). Single value or vector. Default NULL, which resolves to 7 with default scaling.
- node_size2
Secondary node size for ellipse/rectangle height.
- scale_nodes_by
Scale node sizes by a centrality measure. Can be:
A measure name: "degree", "strength", "betweenness", "closeness", "eigenvector", "pagerank", "authority", "hub", "harmonic", etc.
A directional shorthand: "indegree", "outdegree", "instrength", "outstrength", "incloseness", "outcloseness", "inharmonic", "outharmonic", "ineccentricity", "outeccentricity".
A list with measure and parameters: list("pagerank", damping = 0.9)
When used, node_size is ignored. Use node_size_range to control the min/max size. Default NULL (no centrality scaling).
- node_size_range
Size range for centrality-based scaling. Numeric vector c(min_size, max_size). Default c(2, 8).
- scale_nodes_scale
Dampening exponent for centrality-based sizing. Values < 1 compress differences (e.g., 0.5 applies square root), values > 1 exaggerate differences. Default 1 (linear).
- node_shape
Node shape(s): "circle", "square", "triangle", "diamond", "pentagon", "hexagon", "star", "heart", "ellipse", "cross", or any custom SVG shape registered with register_svg_shape().
- node_svg
Custom SVG for nodes: path to SVG file OR inline SVG string.
- svg_preserve_aspect
Logical: maintain SVG aspect ratio? Default TRUE.
- node_fill
Node fill color(s).
- node_border_color
Node border color(s).
- node_border_width
Node border width(s).
- node_alpha
Node transparency (0-1). Default 1.
- labels
Node labels: TRUE (use node names/indices), FALSE (none), or character vector.
- label_size
Label character expansion factor.
- label_color
Label text color.
- label_position
Label position: "center", "above", "below", "left", "right".
- label_fontface
Font face for labels: "plain", "bold", "italic", "bold.italic". Default "plain".
- label_fontfamily
Font family for labels: "sans", "serif", "mono". Default "sans".
- label_hjust
Horizontal justification (0=left, 0.5=center, 1=right). Default 0.5.
- label_vjust
Vertical justification (0=bottom, 0.5=center, 1=top). Default 0.5.
- label_angle
Text rotation angle in degrees. Default 0.
- pie_values
List of numeric vectors for pie chart nodes. Each element corresponds to a node and contains values for pie segments. If a simple numeric vector with values between 0 and 1 is provided (e.g., centrality scores), it is automatically converted to donut_fill for convenience.
- pie_colors
List of color vectors for pie segments.
- pie_border_width
Border width for pie slice dividers. NULL uses node_border_width.
- donut_fill
Numeric value (0-1) for donut fill proportion. This is the qgraph-style API: 0.1 = 10% filled, 0.5 = 50% filled, 1.0 = fully filled. Can be a single value (all nodes) or vector (per-node values).
- donut_values
Deprecated. Use donut_fill for simple fill proportion.
- donut_color
Fill color(s) for the donut ring. Single color sets fill for all nodes. Two colors set fill and background for all nodes. More than 2 colors set per-node fill colors (recycled to n_nodes). Default: "maroon" fill, "gray90" background when node_shape="donut".
- donut_colors
Deprecated. Use donut_color instead.
- donut_border_color
Border color for donut rings. NULL uses node_border_color.
- donut_border_width
Border width for donut rings. NULL uses node_border_width.
- donut_inner_border_color
Color for the inner boundary (where the donut meets its hole). NULL (default) uses
donut_border_color. Can be scalar or per-node vector.- donut_inner_border_width
Width for the inner boundary border. NULL (default) uses
donut_border_width. Can be scalar or per-node vector.- donut_outer_border_color
Color for outer boundary border (enables double border). NULL (default) shows single border. Set to a color for double border effect. Can be scalar or per-node vector.
- donut_line_type
Line type for donut borders: "solid", "dashed", "dotted", or numeric (1=solid, 2=dashed, 3=dotted). Can be scalar or per-node vector.
- donut_border_lty
Deprecated. Use
donut_line_typeinstead.- donut_inner_ratio
Inner radius ratio for donut (0-1). Default 0.8.
- donut_bg_color
Background color for unfilled donut portion.
- donut_shape
Base shape for donut: "circle", "square", "hexagon", "triangle", "diamond", "pentagon". Can be a single value or per-node vector. Default inherits from node_shape (e.g., hexagon nodes get hexagon donuts). Set explicitly to override (e.g., donut_shape = "hexagon" for hexagon donuts on all nodes regardless of node_shape).
- donut_show_value
Logical: show value in donut center? Default FALSE.
- donut_value_size
Font size for donut center value.
- donut_value_color
Color for donut center value.
- donut_value_fontface
Font face for donut center value: "plain", "bold", "italic", "bold.italic". Default "bold".
- donut_value_fontfamily
Font family for donut center value: "sans", "serif", "mono". Default "sans".
- donut_value_digits
Decimal places for donut center value. Default 2.
- donut_value_prefix
Text before donut center value (e.g., "$"). Default "".
- donut_value_suffix
Text after donut center value (e.g., "%"). Default "".
- donut_empty
Logical: render empty donut rings for NA values? Default TRUE.
- donut2_values
List of values for inner donut ring (for double donut).
- donut2_colors
List of color vectors for inner donut ring segments.
- donut2_inner_ratio
Inner radius ratio for inner donut ring. Default 0.4.
- edge_color
Edge color(s). If NULL, uses edge_positive_color/edge_negative_color based on weight.
- edge_width
Edge width(s). If NULL, scales by weight using edge_size and edge_width_range.
- edge_size
Maximum edge size for weight scaling. NULL (default) uses the upper bound of
edge_width_range. Larger values = thicker edges overall.- esize
Deprecated. Use
edge_sizeinstead.- edge_width_range
Output width range as c(min, max) for weight-based scaling. Default c(0.1, 4). Edges are scaled to fit within this range unless
edge_sizesupplies the maximum.- edge_scale_mode
Scaling mode for edge weights: "linear" (default, qgraph-style), "log" (logarithmic for wide weight ranges), "sqrt" (moderate compression), or "rank" (equal visual spacing regardless of weight distribution).
- edge_cutoff
Optional cutoff for edge emphasis. NULL (default) or 0 disables cutoff fading. Positive values fade edges whose absolute weights are below the cutoff; width scaling remains continuous.
- cut
Deprecated. Use
edge_cutoffinstead.- edge_alpha
Edge transparency (0-1). Default 0.8.
- edge_labels
Edge labels: TRUE (show weights), FALSE (none), or character vector.
- edge_label_size
Edge label size.
- edge_label_color
Edge label text color.
- edge_label_bg
Edge label background color.
- edge_label_position
Position along edge (0-1).
- edge_label_offset
Perpendicular offset for edge labels (0 = on line, positive = above).
- edge_label_fontface
Font face: "plain", "bold", "italic", "bold.italic".
- edge_label_shadow
Logical: enable drop shadow for edge labels? Default FALSE.
- edge_label_shadow_color
Color for edge label shadow. Default "gray40".
- edge_label_shadow_offset
Offset distance for shadow in points. Default 0.5.
- edge_label_shadow_alpha
Transparency for shadow (0-1). Default 0.5.
- edge_label_halo
Logical: enable white halo/outline around edge labels for readability over dark edges? Default TRUE. When TRUE, overrides shadow settings.
- edge_style
Line type(s): 1=solid, 2=dashed, 3=dotted, etc.
- curvature
Edge curvature. 0 for straight, positive/negative for curves.
- curve_scale
Reserved for future curve scaling; currently not used.
- curve_shape
Spline tension (-1 to 1). Default 0.
- curve_pivot
Position along edge for curve control point (0-1).
- curves
Curve mode: TRUE (default) = single edges straight, reciprocal edges curve as ellipse (two opposing curves); FALSE = all straight; "force" = all curved.
- arrow_size
Arrow head size.
- arrow_angle
Arrow head angle in radians. Default pi/6 (30 degrees).
- show_arrows
Logical or vector: show arrows on directed edges?
- bidirectional
Logical or vector: show arrows at both ends?
- loop_rotation
Angle(s) in radians for self-loop direction.
- show
Dispatch-only placeholder used by method dispatch (e.g.,
splot.tna_disparity). Not intended for direct use.- edge_start_style
Style for the start segment of edges: "solid" (default), "dashed", or "dotted". Use dashed/dotted to indicate edge direction (source node).
- edge_start_length
Fraction of edge length for the styled start segment (0-0.5). Default 0.15 (15% of edge). Only applies when edge_start_style is not "solid".
- edge_start_dot_density
Pattern for dotted start segments. A two-character string where the first digit is dot length and second is gap length (in line width units). Default "12" (1 unit dot, 2 units gap). Use "11" for tighter dots, "13" for more spacing. Only applies when edge_start_style = "dotted".
- edge_ci
Numeric vector of CI widths (0-1 scale). Larger values = more uncertainty.
- edge_ci_scale
Width multiplier for underlay thickness. Default 2.
- edge_ci_alpha
Transparency for underlay (0-1). Default 0.15.
- edge_ci_color
Underlay color. NA (default) uses main edge color.
- edge_ci_style
Line type for underlay: 1=solid, 2=dashed, 3=dotted. Default 2.
- edge_ci_arrows
Logical: show arrows on underlay? Default FALSE.
- edge_priority
Numeric vector of edge priorities. Higher values render on top. Useful for ensuring significant edges appear above non-significant ones.
- edge_label_style
Preset style: "none", "estimate", "full", "range", "stars".
- edge_label_template
Template with placeholders: {est}, {range}, {low}, {up}, {p}, {p_diff}, {stars}. Overrides edge_label_style if provided.
- edge_label_digits
Decimal places for estimates. Default 2.
- edge_label_oneline
Logical: single line format? Default TRUE.
- edge_label_ci_format
CI format: "bracket" for
[low, up]or "dash" forlow-up.- edge_label_leading_zero
Logical: show leading zero for values < 1? Default TRUE. Set to FALSE to display ".5" instead of "0.5".
- edge_ci_lower
Numeric vector of lower CI bounds for labels.
- edge_ci_upper
Numeric vector of upper CI bounds for labels.
- edge_label_p
Numeric vector of p-values for edges.
- edge_label_p_diff
Probability-of-difference values for the
{p_diff}template placeholder: a per-edge numeric vector, or a full node-by-node matrix (indexed at each drawn edge automatically — the safe form whenminimum/thresholdfilter edges). A matrix with dimnames is aligned to the plot's node names, so it may be supplied in any node order.- edge_label_p_digits
Decimal places for p-values. Default 3.
- edge_label_p_prefix
Prefix for p-values. Default "p=".
- edge_label_stars
Stars for labels: character vector, TRUE (compute from p), or numeric (treated as p-values).
- weight_digits
Number of decimal places to round edge weights to before plotting. Edges that round to zero are automatically removed. Default 2. Set NULL to disable rounding.
- threshold
Minimum absolute weight to display.
- minimum
Alias for threshold (qgraph compatibility). Uses max of threshold and minimum.
- maximum
Maximum weight for scaling. NULL for auto.
- positive_color
Deprecated. Use
edge_positive_colorinstead.- negative_color
Deprecated. Use
edge_negative_colorinstead.- edge_duplicates
How to handle duplicate edges in undirected networks. NULL (default) = stop with error listing duplicates. Options: "sum", "mean", "first", "max", "min", or a custom aggregation function.
- title
Plot title.
- title_size
Title font size.
- margins
Margins as c(bottom, left, top, right).
- background
Background color.
- rescale
Logical: rescale layout to -1 to 1 range?
- layout_scale
Scale factor for layout. >1 expands (spreads nodes apart), <1 contracts (brings nodes closer). Use "auto" to automatically scale based on node count (compact for small networks, expanded for large). Default 1.
- layout_margin
Margin around the layout as fraction of range. Default 0.15. Set to 0 for no extra margin (tighter fit). Affects white space around nodes.
- aspect
Logical: maintain aspect ratio?
- use_pch
Logical: use points() for simple circles (faster). Default FALSE.
- usePCH
Deprecated. Use
use_pchinstead.- scaling
Scaling mode: "default" for qgraph-matched scaling where node_size=6 looks similar to qgraph vsize=6, or "legacy" to preserve pre-v2.0 behavior.
- align_panels
Logical. If
TRUE, forces a uniform symmetric plot box (c(-layout_scale, layout_scale)on each axis) so two networks plotted side-by-side in apar(mfrow)grid render at identical absolute scales — useful for bootstrap panels, comparison grids with networks of different node counts, or any case where visual-size parity across panels matters more than canvas fill. DefaultFALSEuses dynamic, layout-driven bounds (the pre-2.1.x behaviour) which renders tighter on the canvas. The per-node loop-reservation pad incompute_plot_limitsruns regardless, so networks with different self-loop patterns stay centered consistently in either mode.- legend
Logical: show legend?
- legend_position
Position: "topright", "topleft", "bottomright", "bottomleft".
- legend_size
Legend text size.
- legend_edge_colors
Logical: show positive/negative edge colors in legend?
- legend_node_sizes
Logical: show node size scale in legend?
- groups
Group assignments for node coloring/legend.
- node_names
Alternative names for legend (separate from labels).
- tna_styling
Logical or NULL. If
TRUE, applies TNA visual defaults (oval layout, TNA color palette, edge labels as estimates, dotted edge starts, etc.) as a base layer. Any explicitly provided argument overrides the TNA default. IfFALSE, no TNA styling is applied. IfNULL(default), automatically set toTRUEwhenxis a tna object,FALSEotherwise. Can be used with any input type (matrix, igraph, cograph_network).- psych_styling
Logical or NULL. Undirected counterpart of
tna_styling. IfTRUE, applies psychometric-network defaults (spring layout, Okabe-Ito palette, no arrows, thin edges) as a base layer. IfNULL(default),splot.netobjectauto-enables it on correlation-family input (glasso, cor, pcor, ising) and on the undirected constituents ofnet_mlvar. Explicit user args always win.- predictability
Logical or NULL. Draws a per-node predictability ring (a donut fill) from a
predictabilitycolumn on the network's node table, the wayqgraph/bootnetshow node predictability. IfTRUE, draws it when the column is present; ifFALSE, never; ifNULL(default), draws it when the object marks it as its default (network$meta$predictability_default, set e.g. by apsychnetglasso network). A caller's ownpie_values/donut_filltakes precedence.- i
Group index or name when x is a group_tna object. If NULL (default), plots all groups in a grid. If specified (e.g., i = 1 or i = "Treatment"), plots only that group.
- filetype
Output format: "default" (screen), "png", "pdf", "svg", "jpeg", "tiff".
- filename
Output filename (without extension).
- width
Output width in inches.
- height
Output height in inches.
- res
Resolution in DPI for raster outputs (PNG, JPEG, TIFF). Default 600.
Value
Invisibly returns the plot.
Invisibly, the splot result.
Invisibly, the splot result.
Invisibly returns x.
Invisibly returns the plot.
Invisibly returns the plot.
Invisibly returns x.
Invisibly returns the plot.
Invisibly returns the cograph_network object.
Details
Edge Curve Behavior
Edge curving is controlled by three parameters that interact:
- curves
Mode for automatic curving.
FALSE= all straight,TRUE(default) = curve only reciprocal edge pairs as an ellipse,"force"= curve all edges inward toward network center.- curvature
Manual curvature amount (0-1 typical). Sets the magnitude of curves. Default 0 uses automatic 0.175 for curved edges. Positive values curve edges; the direction is automatically determined.
- curve_scale
Not currently used; reserved for future scaling.
For reciprocal edges (A->B and B->A both exist), the edges curve
in opposite directions to form a visual ellipse, making bidirectional
relationships clear.
Weight Scaling Modes (edge_scale_mode)
Controls how edge weights are mapped to visual widths:
- linear (default)
Width proportional to weight. Best when weights are similar in magnitude.
- log
Logarithmic scaling. Best when weights span multiple orders of magnitude (e.g., 0.01 to 100).
- sqrt
Square root scaling. Moderate compression, good for moderately skewed distributions.
- rank
Rank-based scaling. Ignores actual values; uses relative ordering. All edges get equal visual spacing regardless of weight distribution.
Donut vs Pie vs Double Donut
Three ways to show additional data on nodes:
- Donut (donut_fill)
Single ring showing a proportion (0-1). Ideal for completion rates, probabilities, or any single metric per node. Use
donut_colorfor fill color anddonut_bg_colorfor unfilled portion.- Pie (pie_values)
Multiple colored segments showing category breakdown. Ideal for composition data. Values are normalized to sum to 1. Use
pie_colorsfor segment colors.- Double Donut (donut2_values)
Two concentric rings for comparing two metrics per node. Outer ring uses
donut_fill/donut_color, inner ring usesdonut2_values/donut2_colors.
CI Underlay System
Confidence interval underlays draw a wider, semi-transparent edge behind the main edge to visualize uncertainty:
- edge_ci
Vector of CI widths (0-1 scale). Larger = more uncertainty.
- edge_ci_scale
Multiplier for underlay width relative to main edge. Default 2 means underlay is twice as wide as main edge at CI=1.
- edge_ci_alpha
Transparency of underlay (0-1). Default 0.15.
- edge_ci_style
Line type: 1=solid, 2=dashed (default), 3=dotted.
Edge Label Templates
For statistical output, use templates to format complex labels:
- edge_label_template
Template string with placeholders:
{est}for estimate/weight,{low}/{up}for CI bounds,{range}for formatted range,{p}for p-value,{p_diff}for the probability of the difference (Bayesian comparisons),{stars}for significance stars.- edge_label_style
Preset styles:
"estimate"(weight only),"full"(estimate + CI),"range"(CI only),"stars"(significance).
Producer-Supplied splot Metadata
Packages that create cograph_network-compatible objects can attach a
small plotting contract at x$meta$splot. This lets producer packages
such as Nestimate, lagdynamics, or other modelling packages describe their
preferred cograph rendering without adding a new cograph-side class branch for
every object type.
The contract is optional. Objects without meta$splot follow the normal
splot() path and all existing class-specific dispatch remains in place.
When present, the supported fields are:
rendererCharacter scalar naming the cograph renderer to use.
"network"(also"splot","default", or"base") means the object follows the normalsplot()path — including any class-specific dispatch cograph already performs for it — with the metadata defaults applied. Other values are resolved through a cograph-maintained whitelist of existing renderers, for example"difference","bootstrap","permutation","stability","mlvar","netobject","netobject_group","netobject_ml","boot_glasso", and"wtna_mixed". Arbitrary function names are never evaluated.weightOptional character scalar naming the default edge weight to render. If it names an edge column, that column is copied to
edges$weightfor the plot (the producer's edge set is kept, and theweightsmatrix is rebuilt to match). If it names a matrix stored on the object, that matrix becomes the rendered network: it is copied toweightsand the drawn edge set is rebuilt from its nonzero cells (aligned to the object's node order via dimnames when present). This is useful when the analytical object stores several edge quantities (for example counts, probabilities, residuals, effects) but has one preferred plot view. When the name matches both an edge column and a stored matrix, the matrix form wins.defaultsNamed list of
splot()or renderer arguments. These are defaults only: any argument explicitly supplied by the user wins. Defaults can include regularsplot()arguments such aslayout,node_fill,edge_labels,weight_digits, or renderer-specific arguments such asdisplayfor bootstrap renderers.
The precedence rule is always:
user arguments > x$meta$splot$defaults > cograph defaults
Example producer-side metadata:
Examples
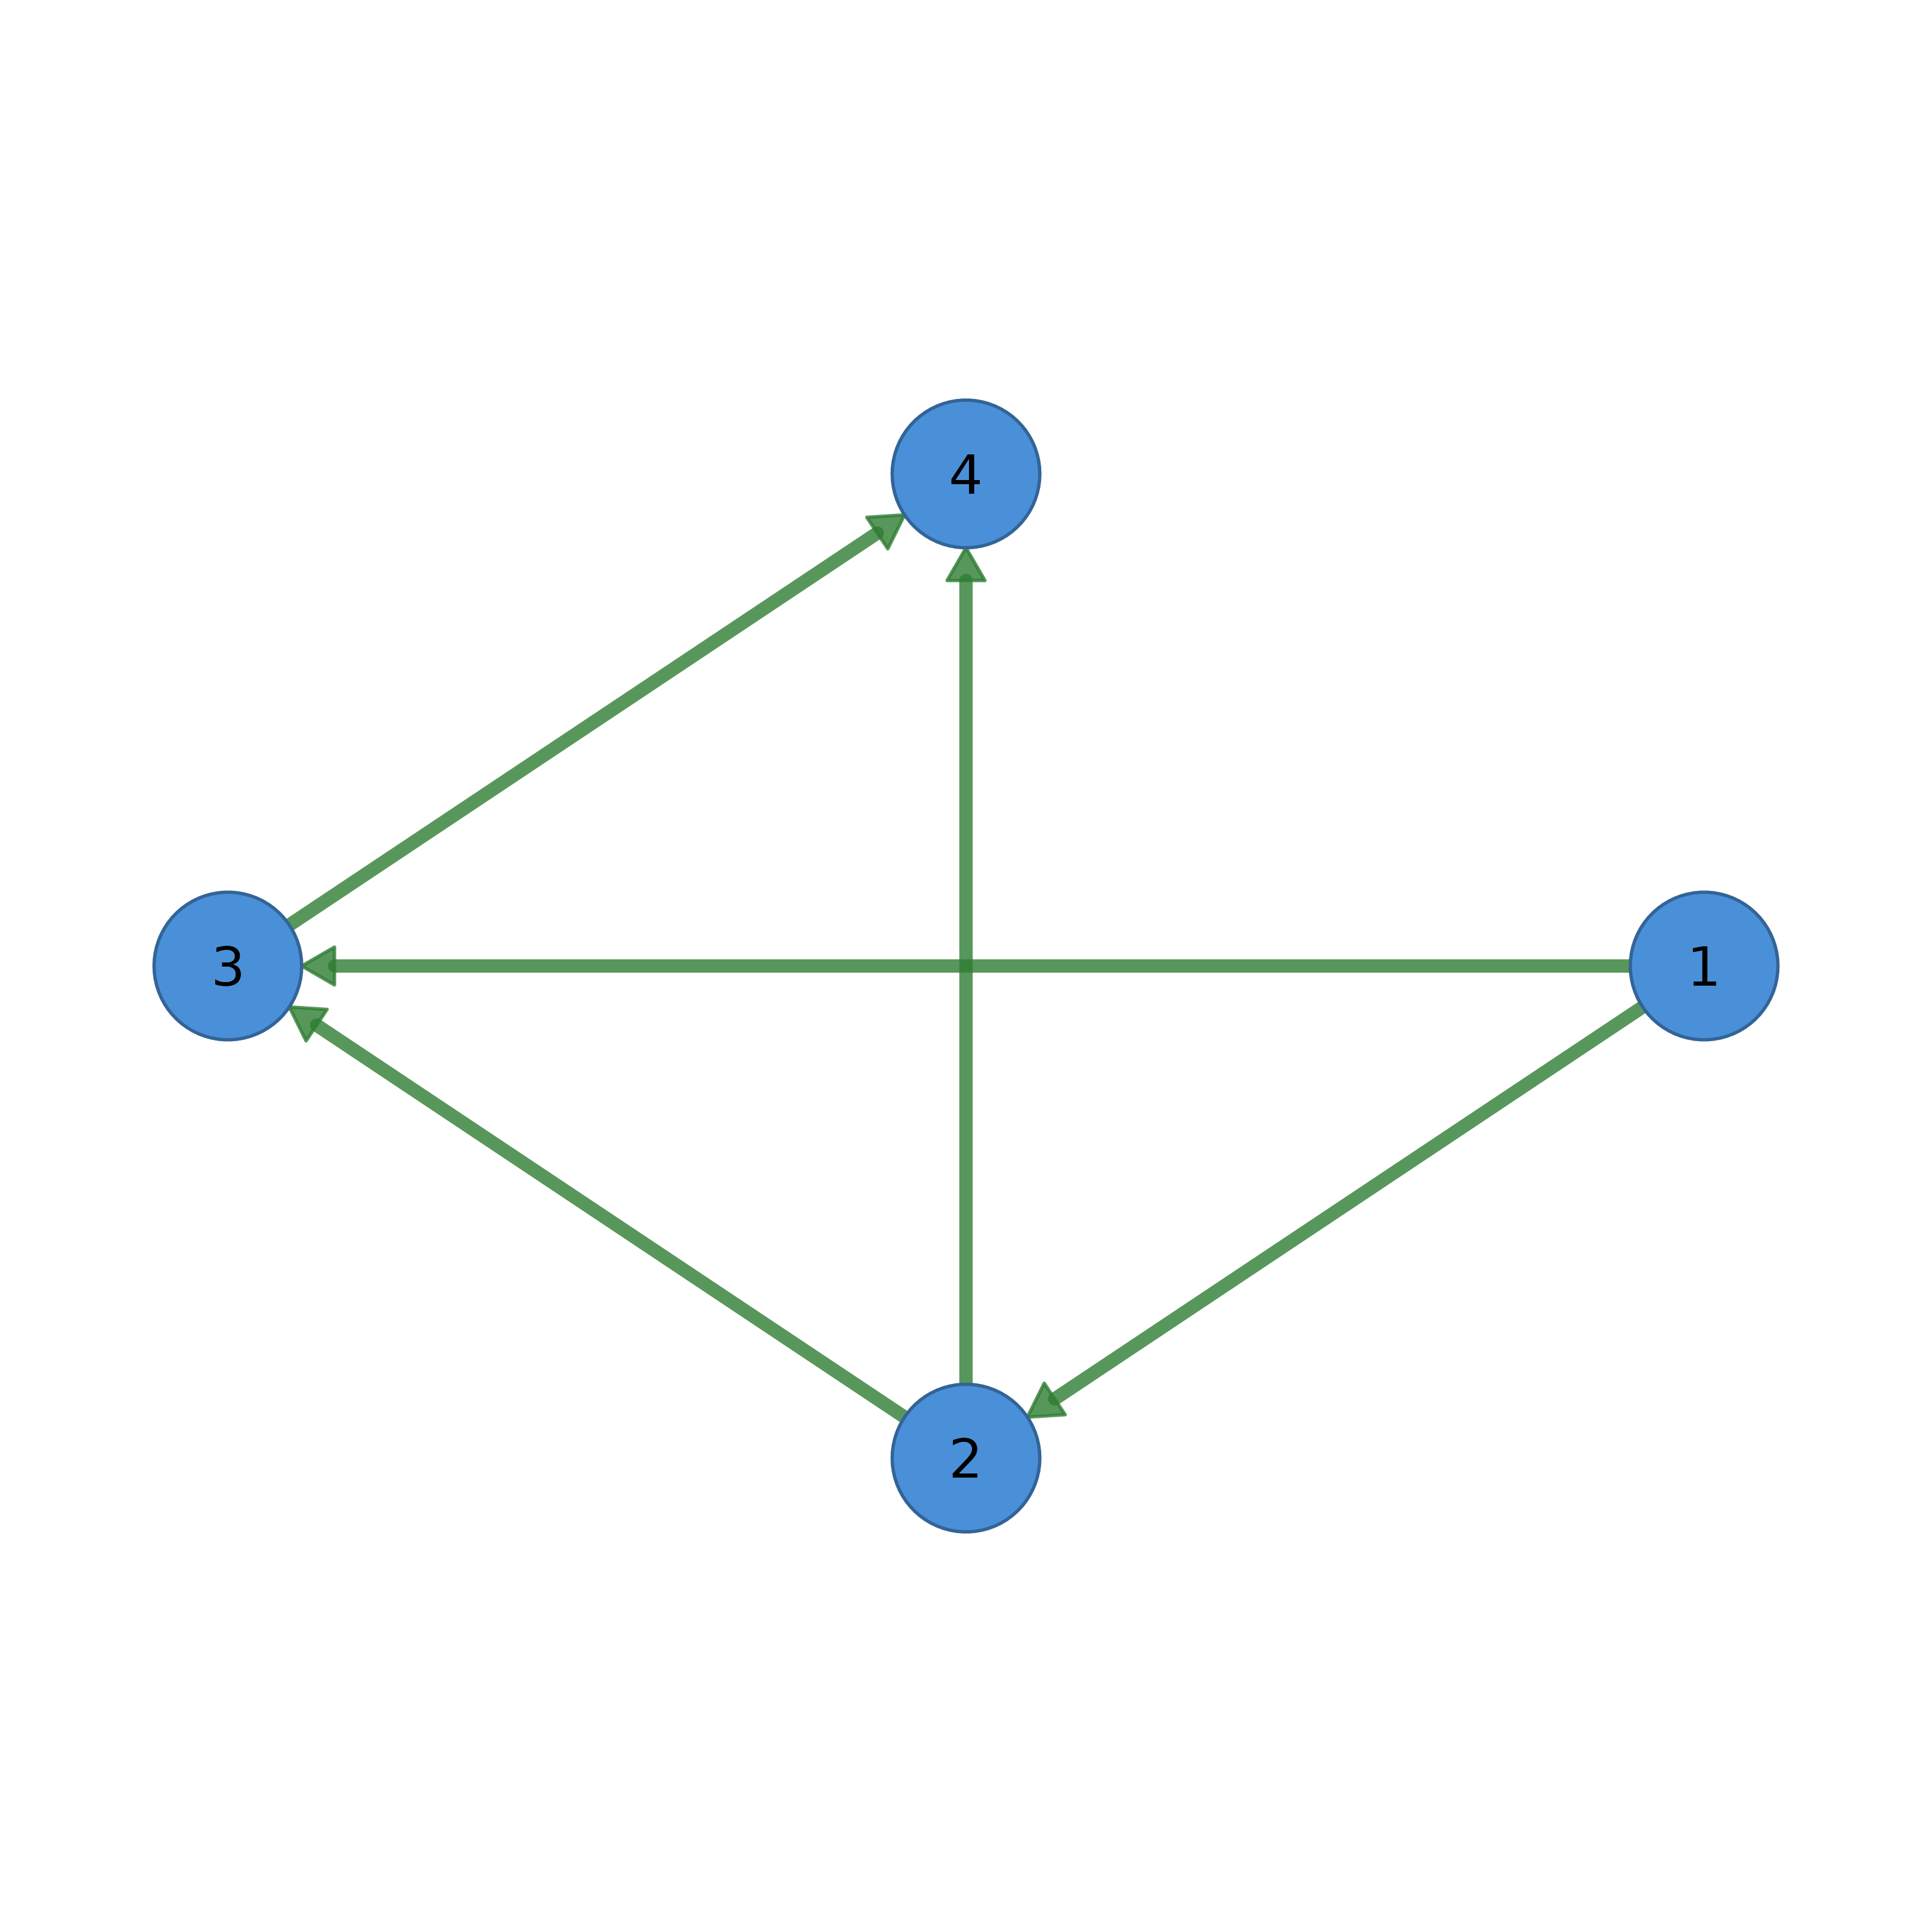
# Basic directed network
adj <- matrix(c(0, 1, 1, 0, 0, 0, 1, 1,
0, 0, 0, 1, 0, 0, 0, 0), 4, 4, byrow = TRUE)
splot(adj, layout = "circle", labels = c("A", "B", "C", "D"))
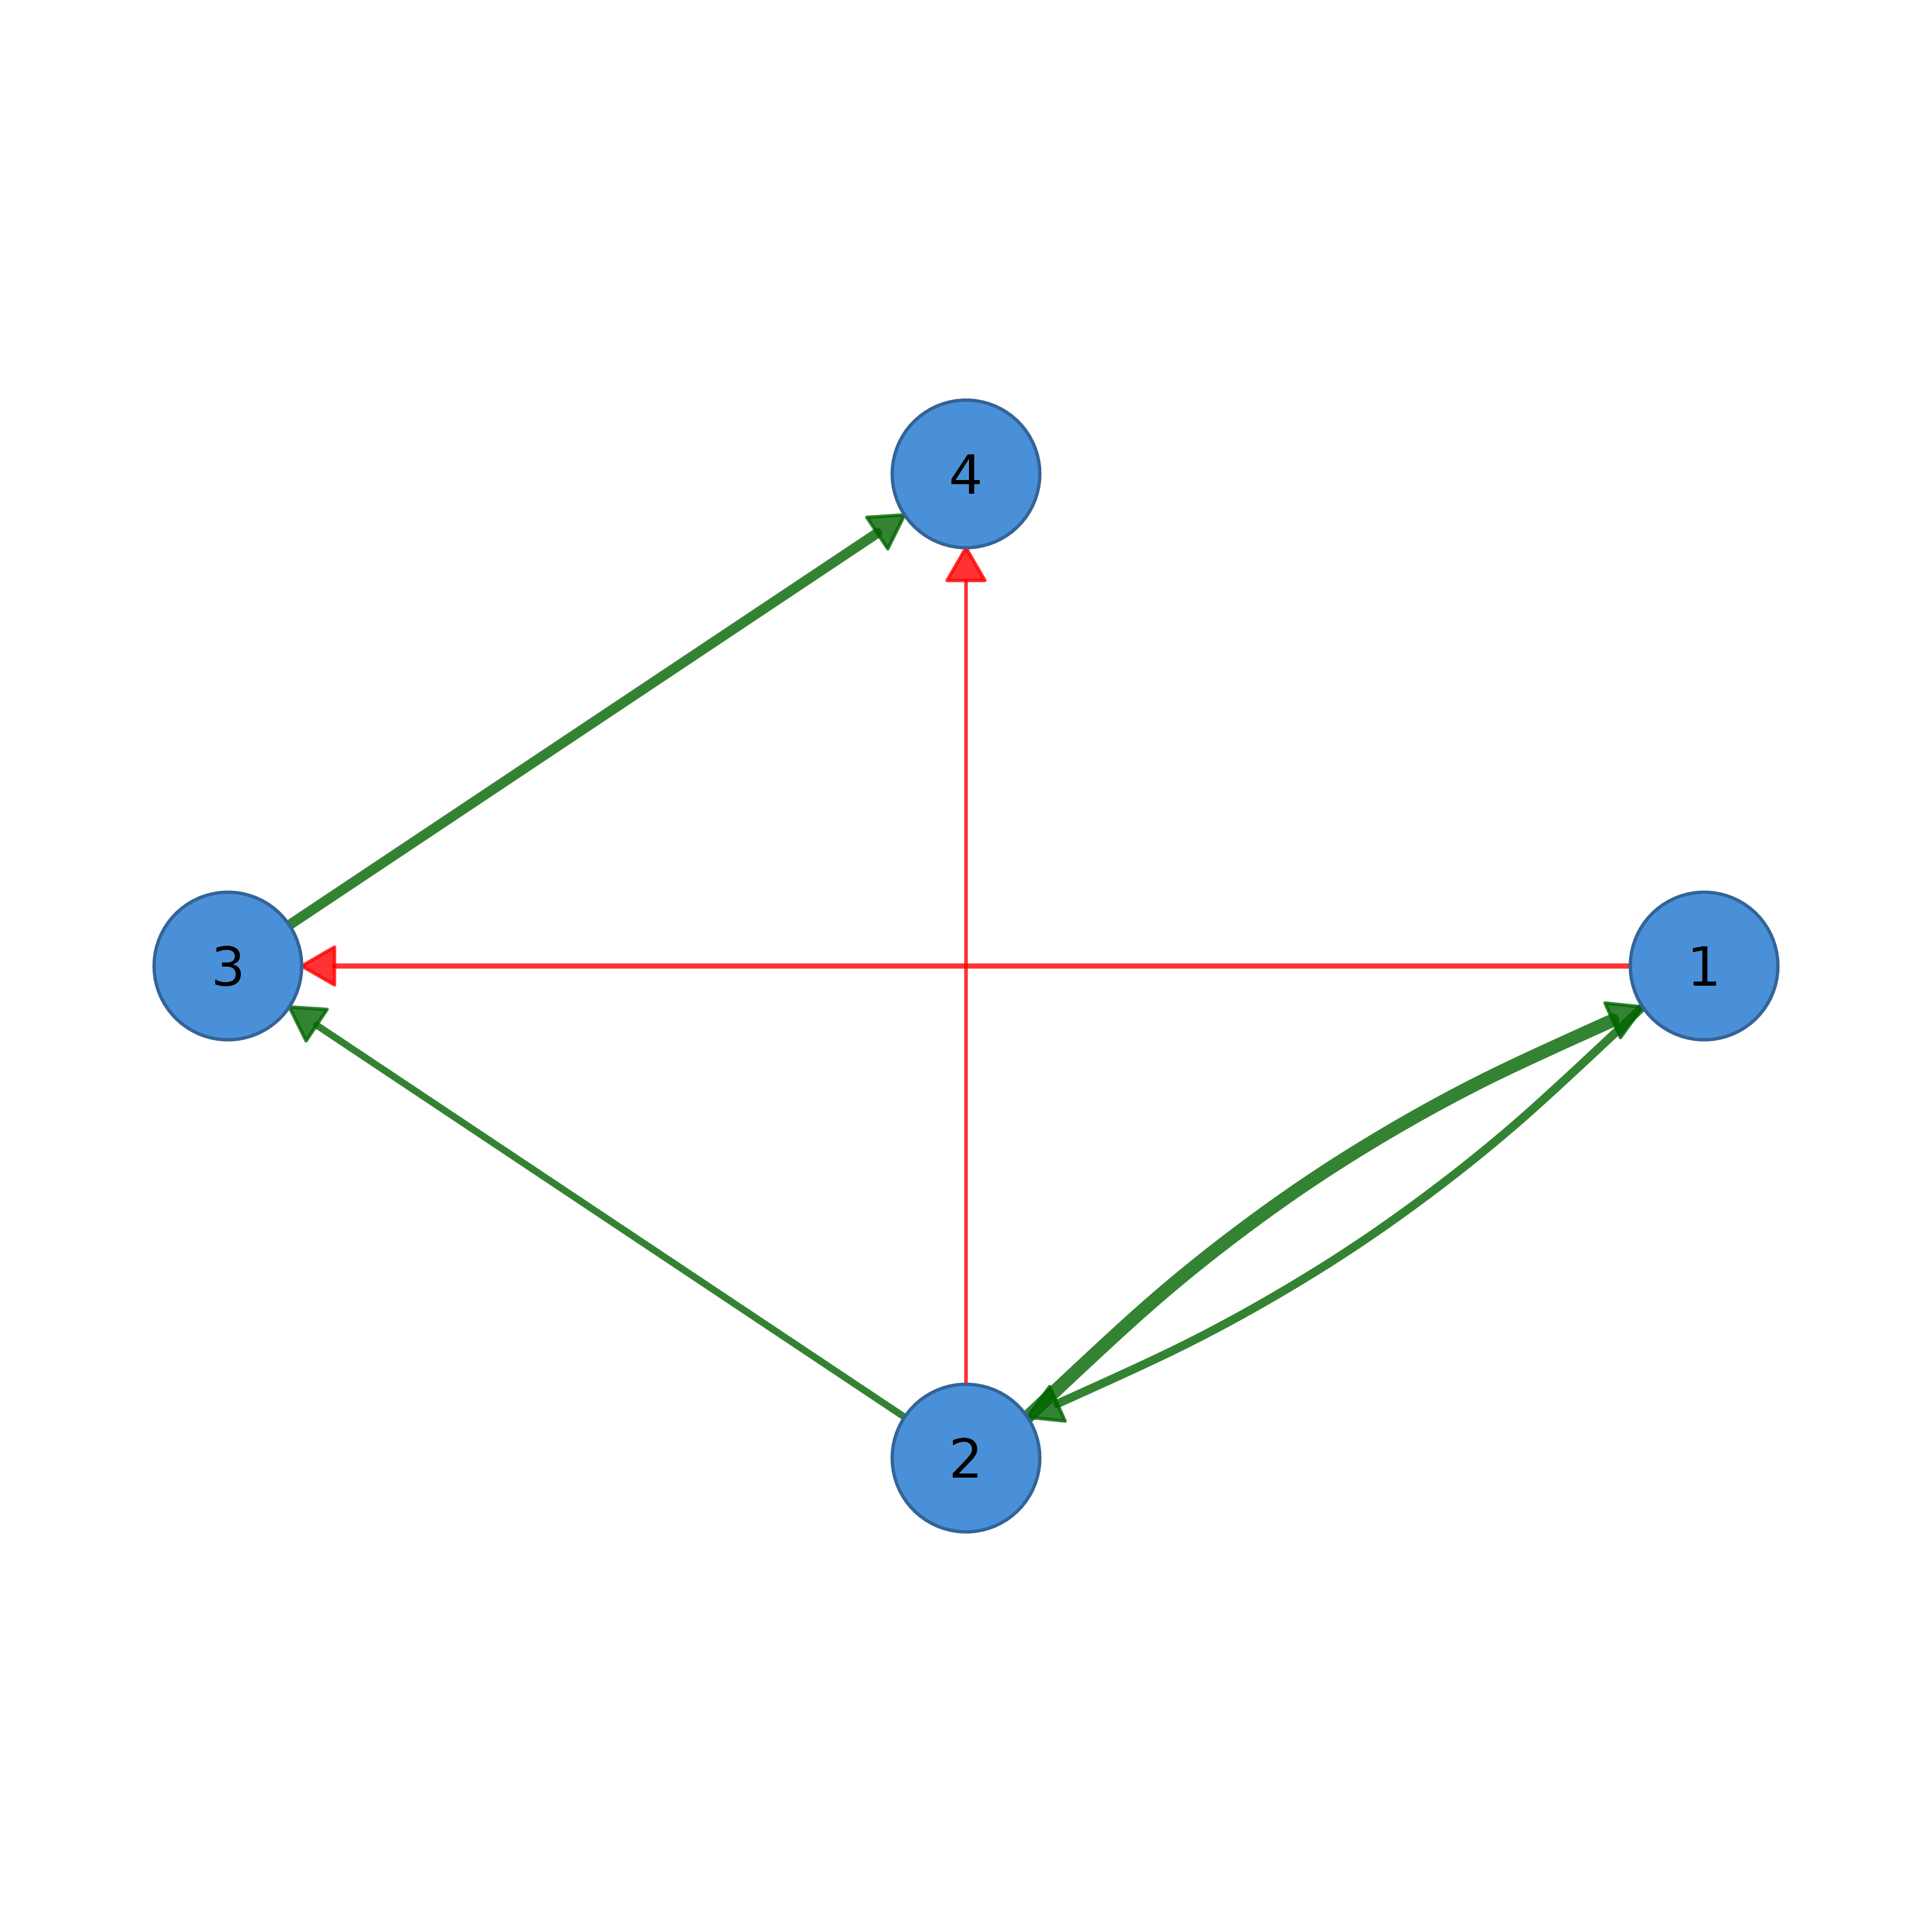
 # Weighted network with signed edges
w_adj <- matrix(c(0, .5, -.3, 0, .8, 0, .4, -.2,
0, 0, 0, .6, 0, 0, 0, 0), 4, 4, byrow = TRUE)
splot(w_adj, edge_positive_color = "darkgreen", edge_negative_color = "red")
# Weighted network with signed edges
w_adj <- matrix(c(0, .5, -.3, 0, .8, 0, .4, -.2,
0, 0, 0, .6, 0, 0, 0, 0), 4, 4, byrow = TRUE)
splot(w_adj, edge_positive_color = "darkgreen", edge_negative_color = "red")