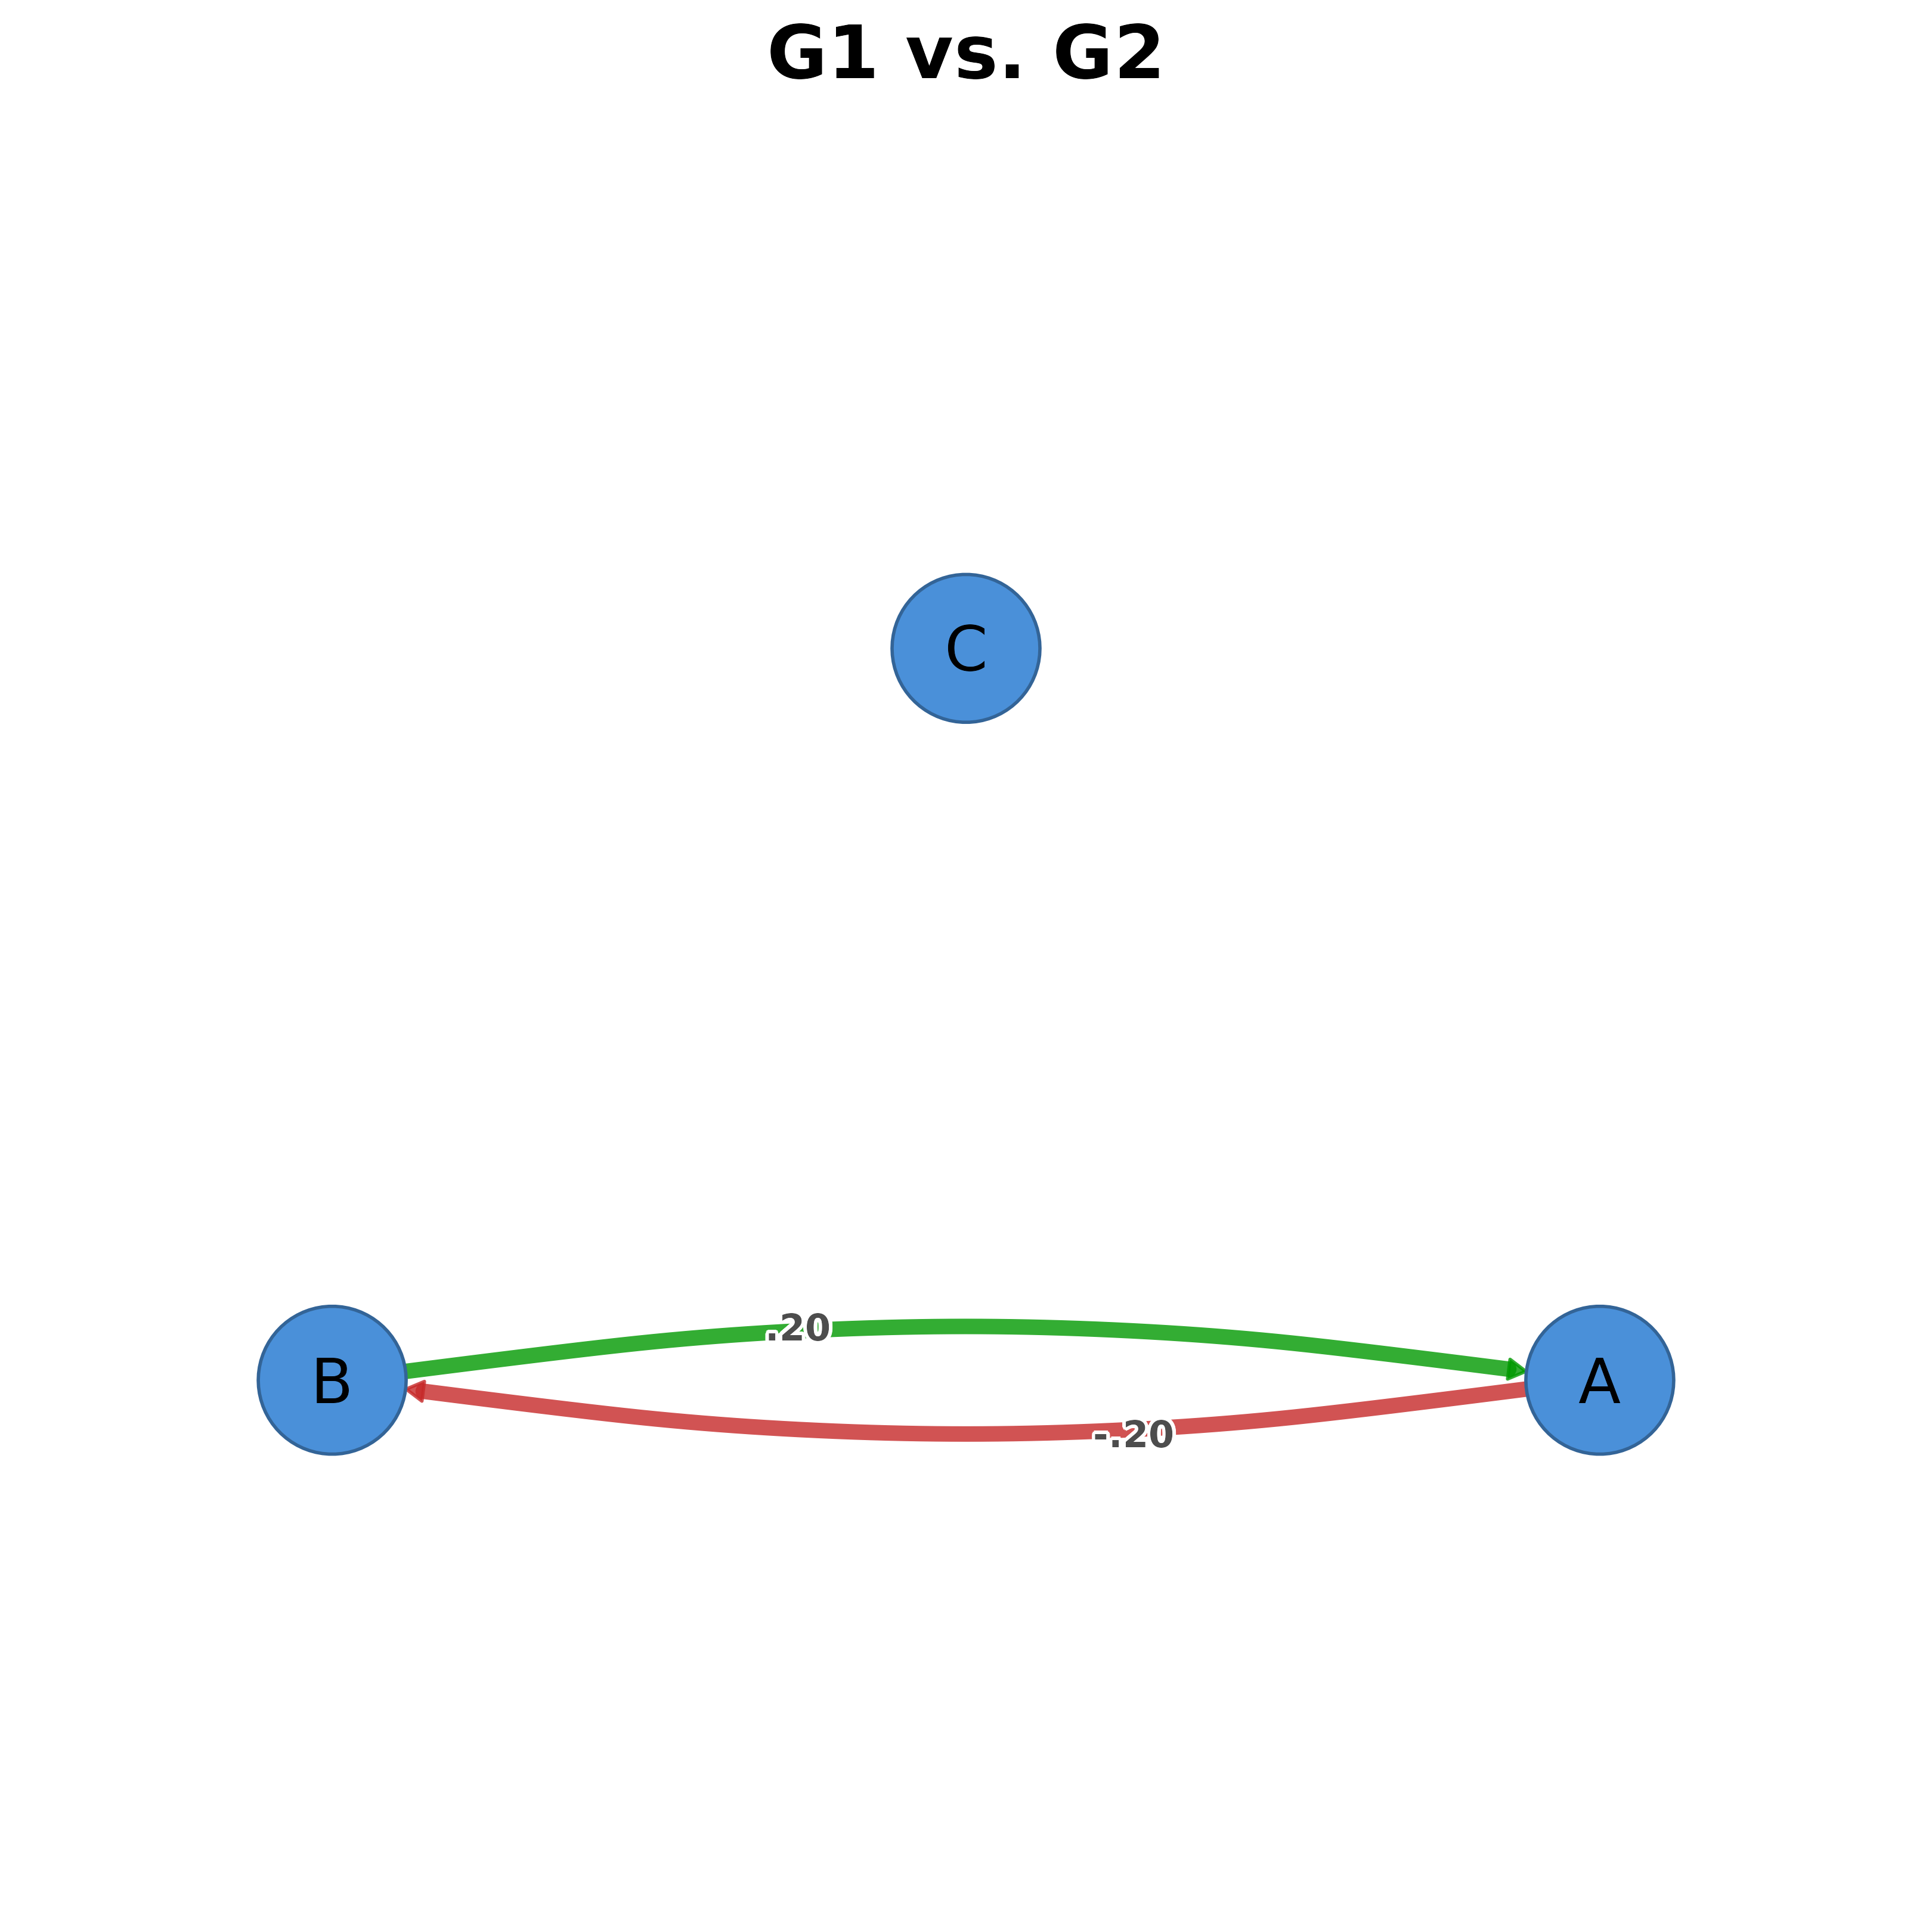
Visualizes all pairwise permutation test results from a group_tna object. Creates a multi-panel plot with one panel per comparison.
Arguments
- x
A group_tna_permutation object (from tna::permutation_test on group_tna).
- ...
Additional arguments passed to plot_permutation().
- i
Index or name of specific comparison to plot. NULL for all.
- combined
Logical: when TRUE (default), lay out panels in an internal grid via
graphics::par(mfrow=...). Set to FALSE to draw each panel into a layout the caller has already configured (e.g. viapanel_layout()). Ignored wheniselects a single panel.
Value
When i is supplied, returns the selected permutation plot.
Otherwise invisibly returns NULL after drawing all panels.
Examples
# Mock a group_tna_permutation object
d1 <- matrix(c(0, .2, -.1, -.2, 0, .1, .1, -.1, 0), 3, 3)
rownames(d1) <- colnames(d1) <- c("A", "B", "C")
d1_sig <- d1; d1_sig[abs(d1) < 0.15] <- 0
perm1 <- list(edges = list(diffs_true = d1, diffs_sig = d1_sig, stats = NULL))
attr(perm1, "labels") <- c("A", "B", "C")
class(perm1) <- c("tna_permutation", "list")
gperm <- list("G1 vs. G2" = perm1)
class(gperm) <- c("group_tna_permutation", "list")
plot_group_permutation(gperm)