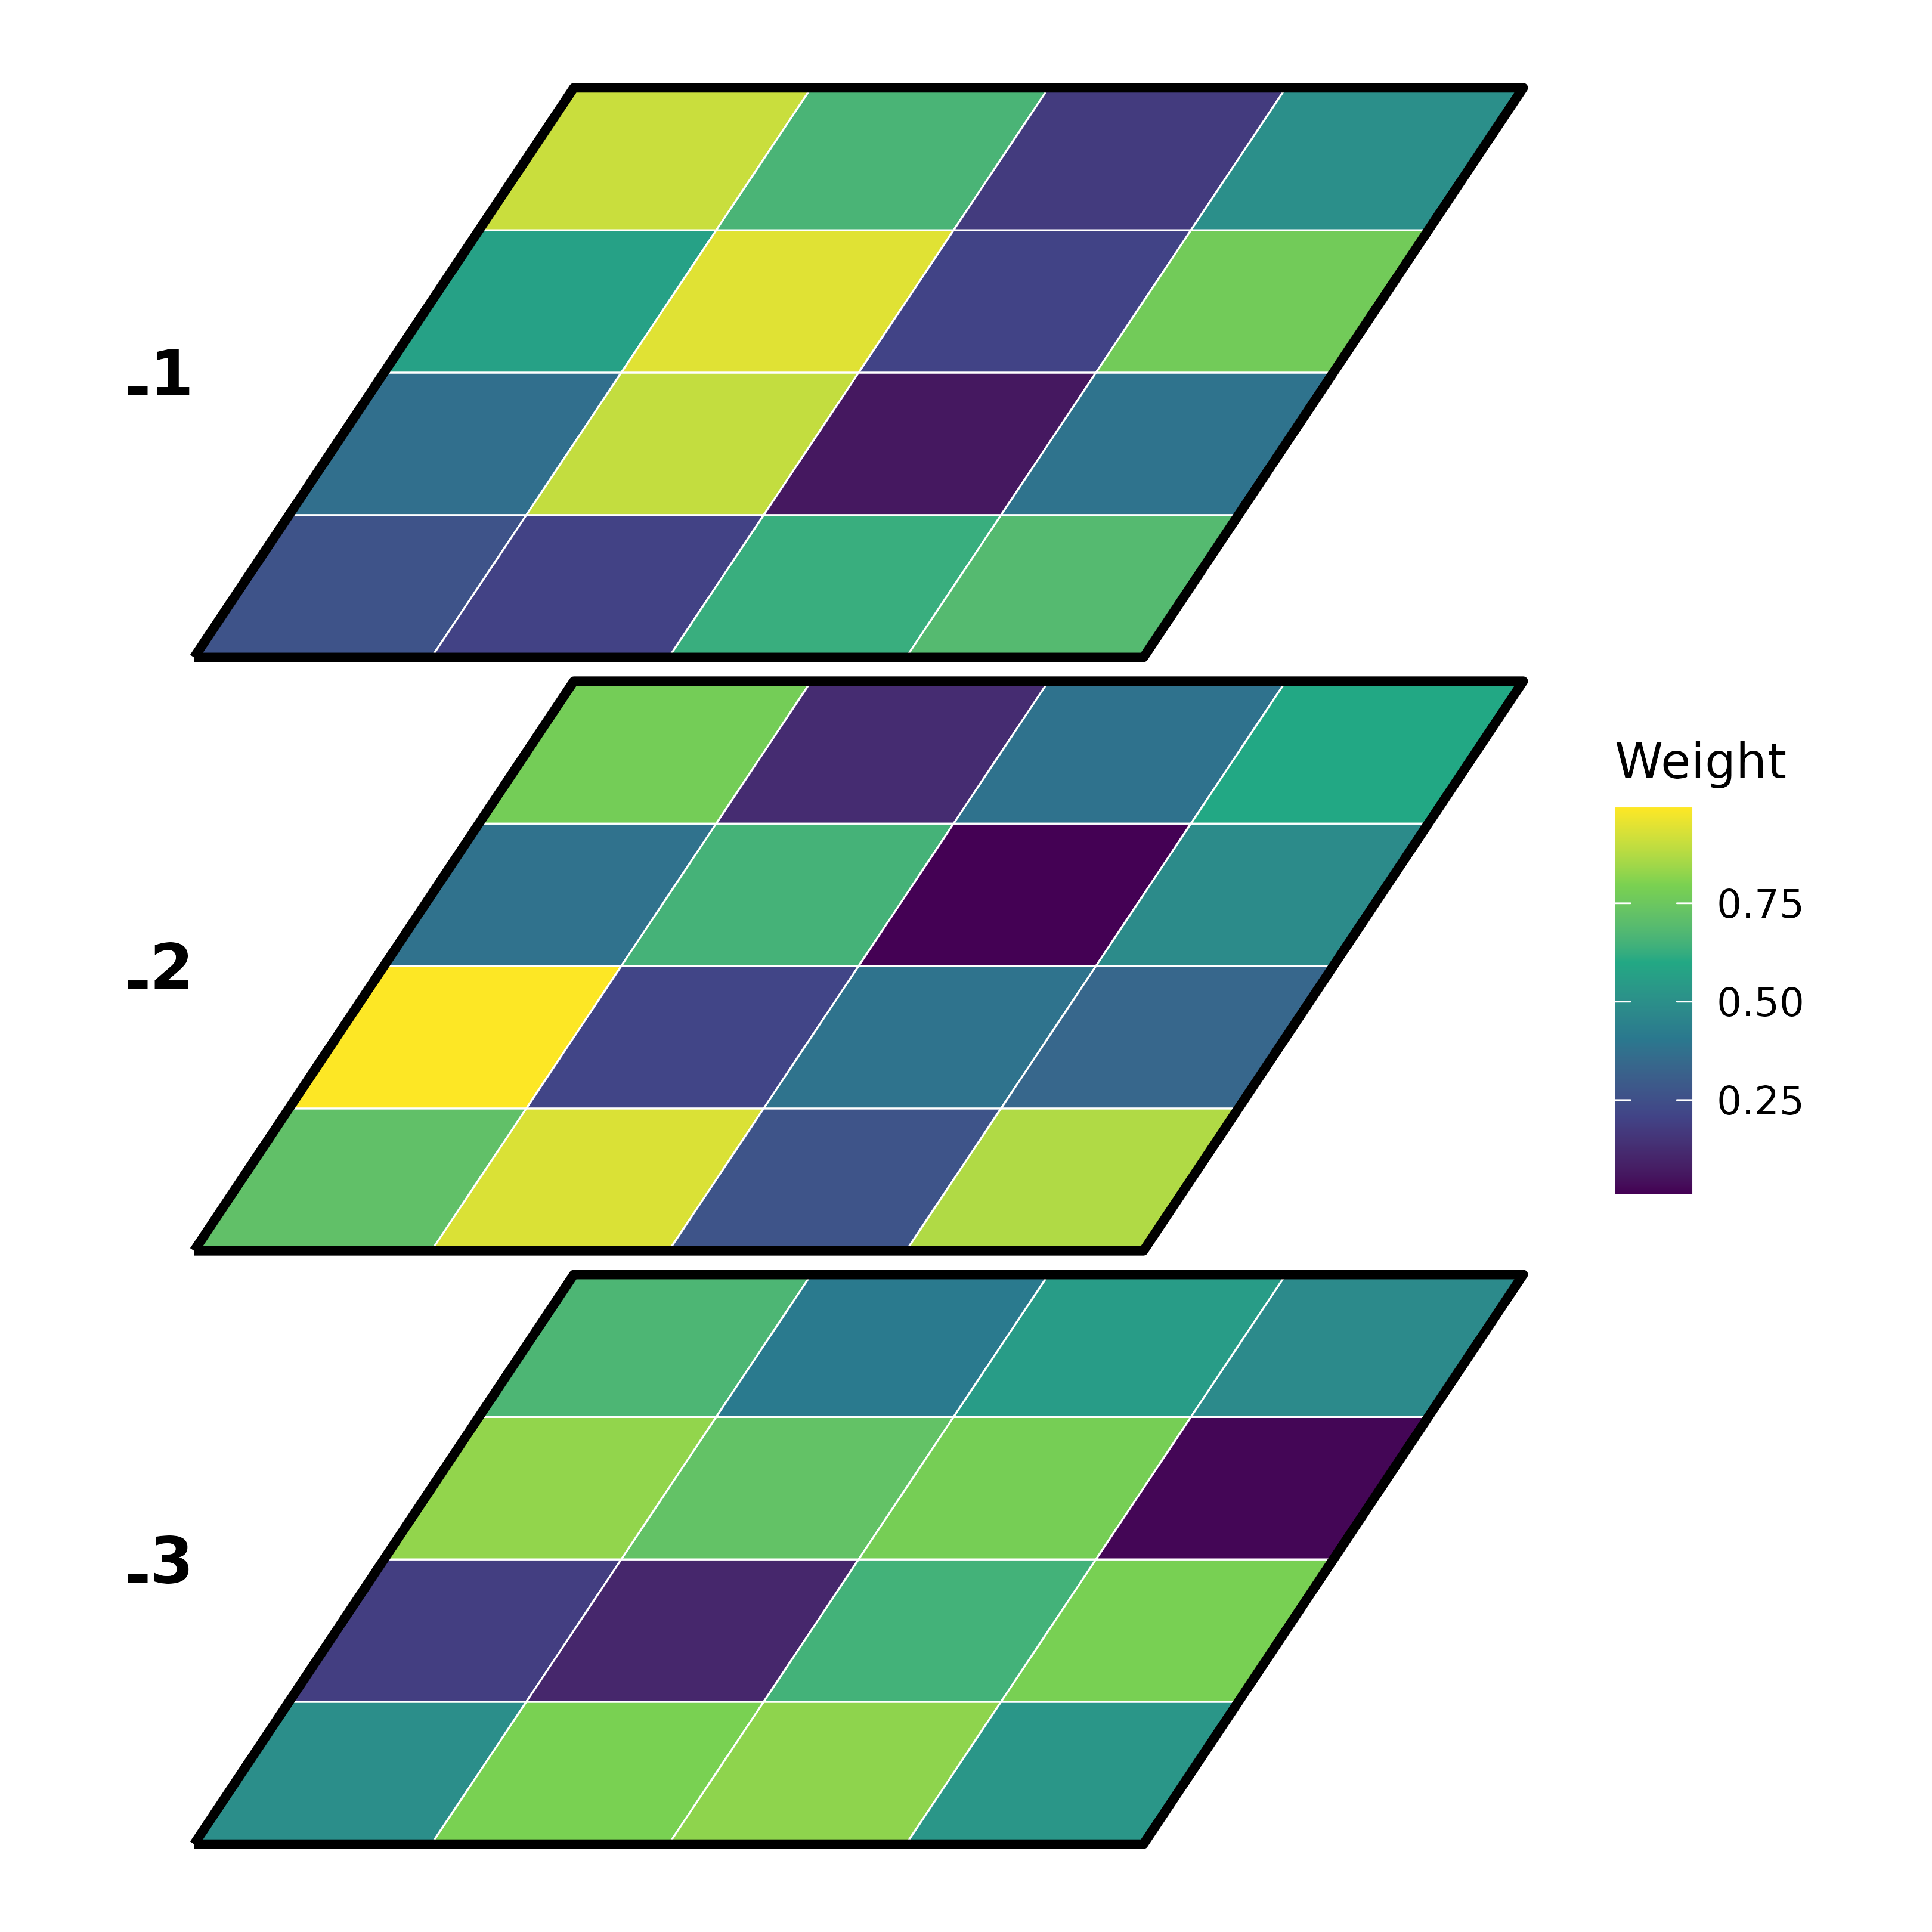
Visualizes multiple network layers as heatmaps on tilted 3D-perspective
planes, in the style of plot_mlna.
Usage
plot_ml_heatmap(
  x,
  layer_list = NULL,
  colors = "viridis",
  layer_spacing = NULL,
  skew = 0.4,
  compress = 0.6,
  show_connections = FALSE,
  connection_color = "#E63946",
  connection_style = "dashed",
  show_borders = TRUE,
  border_color = "black",
  border_width = 1,
  cell_border_color = "white",
  cell_border_width = 0.2,
  show_labels = TRUE,
  show_node_labels = TRUE,
  node_label_size = 3,
  label_size = 5,
  show_legend = TRUE,
  legend_title = "Weight",
  title = NULL,
  limits = NULL,
  na_color = "grey90",
  threshold = 0
)
Arguments
- x
A list of matrices (one per layer), a group_tna object, a cograph_network, or a single matrix with
layer_listspecified.- layer_list
Named list of node vectors, one per layer. For a matrix
xeach layer is the submatrix of its nodes. For a cograph_network it can also be the name of a node column, and whenNULLa node column namedlayers,layer,levelorlevelsis used.- colors
Color palette: "viridis", "heat", "blues", "reds", "inferno", "plasma", or a vector of colors. Any other single name gives the viridis colors. Default "viridis".
- layer_spacing
Vertical spacing between layers, in data units.
NULL(the default) uses 1.1 times the plane height, which is the number of rows of a layer timescompress, with a minimum of 1, so the planes do not overlap. A positive number sets the spacing directly.- skew
Horizontal skew for perspective effect (0-1). Default 0.4.
- compress
Vertical compression for perspective (0-1). Default 0.6.
- show_connections
Show inter-layer connection lines? Default FALSE.
- connection_color
Color for inter-layer connections. Default "#E63946".
- connection_style
Line style: "dashed", "solid", "dotted". Default "dashed".
- show_borders
Show layer outline borders? Default TRUE.
- border_color
Color for layer borders. Default "black".
- border_width
Width of layer borders. Default 1.
- cell_border_color
Color for cell borders. Default "white".
- cell_border_width
Width of cell borders. Default 0.2.
- show_labels
Show layer name labels? Default TRUE.
- show_node_labels
Show the row and column names? Default TRUE. When all layers have the same row and column names, the names are shown once, along the left and lower edges of the front plane. When the layers hold different nodes, each plane shows its own row names along its left edge and the column names below the front plane are those of the front (last) layer.
- node_label_size
Size of the row and column names. Default 3.
- label_size
Size of layer labels. Default 5.
- show_legend
Show color legend? Default TRUE.
- legend_title
Title for legend. Default "Weight".
- title
Plot title. Default NULL.
- limits
Color scale limits c(min, max). NULL for auto.
- na_color
Color for NA values. Default "grey90".
- threshold
Minimum absolute value to display. Cells with
abs(value) < thresholdare set to NA and shown inna_color. Default 0.