Tab-completion-friendly wrapper around the
plot.cograph_motif_result S3 method. Functionally identical
to plot(x, ...) on a cograph_motif_result object,
but exposes the type / n / ncol / colors arguments to
editor autocompletion.
Arguments
- x
A
cograph_motif_resultobject frommotifs()orsubgraphs().- type
Plot type:
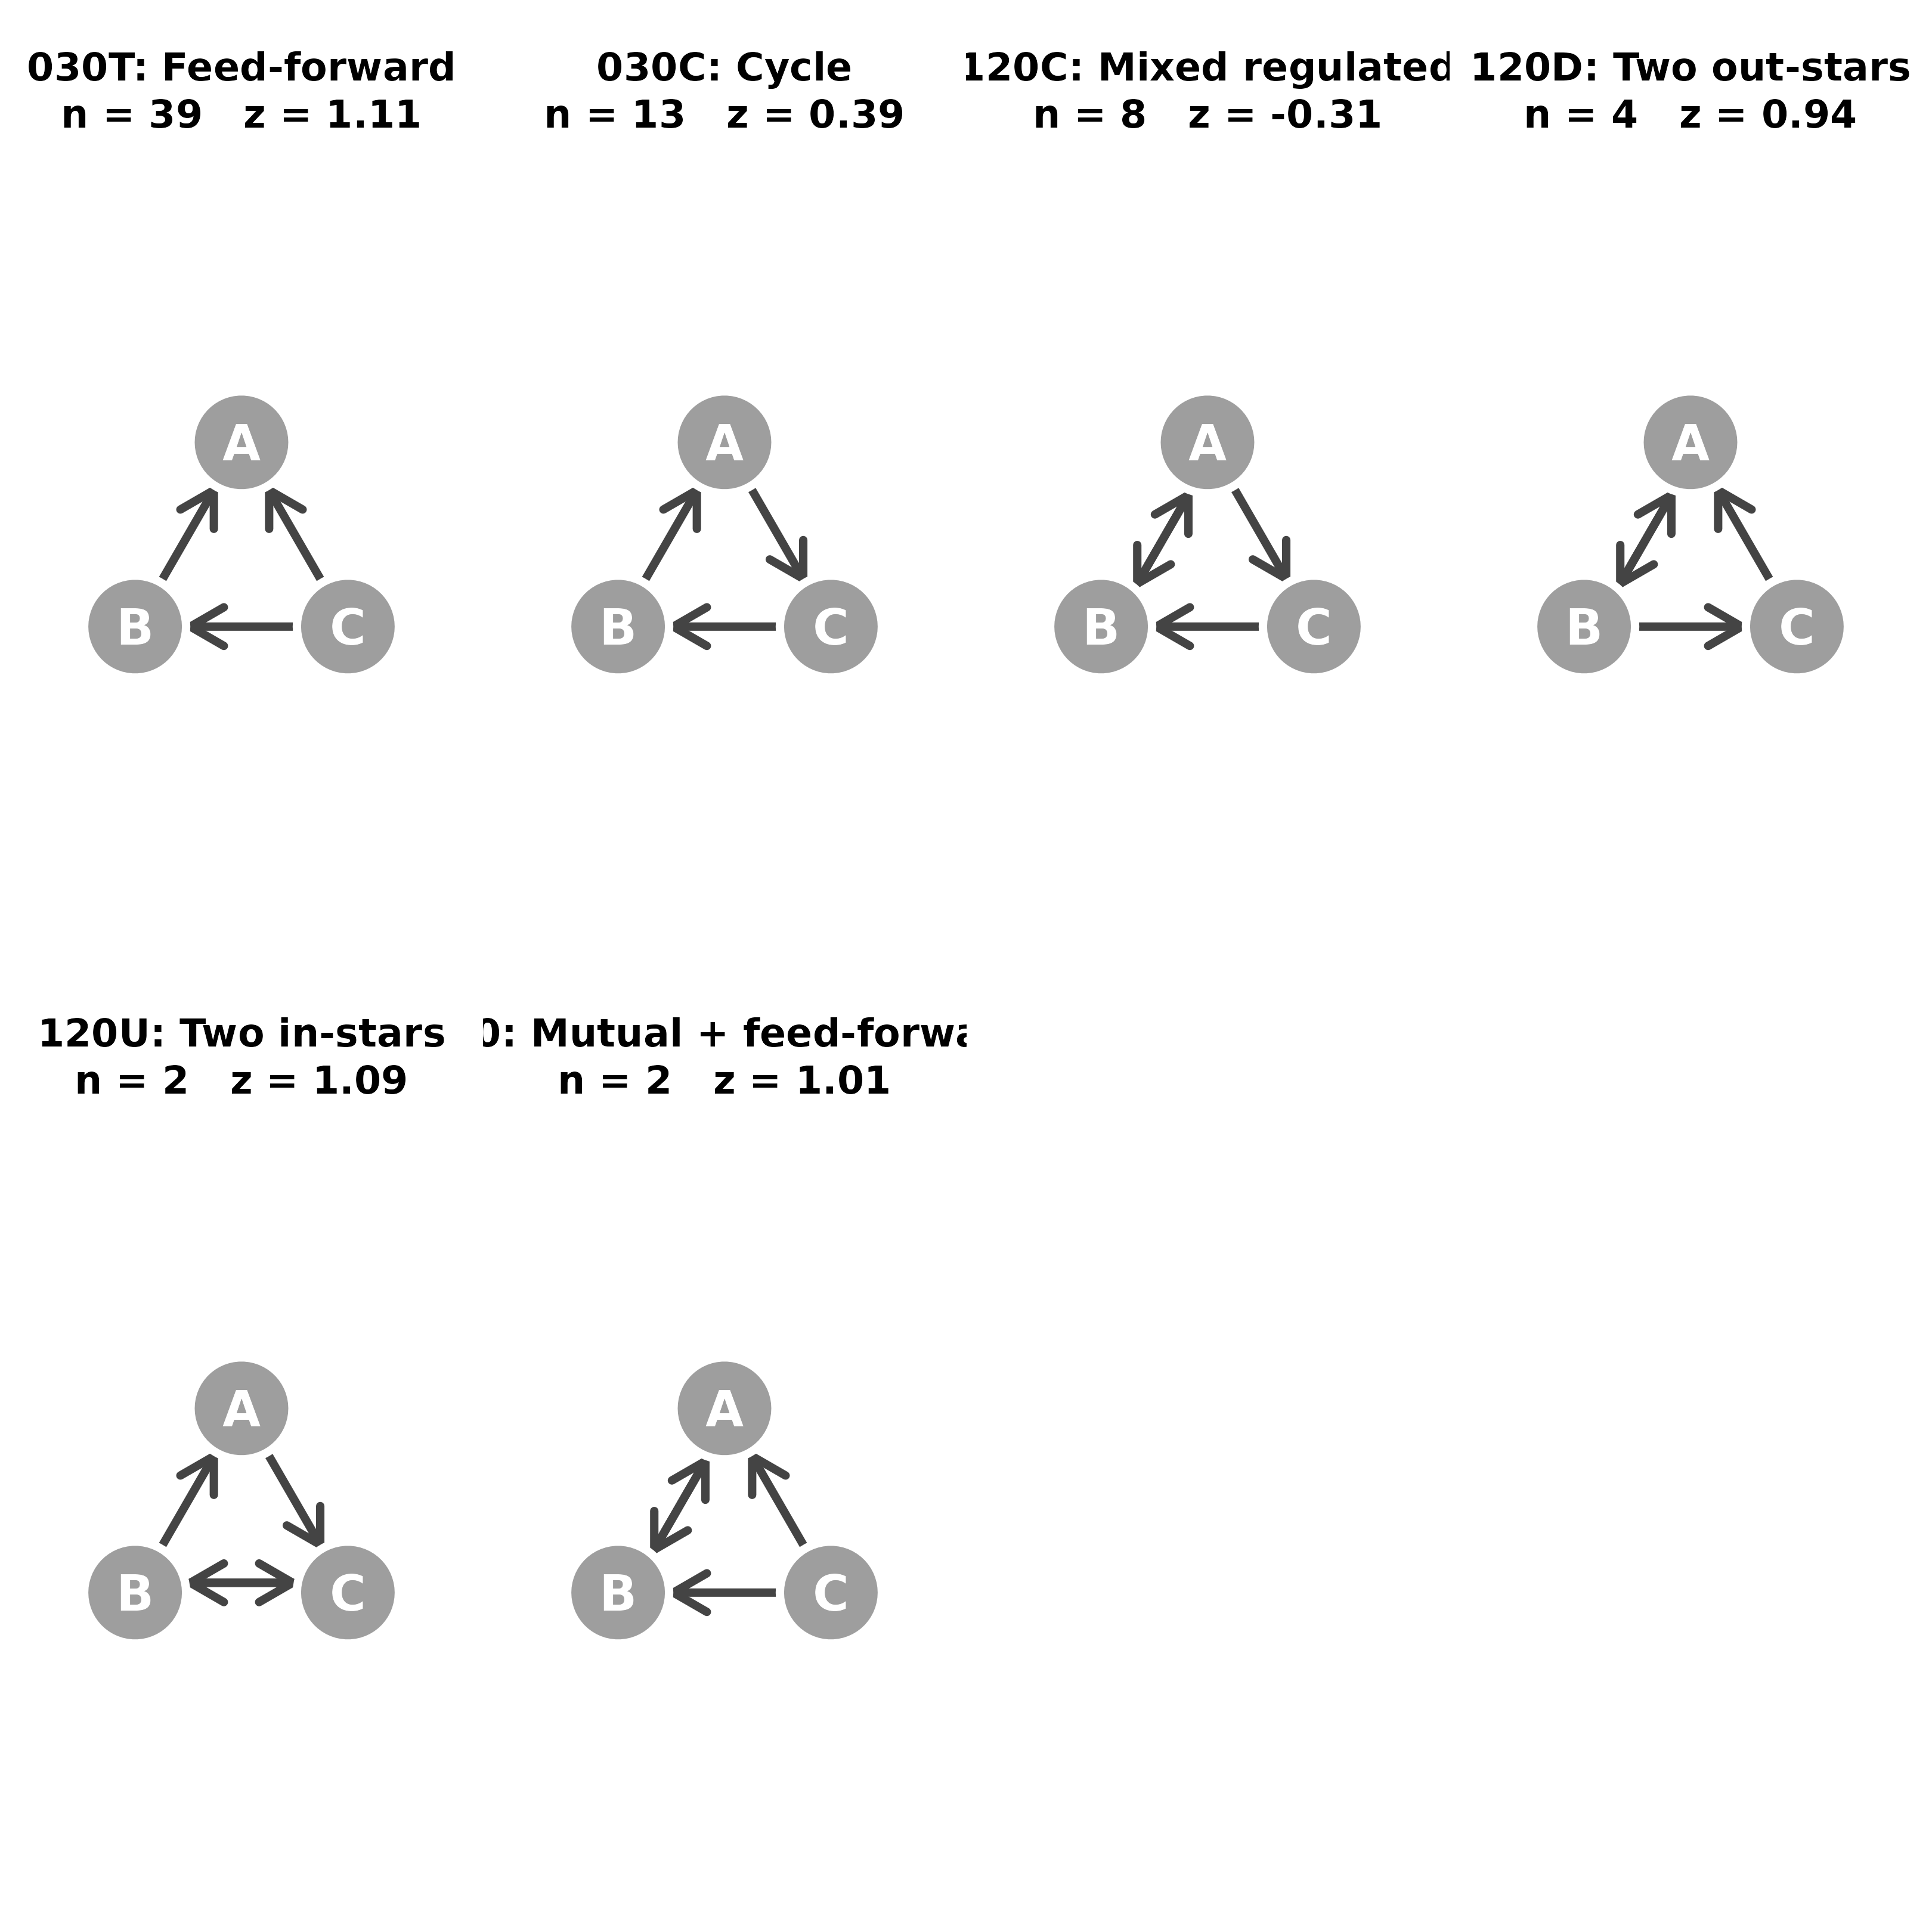
"triads"Network diagrams of specific node triples (instance mode) or falls back to patterns (census mode). Each panel title reads
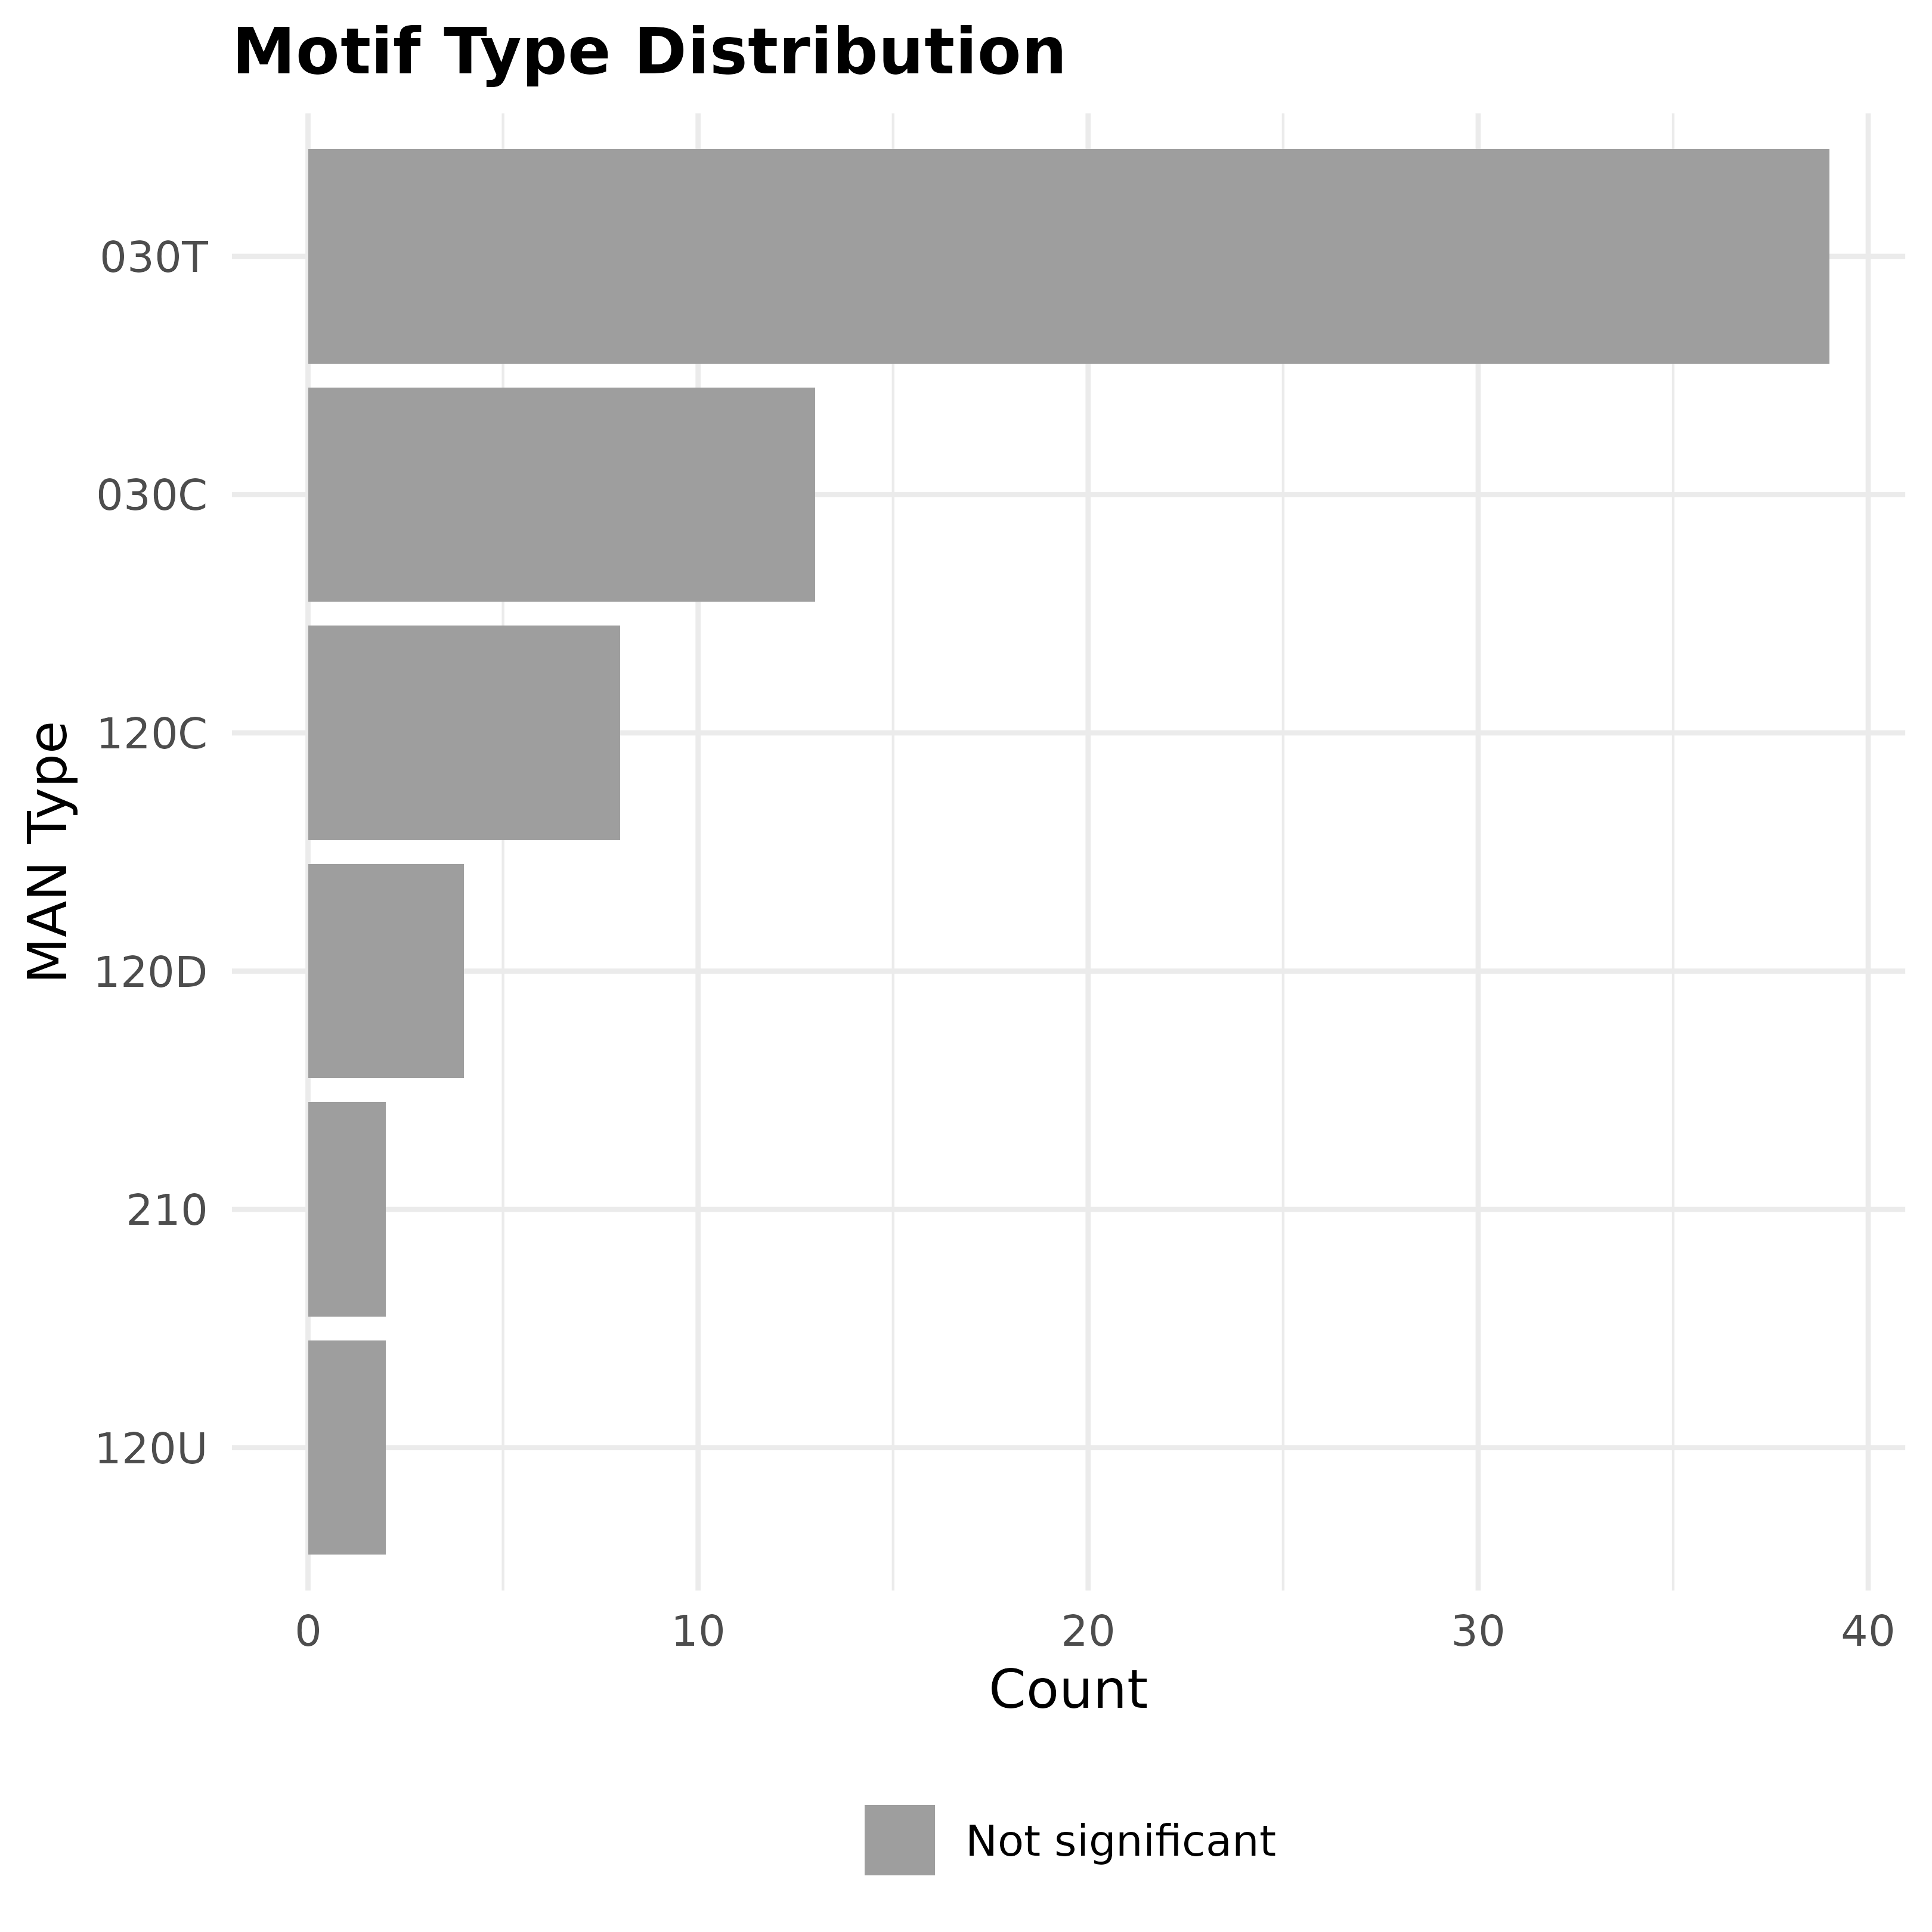
"<MAN code>: <description>"(e.g."030T: Feed-forward") and, in census mode, appends the z-score and a significance star (*p<.05,**p<.01,***p<.001). Arranged in a grid."types"Bar chart of MAN type frequencies. In census mode bars are colored by significance direction (see
colors); in instance mode bars use a single fill because per-type significance would need an aggregation rule across multiple node-triple rows of the same type."significance"Z-score bars per row of
x$results. In census mode each bar is one MAN type; in instance mode each bar is one concrete node-triple, labeled"<triple> [<MAN code>: <description>]". Bars are colored with the same three-tone rule (seecolors). Requiressignificance = TRUEin themotifs()call."patterns"Abstract MAN pattern diagrams showing the edge structure of each triad type. In census mode panel nodes are filled by significance direction (red sig over / blue sig under / grey ns); in instance mode panels use a single fill, same reason as
"types".
- n
Maximum number of items to plot. Default 15.
- ncol
Number of columns in the triad/pattern grid. Default 5.
- colors
Two-element color vector mapped to a three-tone significance scale (used by
type = "significance", plustype = "types"andtype = "patterns"in census mode):colors[1]fills items that are significantly under-represented (p < .05andz < 0);colors[2]fills items that are significantly over-represented (p < .05andz > 0); everything else is filled neutral grey ("#9E9E9E"). Defaultc("#2166AC", "#B2182B")(blue for under, red for over). When significance was not run,type = "types"falls back to a singlecolors[1]fill and patterns nodes usecolors[1].- node_size
Triad node radius (relative). Default 5. (
type = "triads"only.)- label_size
Triad node-label font size in points. Default 11.
- title_size
Per-panel title font size in points. Default 12.
- stats_size
Per-panel statistics caption font size in points (e.g.,
n=34 z=-55.3 p<.001). Default 13.- legend_size
Bottom legend font size in points. Default 13.
- legend
Logical. Show the abbreviation legend strip below the triad grid. Default
TRUE. (type = "triads"only.)- motif_color
Color of triad nodes/edges/labels. Default
"#800020"(deep burgundy). (type = "triads"only.)- spacing
Triangle spread inside each panel;
> 1pulls nodes inward,< 1pushes them apart. Default 1.- base_size
Base font size for the
ggplot2themes used bytype = "types"andtype = "significance". Default 12.- ...
Additional arguments passed to internal plot helpers.
Value
Invisibly returns the input x (or the underlying
ggplot for the "types" and "significance"
types, matching the S3 method).
Examples
g <- igraph::sample_gnp(20, 0.2, directed = TRUE)
m <- motifs(g)
plot_motifs(m)

plot_motifs(m, type = "types")