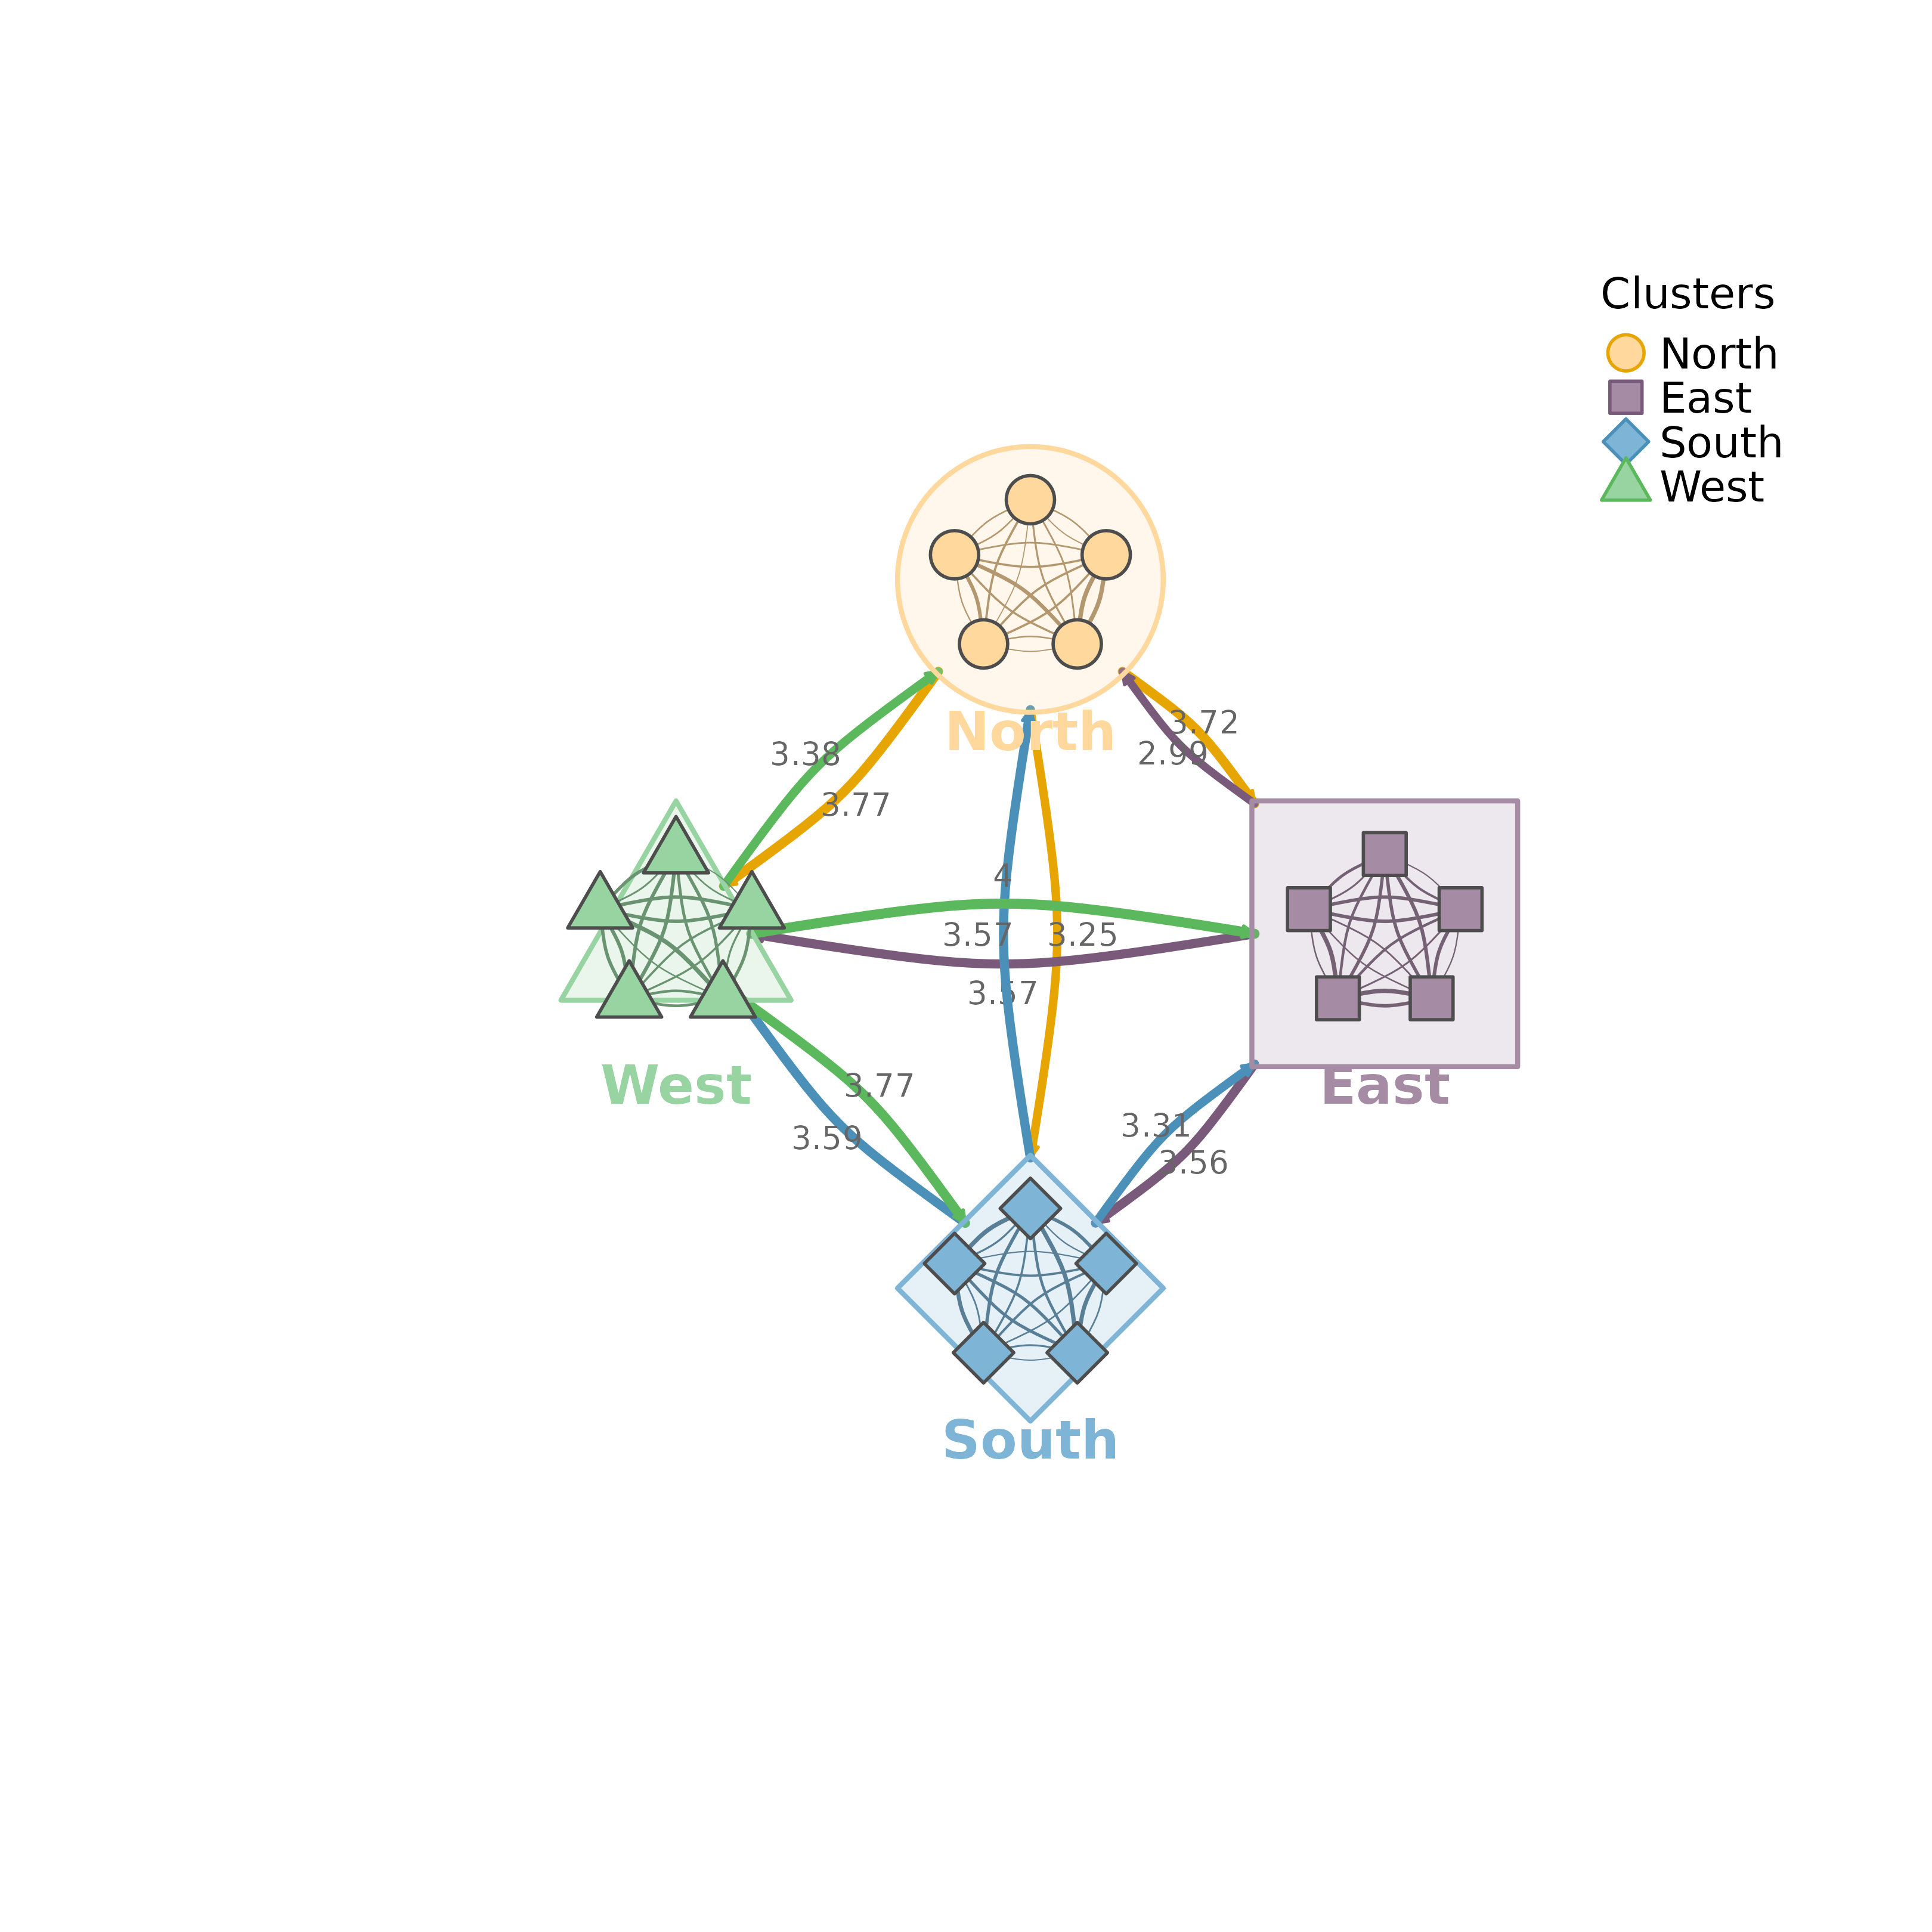
Visualizes multiple network clusters with summary edges between clusters and individual edges within clusters. Each cluster is displayed as a shell shape containing its nodes.
Usage
plot_mtna(
  x,
  cluster_list = NULL,
  community = NULL,
  layout = "circle",
  spacing = 4,
  shape_size = 1.8,
  node_spacing = 0.5,
  colors = NULL,
  shapes = NULL,
  edge_colors = NULL,
  bundle_edges = TRUE,
  bundle_strength = 0.8,
  summary_edges = TRUE,
  aggregation = c("sum", "mean", "max", "min", "median", "density"),
  within_edges = TRUE,
  show_border = TRUE,
  legend = TRUE,
  legend_position = "topright",
  curvature = 0.3,
  node_size = 3,
  layout_margin = 0.15,
  scale = 1,
  show_labels = FALSE,
  nodes = NULL,
  label_size = NULL,
  label_abbrev = NULL,
  cluster_shape = NULL,
  ...
)

mtna(
  x,
  cluster_list = NULL,
  community = NULL,
  layout = "circle",
  spacing = 4,
  shape_size = 1.8,
  node_spacing = 0.5,
  colors = NULL,
  shapes = NULL,
  edge_colors = NULL,
  bundle_edges = TRUE,
  bundle_strength = 0.8,
  summary_edges = TRUE,
  aggregation = c("sum", "mean", "max", "min", "median", "density"),
  within_edges = TRUE,
  show_border = TRUE,
  legend = TRUE,
  legend_position = "topright",
  curvature = 0.3,
  node_size = 3,
  layout_margin = 0.15,
  scale = 1,
  show_labels = FALSE,
  nodes = NULL,
  label_size = NULL,
  label_abbrev = NULL,
  cluster_shape = NULL,
  ...
)
Arguments
- x
A tna object, weight matrix, or cograph_network.
- cluster_list
Clusters can be specified as:
A list of character vectors (node names per cluster)
A string column name from nodes data (e.g., "groups")
NULL with
communityspecified for auto-detectionNULL with a cograph_network that has a common cluster/group column
- community
Community detection method to use for auto-clustering. If specified, overrides
cluster_list. Seedetect_communitiesfor available methods.- layout
How to arrange the clusters: "circle" (default), "grid", "horizontal", "vertical".
- spacing
Distance between cluster centers. Default 4.
- shape_size
Size of each cluster shape (shell radius). Default 1.8.
- node_spacing
Radius for node placement within shapes (0-1 relative to shape_size). Default 0.5.
- colors
Vector of colors for each cluster. Default auto-generated.
- shapes
Vector of shapes for each cluster. Defaults cycle through "circle", "square", "diamond", "triangle", "pentagon", "hexagon", "star", and "cross"; summary shells draw non-shell shapes with the circular fallback.
- edge_colors
Vector of edge colors by source cluster. Default auto-generated.
- bundle_edges
Logical. Bundle inter-cluster edges through channels. Default TRUE.
- bundle_strength
How tightly to bundle edges (0-1). Default 0.8.
- summary_edges
Logical. Show aggregated summary edges between clusters instead of individual node edges. Default TRUE.
- aggregation
Method for aggregating edge weights between clusters: "sum" (total flow), "mean" (average strength), "max" (strongest link), "min" (weakest link), "median", or "density" (normalized by possible edges). Default "sum". Only used when summary_edges = TRUE.
- within_edges
Logical. When summary_edges is TRUE, also show individual edges within each cluster. Default TRUE.
- show_border
Logical. Draw a border around each cluster. Default TRUE.
- legend
Logical. Whether to show legend. Default TRUE.
- legend_position
Position for legend. Default "topright".
- curvature
Edge curvature. Default 0.3.
- node_size
Size of nodes inside shapes. Default 3.
- layout_margin
Margin around the layout as fraction of range. Default 0.15.
- scale
Scaling factor for high-resolution output. Values greater than 1 reduce node, edge, label, and legend sizes by
sqrt(scale)while leaving cluster spacing and shape_size unchanged. Default 1.- show_labels
Logical. Show node labels inside clusters. Default FALSE.
- nodes
Node metadata. Can be:
NULL (default): Use existing nodes data from cograph_network
Data frame: Must have
labelcolumn for matching; iflabelscolumn exists, uses it for display text
Display priority:
labelscolumn >labelcolumn (identifiers).- label_size
Label text size. Default NULL (auto-scaled).
- label_abbrev
Label abbreviation: NULL (none), integer (max chars), or "auto" (adaptive based on node count).
- cluster_shape
Accepted for compatibility; currently unused. Use
shapesto control cluster shell shapes.- ...
Additional parameters passed to plot_tna().
Value
Invisibly returns a cluster_summary object for summary mode, or the plot_tna result otherwise.
See plot_mtna.
Examples
set.seed(42)
nodes <- paste0("N", 1:20)
m <- matrix(runif(400, 0, 0.3), 20, 20); diag(m) <- 0
colnames(m) <- rownames(m) <- nodes
clusters <- list(N = nodes[1:5], E = nodes[6:10],
                 S = nodes[11:15], W = nodes[16:20])
plot_mtna(m, clusters, summary_edges = TRUE)

set.seed(1)
nodes <- paste0("N", 1:12)
m <- matrix(runif(144, 0, 0.3), 12, 12); diag(m) <- 0
colnames(m) <- rownames(m) <- nodes
clusters <- list(C1 = nodes[1:4], C2 = nodes[5:8], C3 = nodes[9:12])
mtna(m, clusters)
set.seed(1)
nodes <- paste0("N", 1:12)
m <- matrix(runif(144, 0, 0.3), 12, 12); diag(m) <- 0
colnames(m) <- rownames(m) <- nodes
clusters <- list(C1 = nodes[1:4], C2 = nodes[5:8], C3 = nodes[9:12])
mtna(m, clusters)