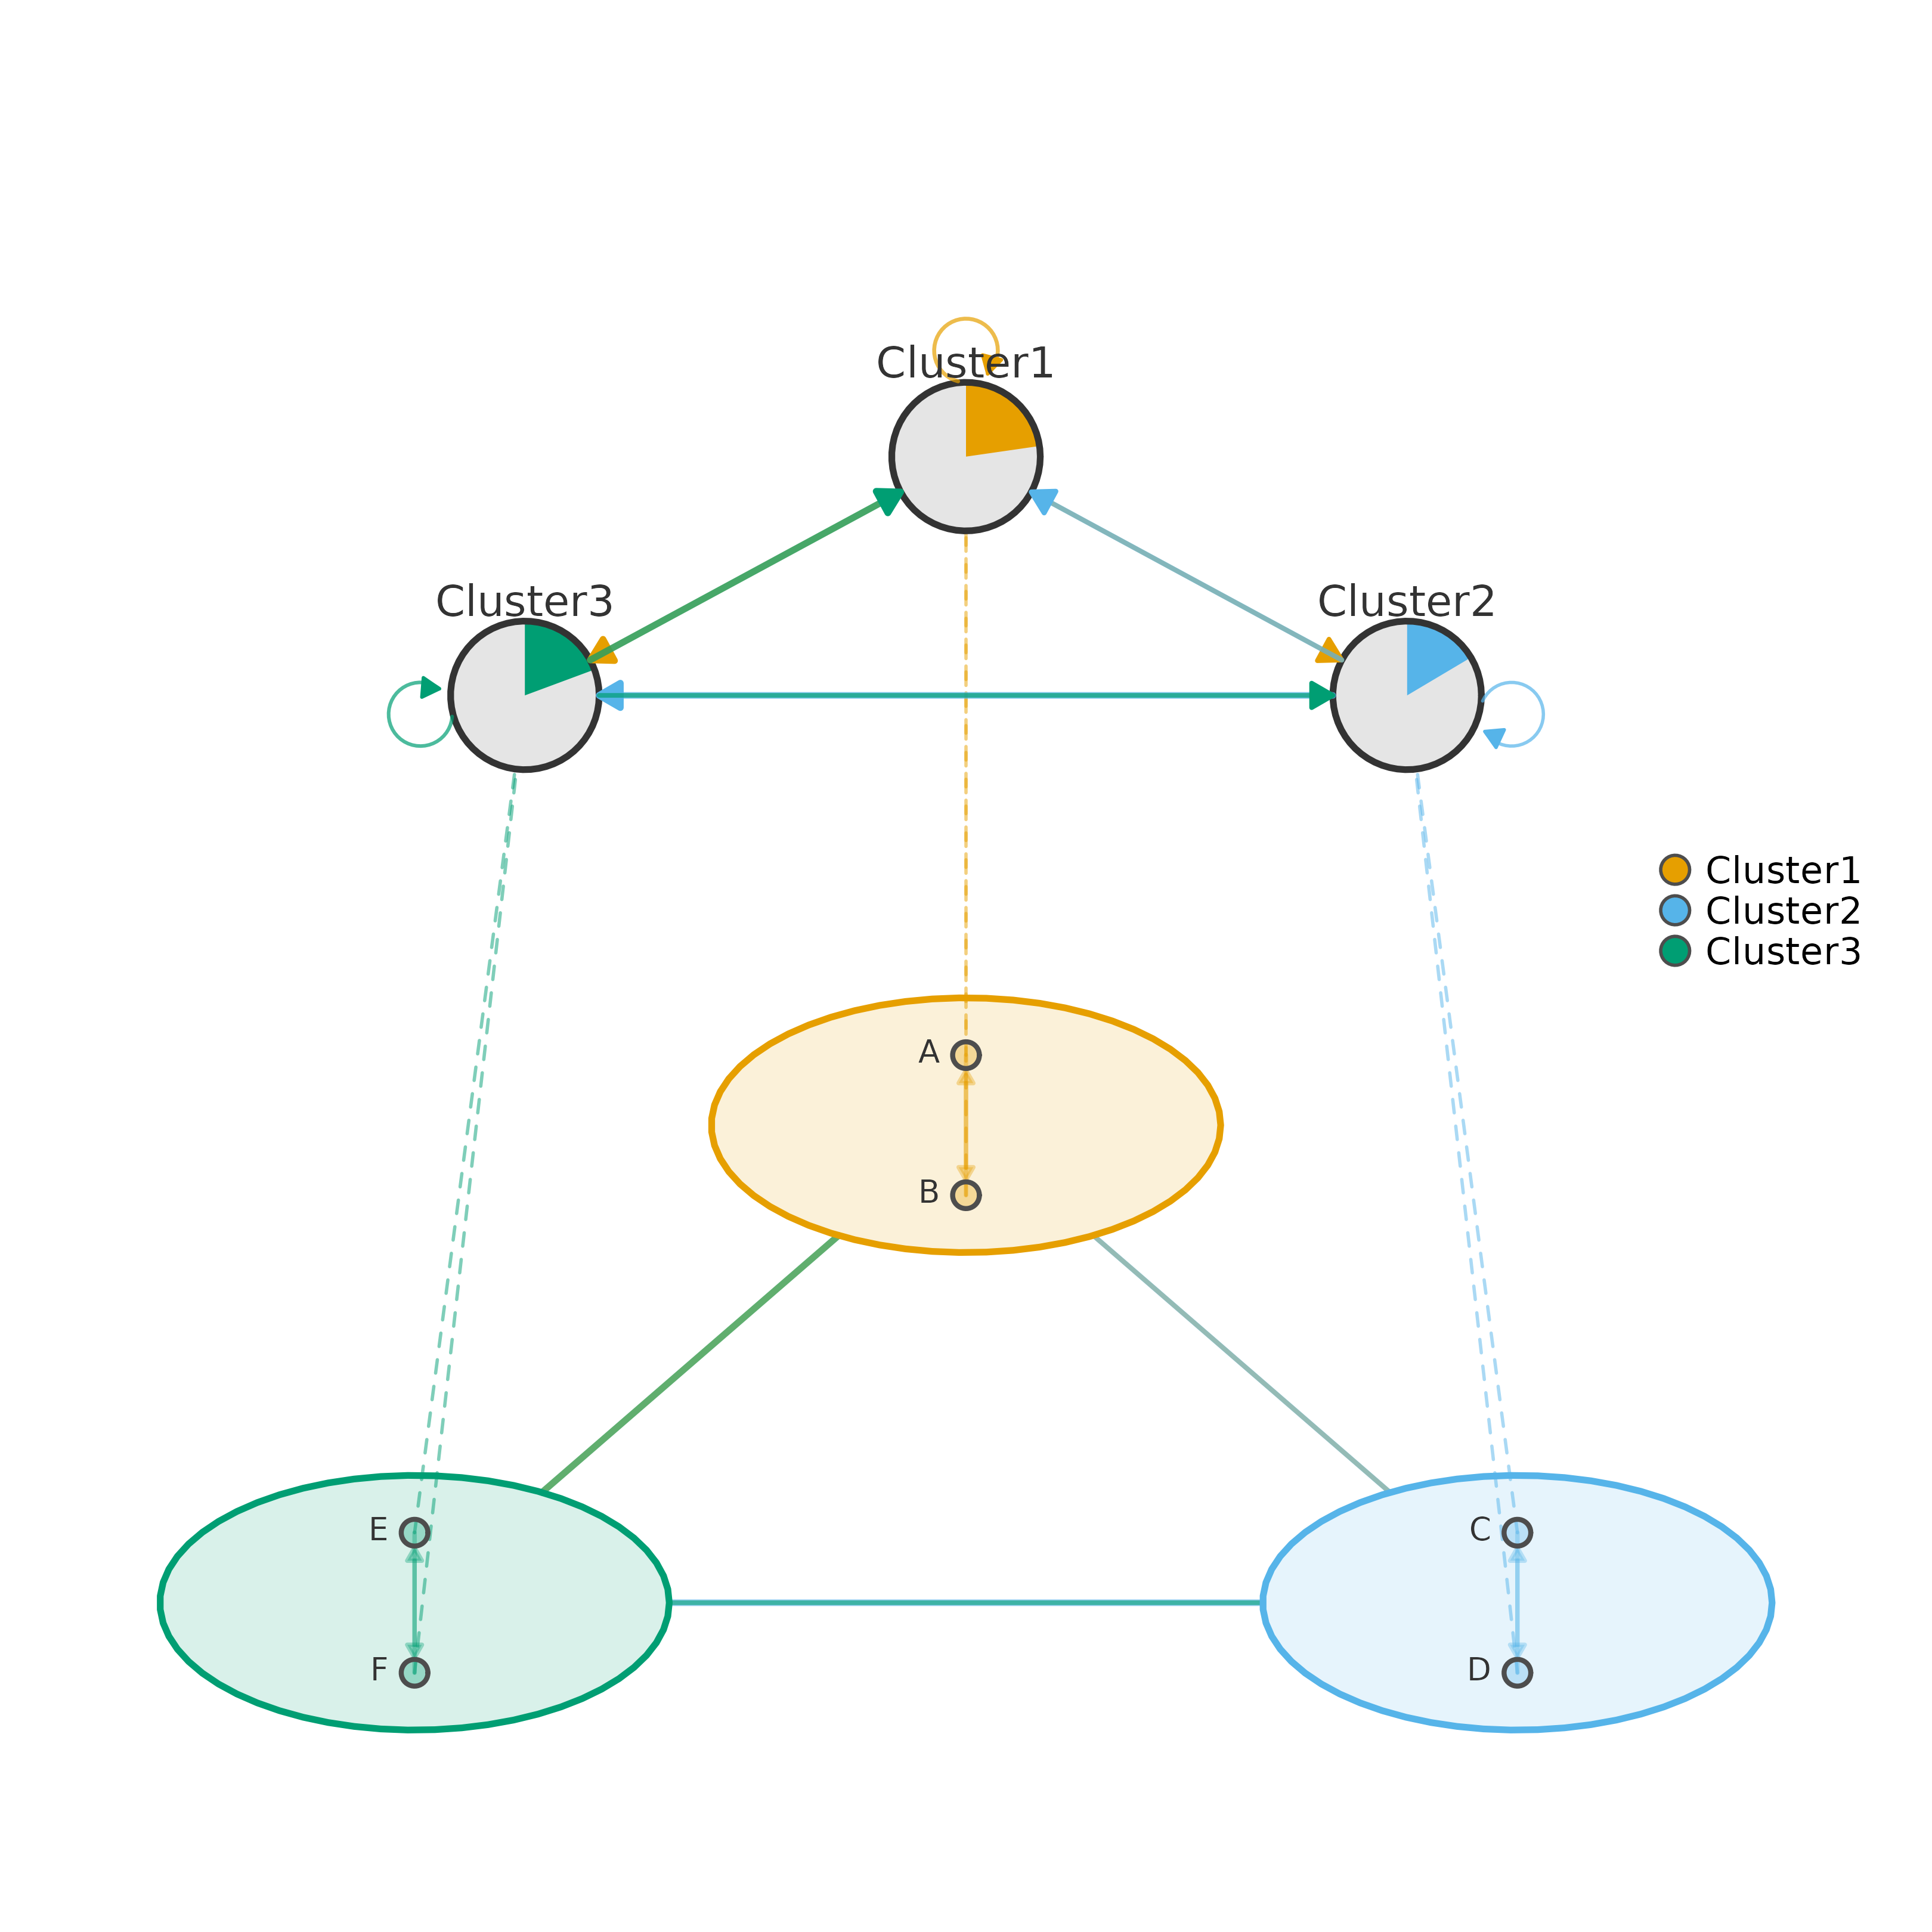
Produces a two-layer hierarchical visualization of a clustered network.
The bottom layer shows every node inside an elliptical cluster shell, with
the within-cluster and between-cluster edges of the individual nodes. The
top layer shows one summary node per cluster, with edges carrying the
aggregated between-cluster weights. By default the colored slice of a
summary node is the cluster's share of the initial state distribution
(see summary_pie). Dashed lines connect each detail node to its
summary node.
Usage
plot_mcml(
  x,
  cluster_list = NULL,
  expand = NULL,
  mode = c("weights", "tna"),
  theme = c("classic", "rich", "light"),
  layer_spacing = NULL,
  spacing = 3,
  shape_size = 1.2,
  summary_size = 4,
  skew_angle = 60,
  aggregation = c("sum", "mean", "max"),
  minimum = 0,
  colors = NULL,
  legend = TRUE,
  show_labels = TRUE,
  nodes = NULL,
  label_size = NULL,
  label_abbrev = NULL,
  node_size = 2.4,
  node_shape = "circle",
  cluster_shape = "circle",
  title = NULL,
  subtitle = NULL,
  title_size = 1.2,
  subtitle_size = 0.9,
  legend_position = "right",
  legend_size = 0.7,
  legend_pt_size = 1.2,
  summary_labels = TRUE,
  summary_label_size = 0.8,
  summary_label_position = 3,
  summary_label_color = "gray20",
  summary_arrows = TRUE,
  summary_arrow_size = 0.1,
  node_donut = NULL,
  node_donut_inner_ratio = 0.55,
  summary_donut_inner_ratio = 0.6,
  summary_donut_show_value = FALSE,
  curved_edges = NULL,
  summary_curve = NULL,
  summary_pie = c("inits", "self"),
  edge_color_by = c("auto", "cluster", "sign"),
  edge_positive_color = "#2E7D32",
  edge_negative_color = "#C62828",
  between_arrows = FALSE,
  edge_width_range = c(0.3, 1.3),
  between_edge_width_range = c(0.5, 2),
  summary_edge_width_range = c(0.5, 2),
  edge_alpha = 0.35,
  between_edge_alpha = 0.6,
  summary_edge_alpha = 0.7,
  inter_layer_alpha = 0.5,
  edge_labels = FALSE,
  edge_label_size = 0.5,
  edge_label_color = "gray40",
  edge_label_digits = 2,
  summary_edge_labels = FALSE,
  summary_edge_label_size = 0.6,
  top_layer_scale = c(0.8, 0.25),
  inter_layer_gap = 0.6,
  node_radius_scale = 0.55,
  shell_alpha = 0.15,
  shell_border_width = 0.75,
  node_border_color = "gray30",
  node_border_width = 0.4,
  summary_border_color = "gray20",
  summary_border_width = 0.6,
  label_color = "gray20",
  label_position = 3,
  directed = NULL,
  ...
)
Arguments
- x
A square weight matrix with row and column names matching the node names in
cluster_list, atnaobject (its$weightsare used), acograph_network(its weights and node table are used), acluster_summaryfromcsum, or anmcmlormcml_pcobject from Nestimate. Acluster_summary,mcmlormcml_pcobject is plotted as it is, andcluster_list,aggregationandnodesare ignored.- cluster_list
Assignment of nodes to clusters. A named list of character vectors gives the node names of each cluster, and the list names become the cluster labels, for example
list(GroupA = c("A", "B"), GroupB = c("C", "D")). Acograph_communitiesobject fromdetect_communitiesis also accepted. For acograph_network, a string names a node column to group by, andNULLuses a node column namedclusters,cluster,groupsorgroup.- expand
Names of clusters whose member states are shown as separate nodes in the summary layer.
"all"orTRUEexpands every cluster, andNULL(default) shows one summary node per cluster. The bottom layer always shows the clusters. The summary layer is then recomputed fromxwith each expanded cluster split into its states. For acluster_summary,mcmlormcml_pcinput it is computed withNestimate::macro_network(), and acograph_expand_unavailableerror is raised when that function is not available.- mode
"weights"(default) or"tna". With"tna",edge_labelsandsummary_edge_labelsdefault toTRUEunless they are supplied. The plotted weights are the same in both modes.- theme
Visual preset, one of
"classic"(default, pie-chart nodes and straight summary edges),"rich"(donut nodes on both layers, curved summary edges and self-loops) or"light"(as"rich"with no shell outline and a lighter shell fill).node_donutandcurved_edgesoverride the preset when supplied.- layer_spacing
Vertical position of the summary layer, which sets the height of the figure.
NULL(default) places it automatically above the bottom layer, at a distance set byinter_layer_gap."fill"increases the gap between the layers so that the figure uses the full height of the device, and never makes it smaller than the automatic gap. A single positive number gives the height of the center of the summary layer above the center of the bottom layer, in the units ofspacing, and overridesinter_layer_gap. A number that places the summary layer inside the bottom layer raises acograph_layers_overlapwarning, and any other value raises acograph_bad_layer_spacingerror.- spacing
Distance from the center to each cluster in the bottom layer. Default 3.
- shape_size
Radius of each cluster shell in the bottom layer. Default 1.2.
- summary_size
Size of the summary nodes. The radius of a summary node is
0.0875 * summary_size. Default 4.- skew_angle
Perspective tilt in degrees, from 0 to 90. At 0 the bottom layer is seen from directly above and at 90 it collapses to a line. Default 60.
- aggregation
Method for aggregating node-level edge weights into cluster-level weights:
"sum"(default),"mean"or"max".- minimum
Edge weight threshold. Edges whose absolute weight does not exceed this value are not plotted. Default 0.
- colors
Character vector of cluster colors, recycled to the number of clusters.
NULL(default) uses the Okabe-Ito palette.- legend
Logical. Add a legend of cluster colors. Default
TRUE.- show_labels
Logical. Show node labels in the bottom layer. Default
TRUE.- nodes
Node metadata data frame for display labels. Its
labelscolumn, or else itslabelcolumn, is used as the label text of the nodes in row order. It replaces the node table of acograph_networkand is ignored whenxis acluster_summary.- label_size
Text size (
cex) of bottom-layer node labels.NULL(default) uses 0.6.- label_abbrev
Label abbreviation passed to
abbrev_label:NULL(default) for full labels, an integer for the maximum number of characters, or"auto"for a length chosen from the number of nodes.- node_size
Size of the detail nodes. The radius of a detail node is
0.035 * node_size. Default 2.4.- node_shape
Shape of the detail nodes, a single value or one value per node.
"circle"(default) plots a pie chart of the node's self-transition share. Other node shapes, such as"square","diamond"or"triangle", are plotted as solid shapes in the cluster color.- cluster_shape
Not used. It is kept for compatibility with earlier versions.
- title
Plot title. Default
NULL.- subtitle
Subtitle shown below the figure. Default
NULL.- title_size
Text size (
cex.main) of the title. Default 1.2.- subtitle_size
Text size (
cex.sub) of the subtitle. Default 0.9.- legend_position
Legend position:
"right"(default),"left","top","bottom"or"none".- legend_size
Text size (
cex) of legend labels. Default 0.7.- legend_pt_size
Point size (
pt.cex) of legend symbols. Default 1.2.- summary_labels
Logical. Show cluster names next to the summary nodes. Default
TRUE.- summary_label_size
Text size of summary labels. Default 0.8.
- summary_label_position
Position of summary labels relative to their nodes: 1 = below, 2 = left, 3 = above, 4 = right. When it is not supplied, each label is placed on the side of its node that faces away from the center of the summary layer.
- summary_label_color
Color of summary labels. Default
"gray20".- summary_arrows
Logical. Add arrowheads to summary edges. Default
TRUE. Arrowheads are removed whendirected = FALSE.- summary_arrow_size
Size of the arrowheads on summary edges. Default 0.10.
- node_donut
Logical or
NULL.TRUEorFALSEturns donut nodes on or off.NULL(default) followstheme.- node_donut_inner_ratio
Hole size, from 0 to 1, of the detail-node donut. Default 0.55.
- summary_donut_inner_ratio
Hole size, from 0 to 1, of the summary donut. Default 0.6.
- summary_donut_show_value
Logical. Print the fill proportion in the center of each summary donut. Default
FALSE.- curved_edges
Logical or
NULL.TRUEorFALSEturns curved summary edges on or off.NULL(default) followstheme.- summary_curve
Numeric or
NULL. Curvature of curved summary edges.NULL(default) uses 0.25 for directed and 0 for undirected networks.- summary_pie
What the colored slice of a summary node shows.
"inits"(default) shows the cluster's share of the initial state distribution, so the slices of all clusters sum to 1."self"shows the cluster's self-retention, the diagonal weight divided by the row sum of the summary matrix.- edge_color_by
Edge coloring on all layers.
"auto"(default) colors edges by cluster when all weights are non-negative and by sign when any weight is negative."cluster"always uses the color of the source cluster."sign"always usesedge_positive_colorandedge_negative_color. The thresholdminimumand the edge widths use absolute weights, so negative edges are plotted.- edge_positive_color
Color of positive edges under sign coloring. Default
"#2E7D32"(green).- edge_negative_color
Color of negative edges under sign coloring. Default
"#C62828"(red).- between_arrows
Logical. Add arrowheads to between-cluster edges in the bottom layer. Default
FALSE.- edge_width_range
Numeric vector
c(min, max)of line widths for within-cluster edges. Widths grow linearly with absolute weight, fromminat zero tomaxat the largest absolute weight. Defaultc(0.3, 1.3).- between_edge_width_range
Numeric vector
c(min, max)of line widths for between-cluster edges. Defaultc(0.5, 2.0).- summary_edge_width_range
Numeric vector
c(min, max)of line widths for summary edges. Defaultc(0.5, 2.0).- edge_alpha
Opacity, from 0 to 1, of within-cluster edges. Default 0.35.
- between_edge_alpha
Opacity, from 0 to 1, of between-cluster edges. Default 0.6.
- summary_edge_alpha
Opacity, from 0 to 1, of summary edges. Default 0.7.
- inter_layer_alpha
Opacity, from 0 to 1, of the dashed inter-layer lines. Default 0.5.
- edge_labels
Logical. Show weight labels on within-cluster edges. Default
FALSE, orTRUEwhenmode = "tna".- edge_label_size
Text size of within-cluster edge labels. Default 0.5.
- edge_label_color
Color of within-cluster edge labels. Default
"gray40".- edge_label_digits
Number of decimal places of edge labels on both layers. Default 2.
- summary_edge_labels
Logical. Show weight labels on summary edges. Default
FALSE, orTRUEwhenmode = "tna".- summary_edge_label_size
Text size of summary edge labels. Default 0.6.
- top_layer_scale
Numeric vector
c(x_scale, y_scale)giving the horizontal and vertical radii of the oval of summary nodes as multiples ofspacing. Defaultc(0.8, 0.25).- inter_layer_gap
Vertical distance from the upper edge of the bottom layer to the center of the summary layer, as a multiple of
spacing. Default 0.6.- node_radius_scale
Radius of the circle of nodes inside each cluster shell, as a fraction of
shape_size. Default 0.55.- shell_alpha
Fill opacity, from 0 to 1, of the cluster shells. Default 0.15, or 0.10 with
theme = "light".- shell_border_width
Line width of the cluster shell borders. Default 0.75, or 0 with
theme = "light".- node_border_color
Border color of the detail nodes. Default
"gray30".- node_border_width
Border width of the detail nodes. Default 0.4.
- summary_border_color
Border color of the summary nodes. Default
"gray20".- summary_border_width
Border width of the summary nodes. Default 0.6.
- label_color
Text color of detail node labels. Default
"gray20".- label_position
Not used. Detail labels are placed to the left or right of each node according to its position in the shell.
- directed
Logical or
NULL.NULL(default) uses the$meta$directedflag of acluster_summaryormcmlinput and the$directedfield of other objects, and treats a plain matrix as undirected when it is symmetric. WithTRUE, every non-zero weight is plotted as a directed edge with an arrowhead. WithFALSE, arrowheads are removed from all layers, overridingsummary_arrowsandbetween_arrows, each pair is plotted once from the upper triangle with its label at the midpoint, and a warning is raised when the aggregated weights are not symmetric.- ...
Not used.
Value
Invisibly, the cluster_summary object used for plotting. It
can be passed back to plot_mcml(), printed, or converted with
as_tna.
Details
For a multi-cluster plot without the summary layer, see
plot_mtna. For stacked multilevel or multiplex layers, see
plot_mlna.
A weight matrix, tna object or cograph_network is passed together with
cluster_list, and the aggregated weights are computed with
csum. A cluster_summary computed beforehand with
csum can be passed as x instead, which avoids
repeating the aggregation when the same clustering is plotted several
times.
For a directed network the aggregated weights are computed with
type = "tna", so each row of the summary matrix sums to 1. For an
undirected network they are computed with type = "cooccurrence".
The mode argument changes only the default of the edge labels.
Bottom-layer clusters are arranged on a circle of radius spacing,
flattened by the perspective skew_angle. Nodes inside each cluster
sit on a smaller circle of radius shape_size * node_radius_scale.
The summary nodes are placed on an oval above the bottom layer whose radii
are set by top_layer_scale.
Edge Types
The plot contains four kinds of edges, each with its own visual parameters.
- Within-cluster (bottom)
Edges between nodes of the same cluster, set by
edge_width_range,edge_alpha,edge_labels,edge_label_size,edge_label_colorandedge_label_digits.- Between-cluster (bottom)
Edges between cluster shells, set by
between_edge_width_range,between_edge_alphaandbetween_arrows.- Summary (top)
Edges between summary nodes, set by
summary_edge_width_range,summary_edge_alpha,summary_edge_labels,summary_edge_label_size,summary_arrowsandsummary_arrow_size.- Inter-layer (dashed)
Lines from each detail node to its summary node, set by
inter_layer_alpha.
See also
csum for the aggregated cluster data,
plot_mtna for a multi-cluster plot without a summary layer,
plot_mlna for stacked multilevel or multiplex layers,
detect_communities for algorithmic cluster detection