Visualizes bootstrap analysis results with styling to distinguish significant from non-significant edges. Works with tna_bootstrap objects from the tna package.
Arguments
- x
A tna_bootstrap object (from tna::bootstrap).
- ...
Additional arguments passed to splot().
- display
Display mode:
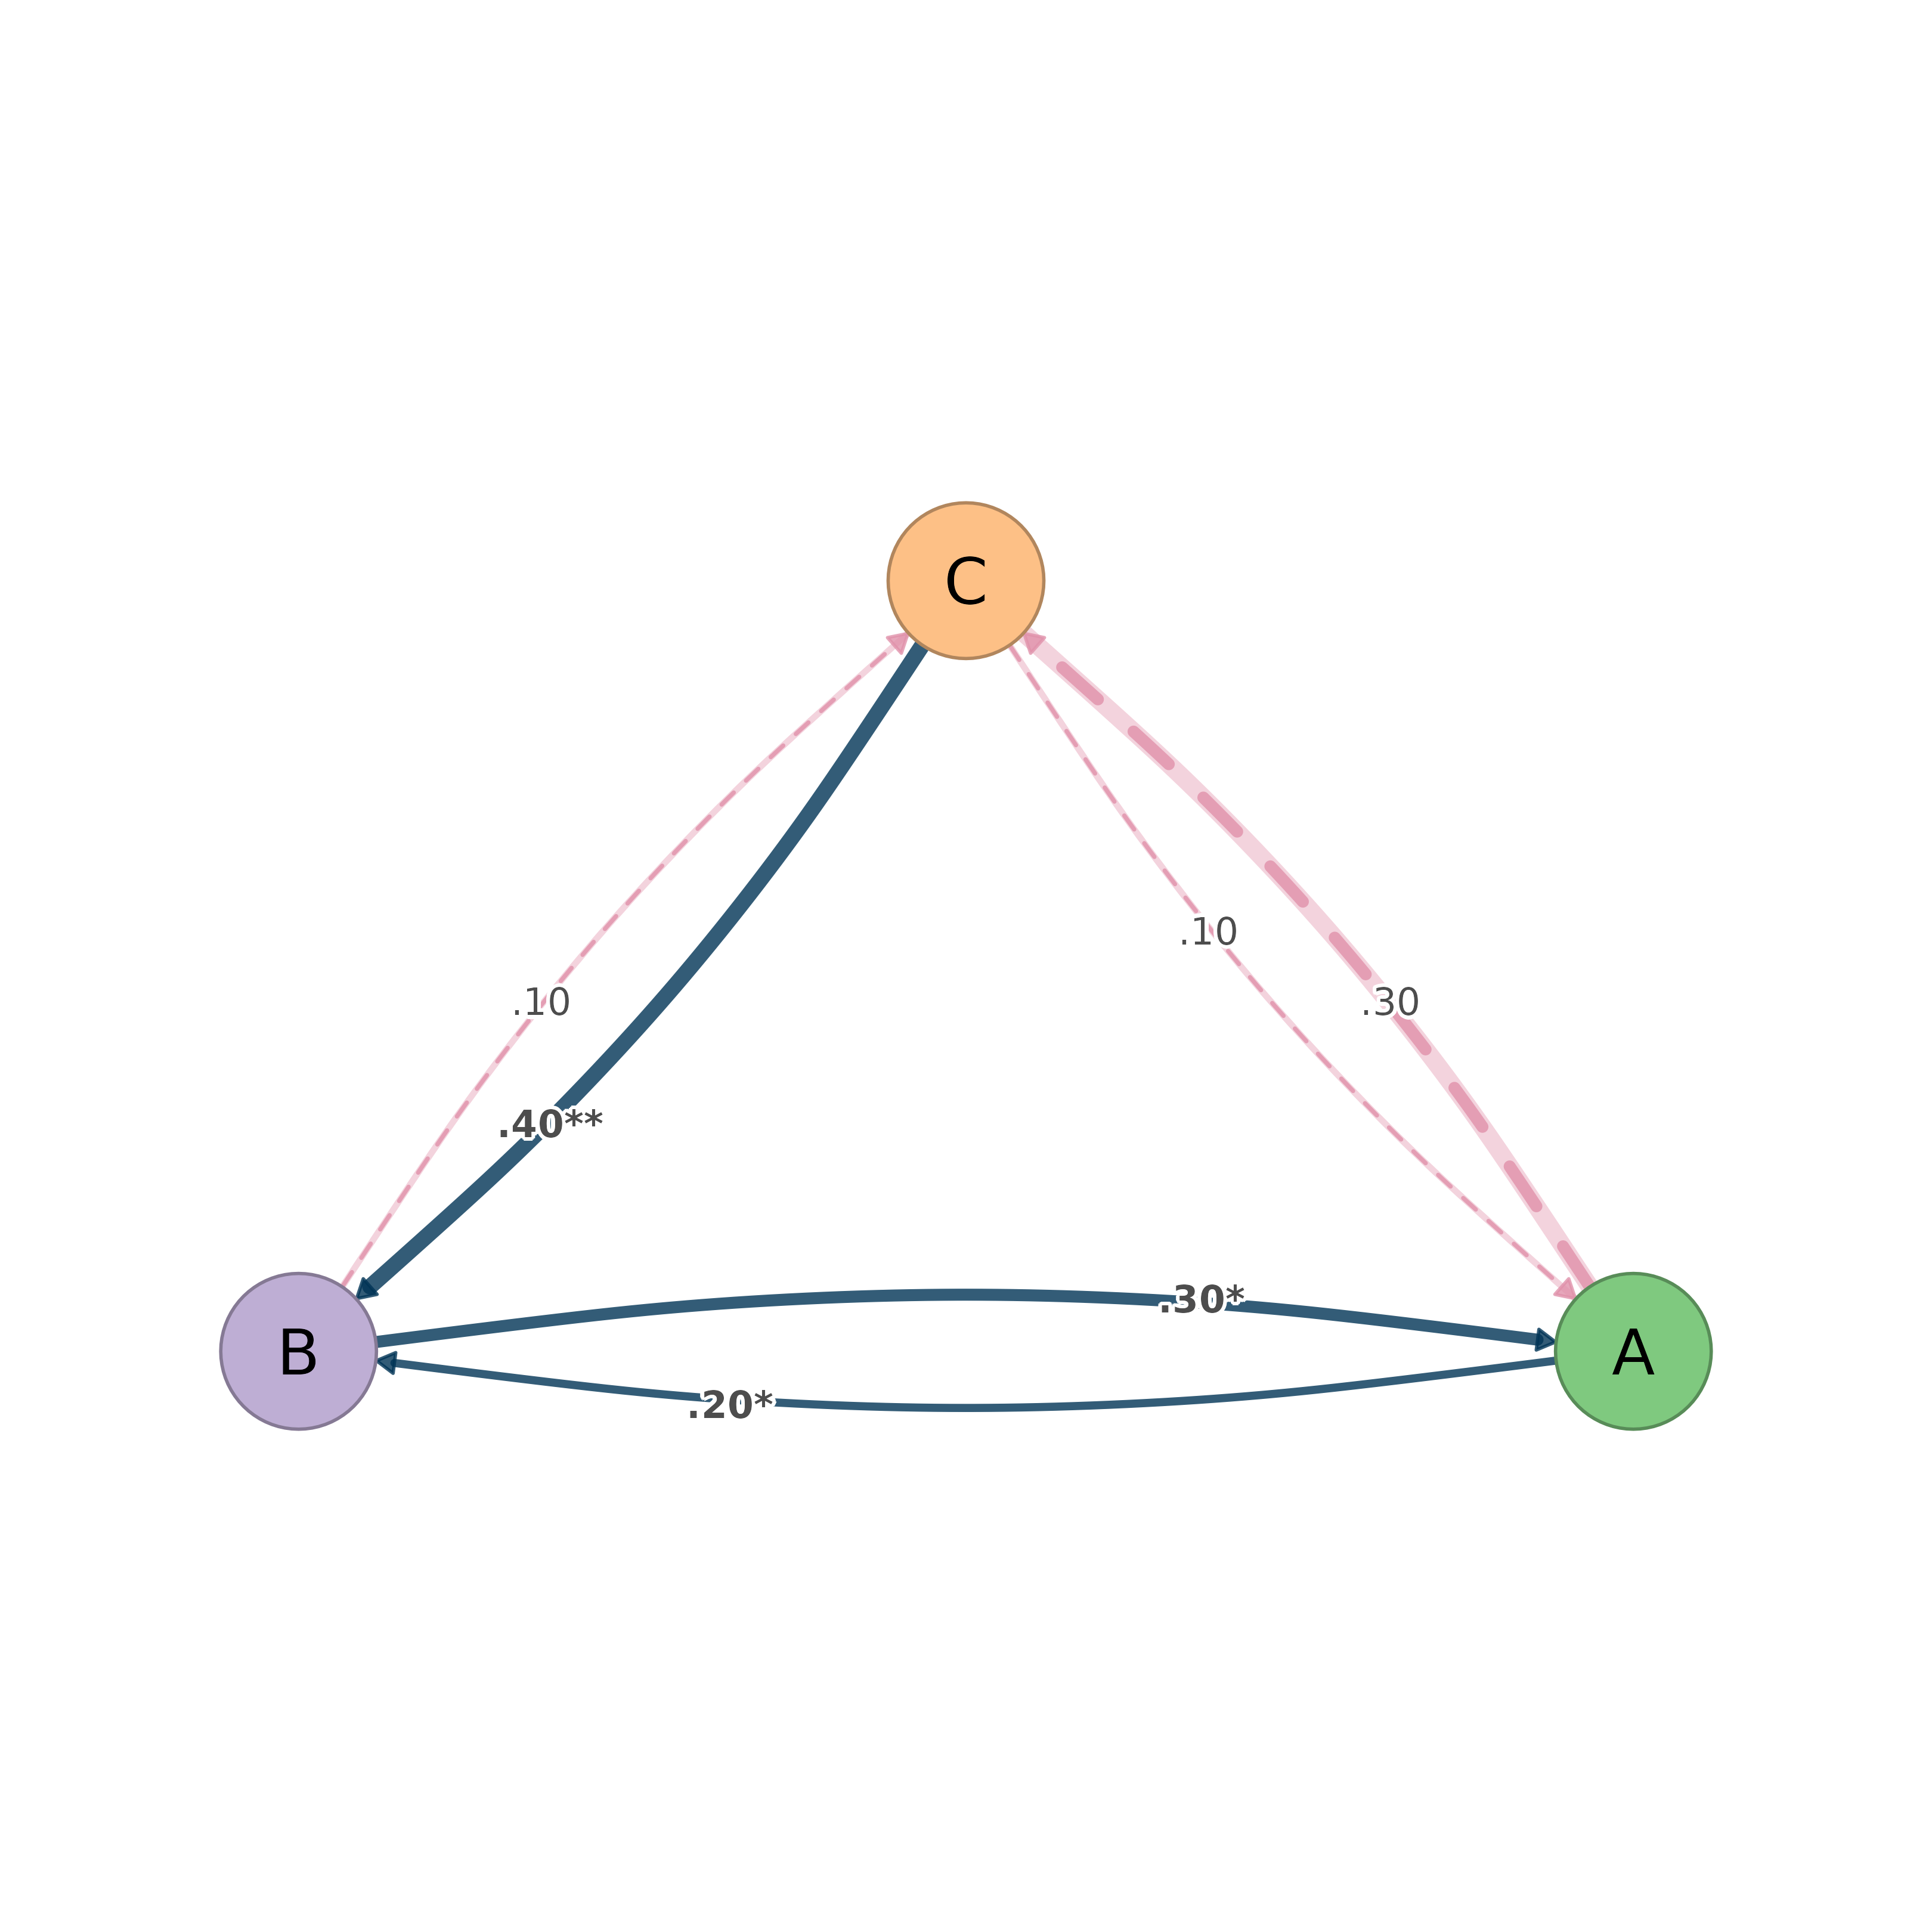
"styled" (default): All edges with styling to distinguish significant/non-significant
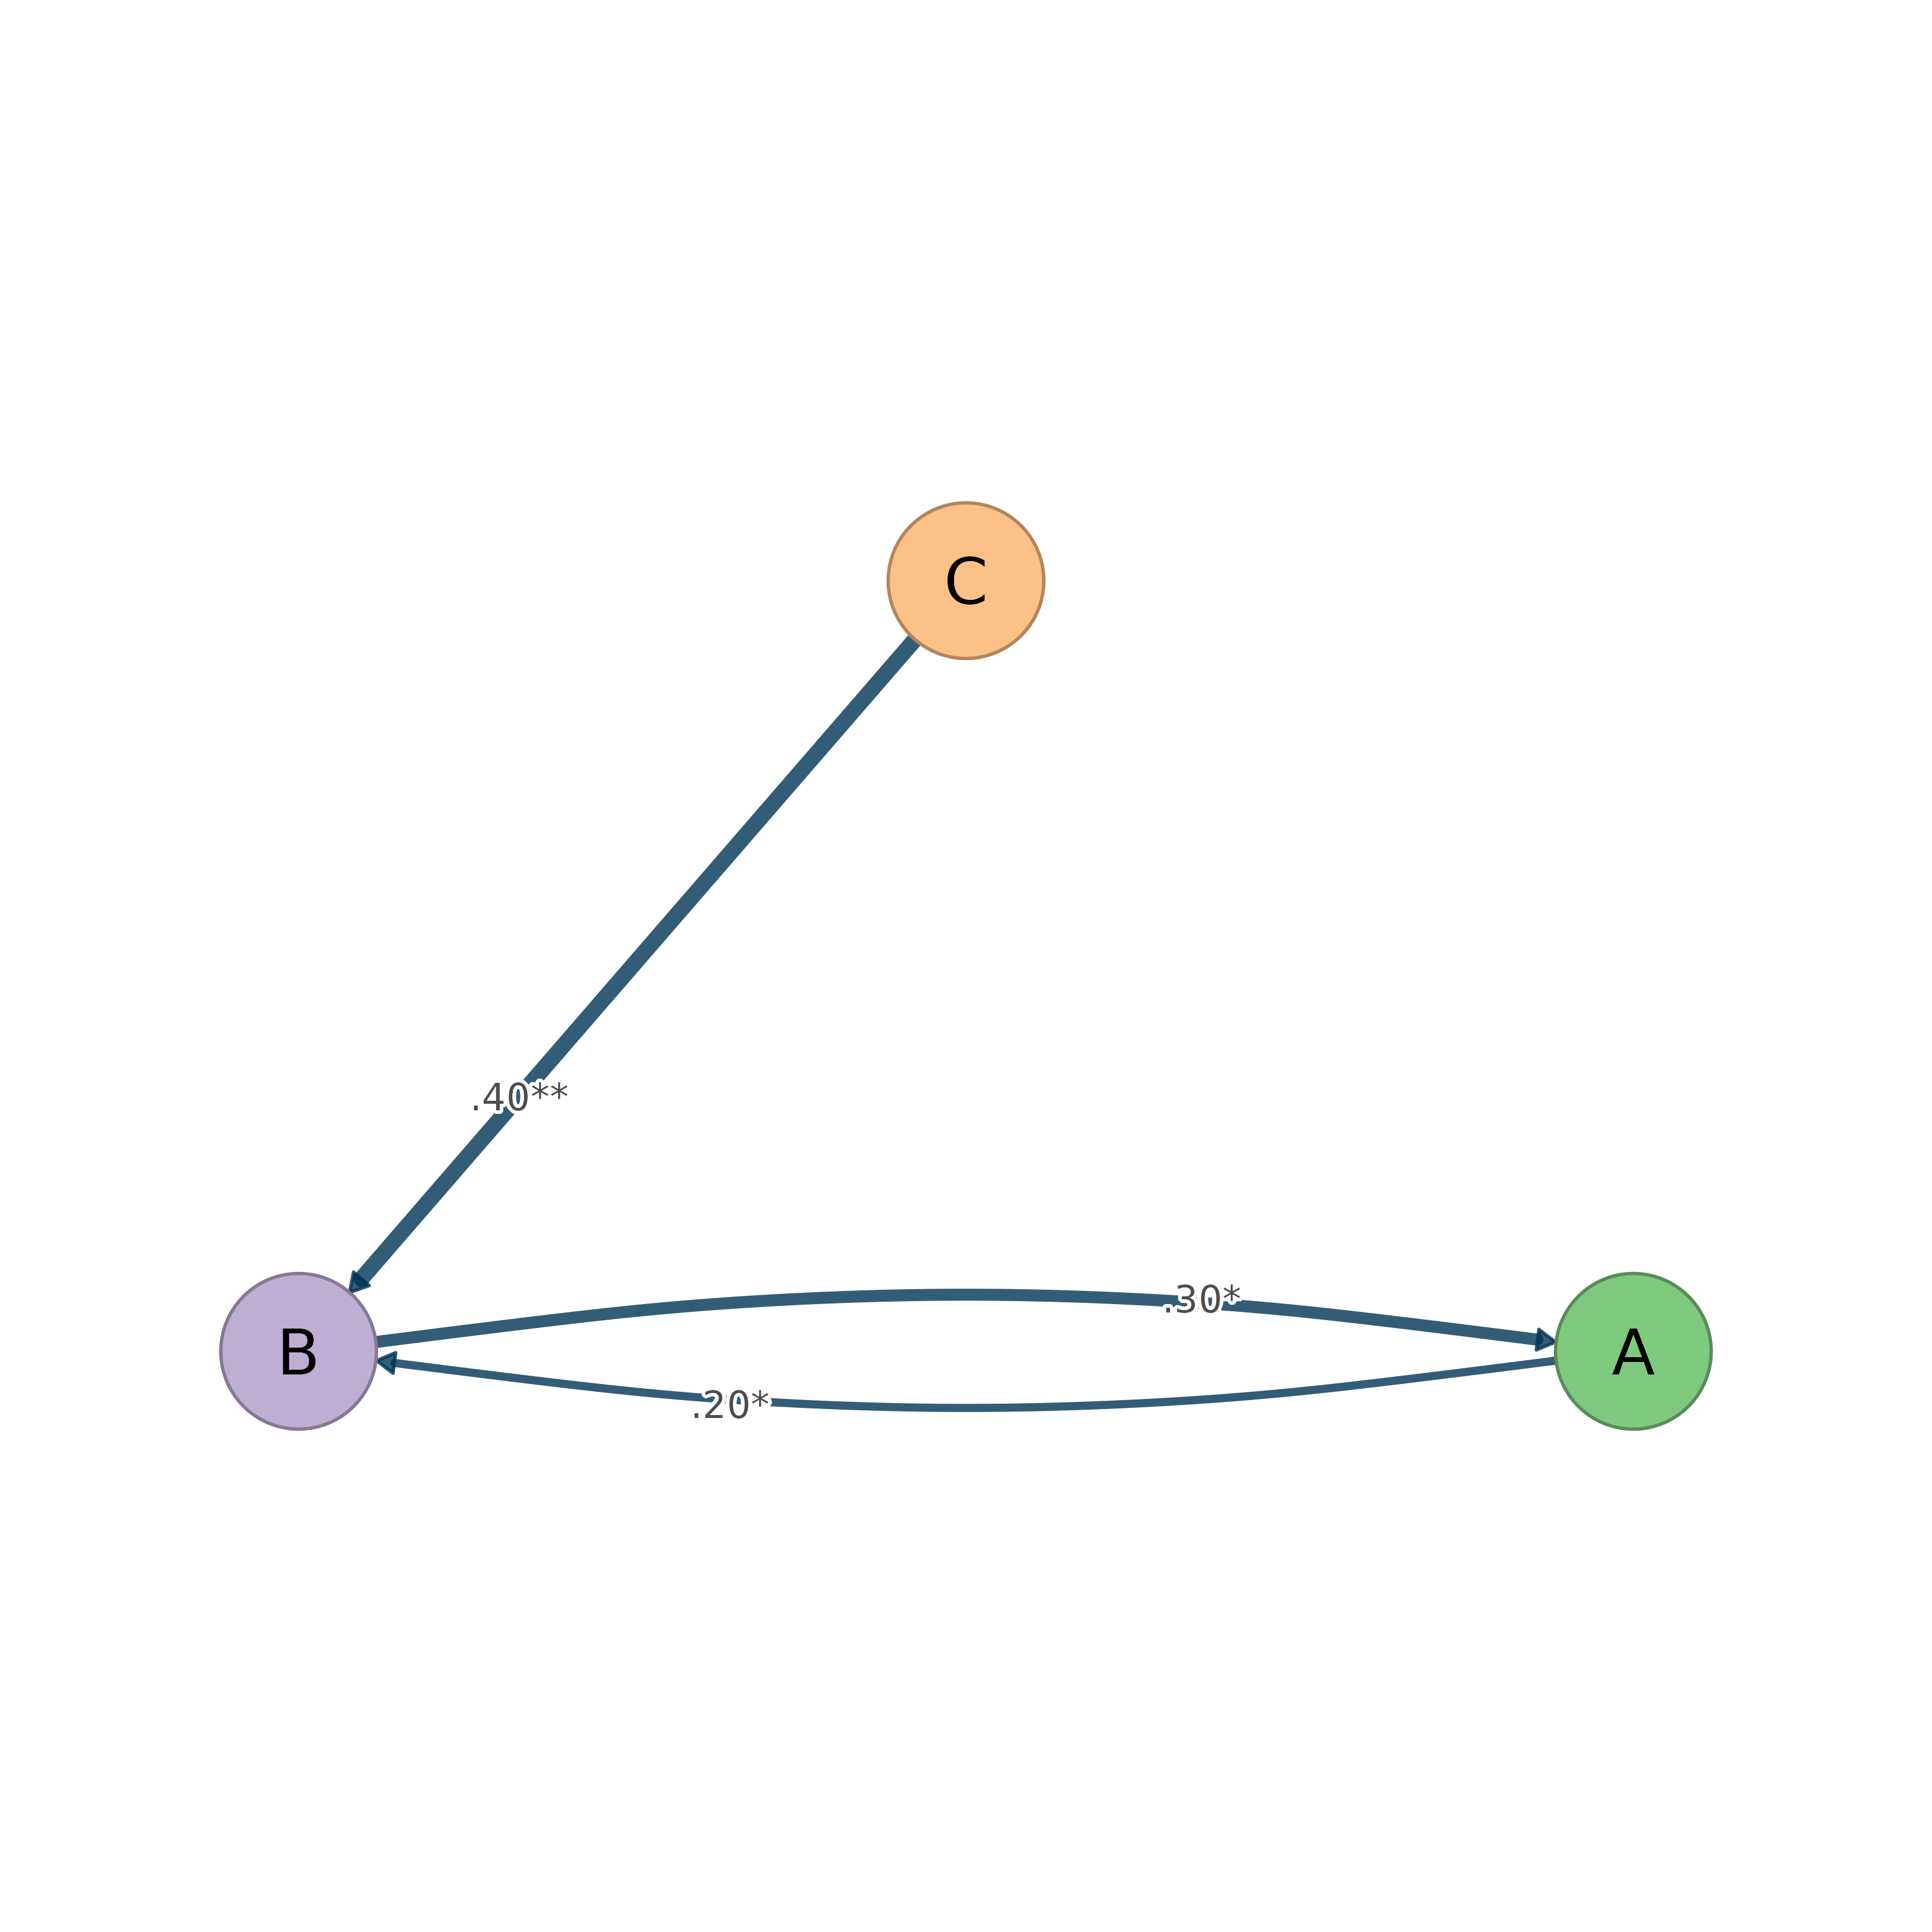
"significant": Only significant edges
"full": All edges without significance styling
"ci": Show CI bands on edges
- edge_style_sig
Line style for significant edges (1=solid). Default 1.
- edge_style_nonsig
Line style for non-significant edges (2=dashed). Default 2.
- color_nonsig
Accepted for compatibility; styled mode currently uses a fixed pink color for non-significant edges.
- show_ci
Logical: include CI bounds in edge labels? Default FALSE. Use
display = "ci"for CI underlays on edges.- show_stars
Logical: show significance stars (*, **, ***) on edges? Default TRUE.
- width_by
Optional: "cr_lower" to scale edge width by lower consistency range bound.
- inherit_style
Logical: inherit colors/layout from original TNA model? Default TRUE.
Details
The function expects a tna_bootstrap object containing:
weightsorweights_orig: Original weight matrixweights_sig: Significant weights only (optional)p_values: P-value matrixci_lower,ci_upper: Confidence interval boundslevel: Significance level (default 0.05)model: Original TNA model for styling inheritance
Edge styling in "styled" mode:
Significant edges: solid dark blue, bold labels with stars, rendered on top
Non-significant edges: dashed pink, plain labels, rendered behind
Examples
# Mock a tna_bootstrap object with synthetic data
w <- matrix(c(0, .3, .1, .2, 0, .4, .3, .1, 0), 3, 3)
rownames(w) <- colnames(w) <- c("A", "B", "C")
p <- matrix(c(1, .01, .5, .03, 1, .001, .2, .8, 1), 3, 3)
boot <- list(weights = w, p_values = p,
             ci_lower = w - 0.05, ci_upper = w + 0.05, level = 0.05,
             model = list(weights = w, labels = c("A", "B", "C")))
class(boot) <- c("tna_bootstrap", "list")
splot(boot)

splot(boot, display = "significant")