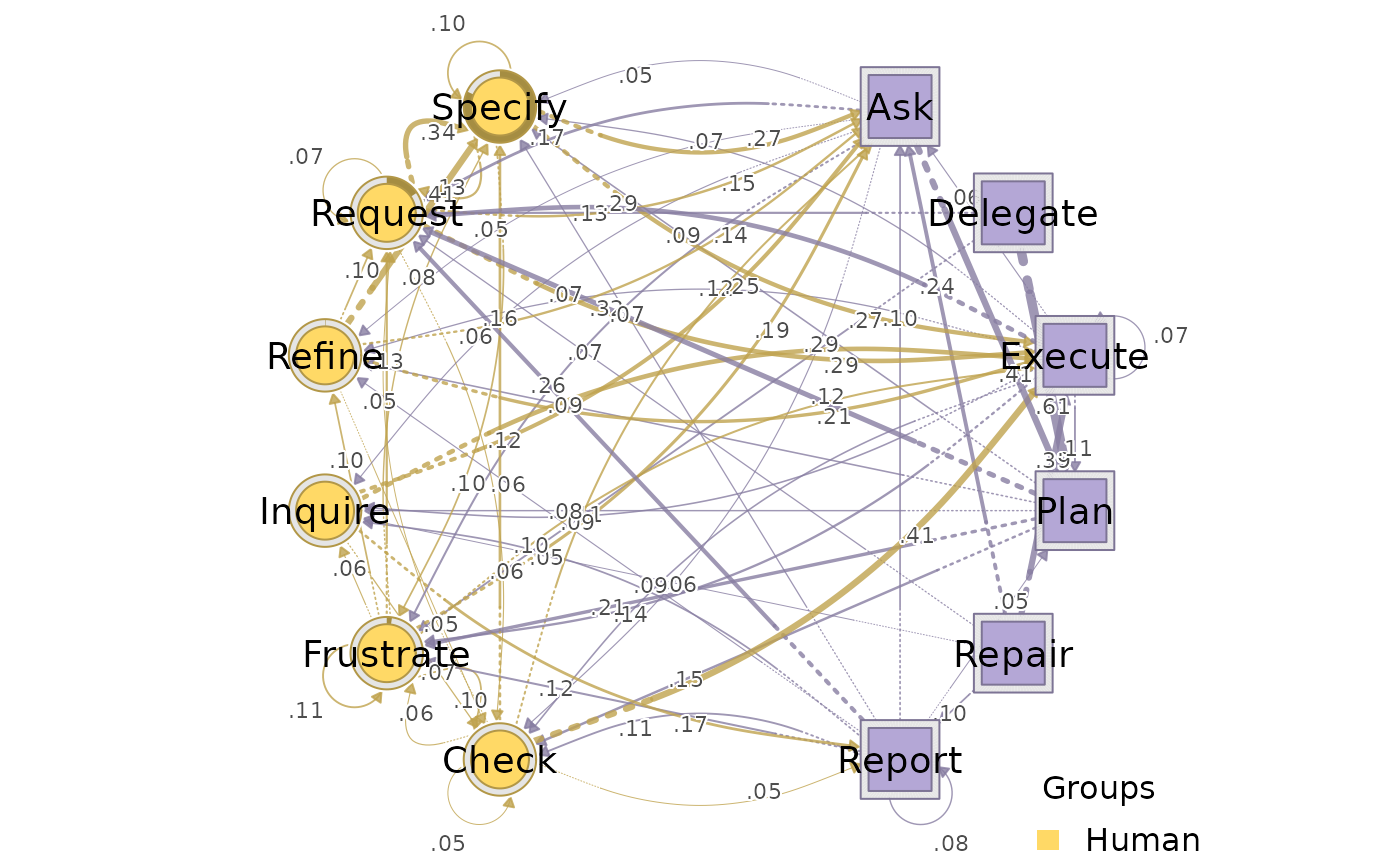
Wrapper around cograph::plot_htna() with defaults suited for HTNA
networks built by build_htna(). The drawing itself is done by cograph;
this function supplies the actor-aware styling: one colour and shape per
actor group, darkened donut borders, and an actor legend. For the
circular layout (and "auto" with two or more groups) the group order
is arranged so that the first actor group appears on the left.
Arguments
- x
A network produced by
build_htna(), or anhtna_group.- layout
Character. Layout algorithm. Default
"circular".- group_colors
Character vector of colours, one per actor group. Defaults to the built-in htna_palette.
- group_shapes
Character vector of node shapes, one per actor group. Defaults to the built-in
htna_shape_palette.- minimum
Numeric. Minimum absolute edge weight to display. Edges below this threshold are hidden. Default
0.05.- ...
Additional arguments passed to
cograph::plot_htna()(and from there tocograph::splot()), e.g.title.
Value
Called for its side effect (a plot). For a single network,
invisibly, the value returned by cograph::plot_htna(); for an
htna_group, x invisibly.
Details
For an htna_group (or any plain list of htna networks) one plot is
drawn per cohort, titled with the cohort name. The function does not
manage the panel grid; wrap the call in par(mfrow = ...) for a panel.
Examples
data(human_ai)
net <- build_htna(human_ai, actor_type = "actor_type")
#> Metadata aggregated per session: ties resolved by first occurrence in 'session_date' (1 sessions), 'cluster' (42 sessions), 'actor_type' (24 sessions)
plot_htna(net)
 plot_htna(net, layout = "auto", minimum = 0.1)
 plot(net) # the plot() method calls plot_htna()