Renders the bootstrap result via cograph::splot.net_bootstrap() so the
CI / significance / dashed-edge overlay is preserved, but overrides the
layout and node styling to match plot_htna() (multi-group circular
layout, warm htna_palette, darkened donut).
Usage
plot_htna_bootstrap(boot, group_colors = htna_palette, ...)

# S3 method for class 'htna_bootstrap'
plot(x, ...)
Arguments
- boot
An object from
bootstrap_htna()(or ahtna_bootstrap_grouplist of them).- group_colors
Character vector of colours, one per actor group. Defaults to the built-in htna_palette.
- ...
Forwarded to
cograph::splot.net_bootstrap()(e.g.display,show_ci,show_stars). User args win.- x
Same as
boot; used when calling via theplot()generic.
Value
The value returned by cograph::splot.net_bootstrap()
(invisibly), or the input group invisibly.
Details
For an htna_bootstrap_group (i.e. the result of running
bootstrap_htna() on a build_htna(..., group = ...) output), each
element is plotted individually with its name as the title - this
function does not manage par(mfrow=...).
Examples
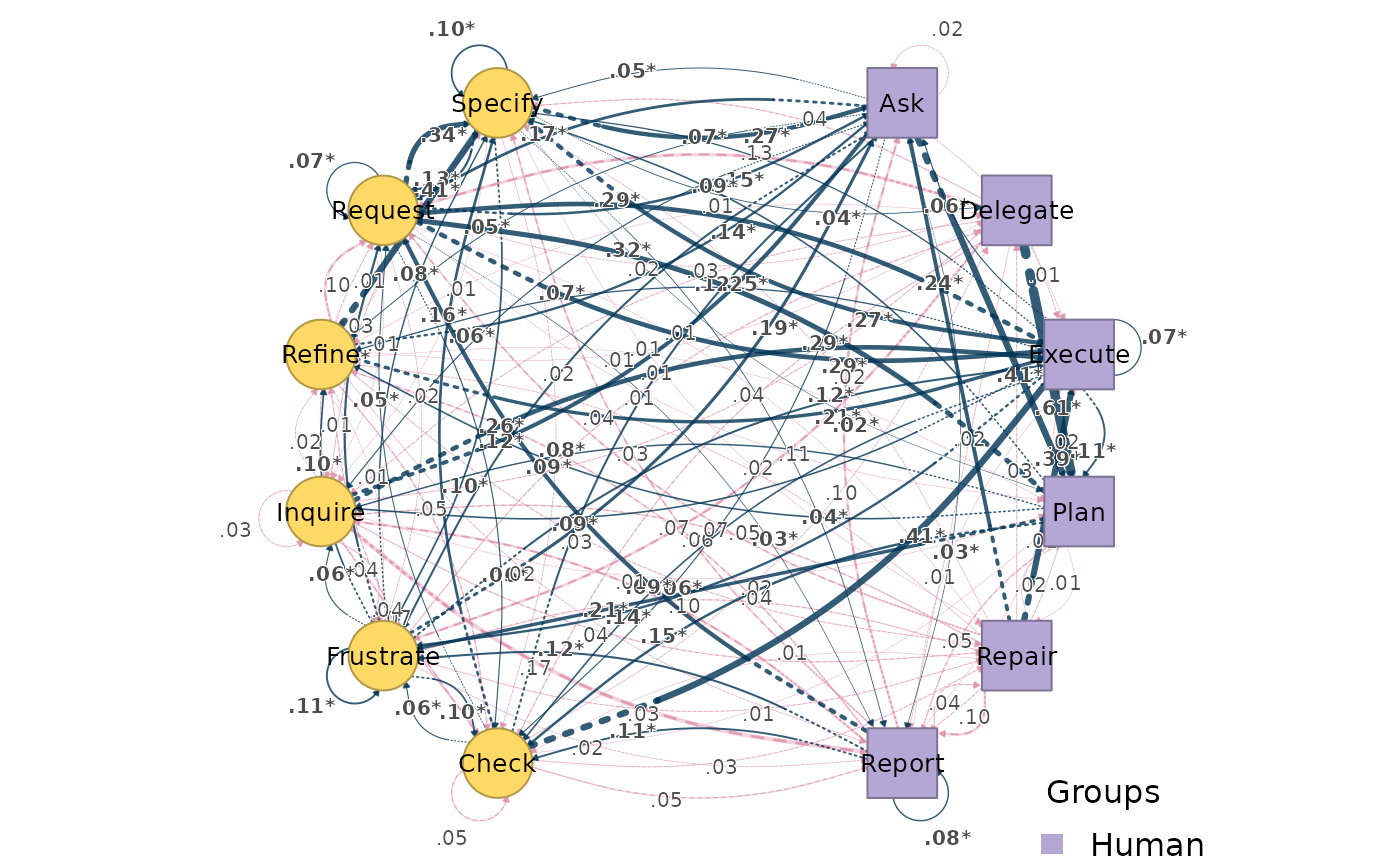
# \donttest{
data(human_ai)
net <- build_htna(human_ai, actor_type = "actor_type")
#> Warning: A network with one long sequence is not recommended and can't be validated using bootstrap and other confirmatory testings.
#> Metadata aggregated per session: ties resolved by first occurrence in 'session_date' (1 sessions), 'cluster' (42 sessions), 'actor_type' (24 sessions)
boot <- bootstrap_htna(net, iter = 50)
plot_htna_bootstrap(boot)
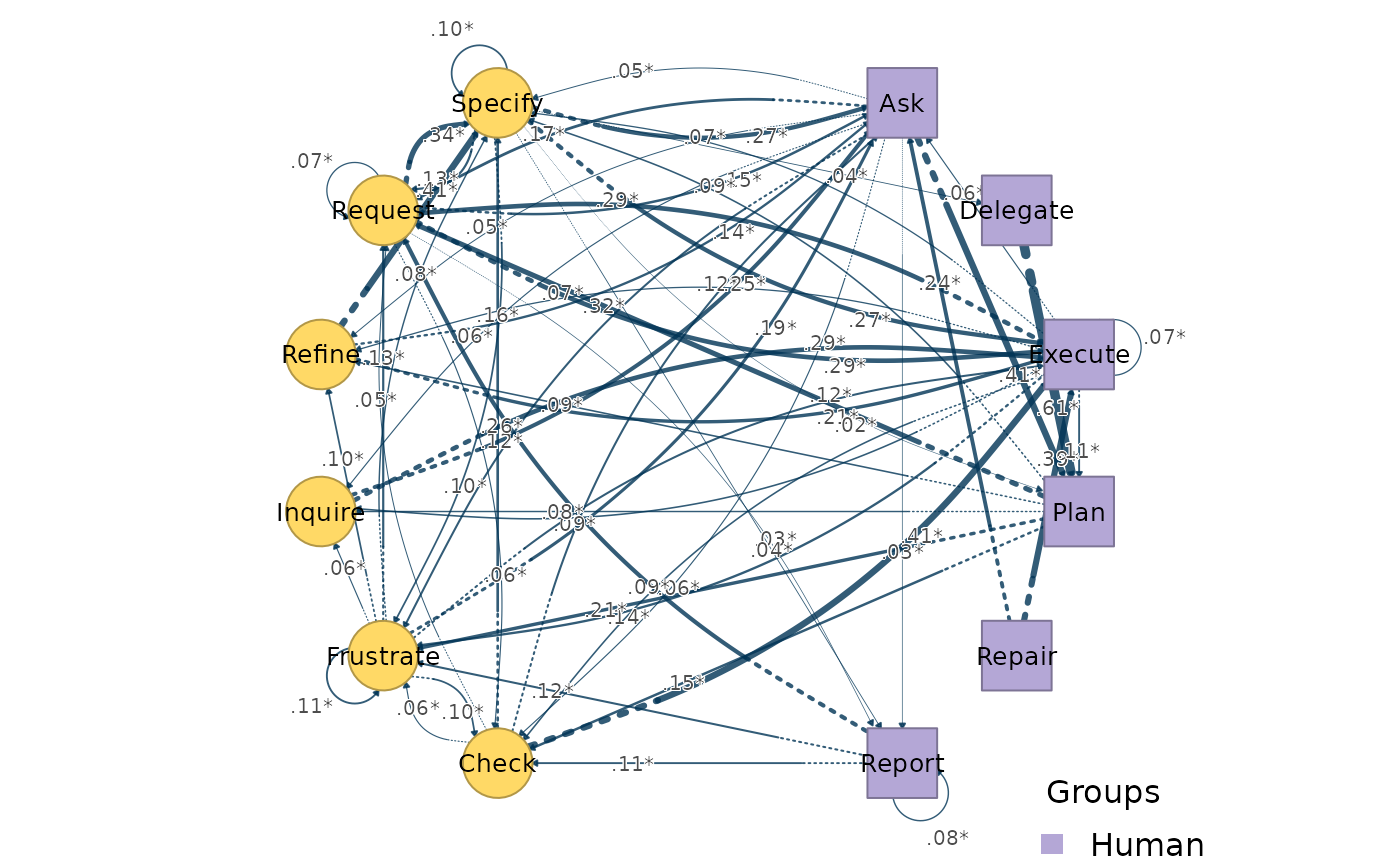
 plot_htna_bootstrap(boot, display = "significant")
 # }
# }