Renders the elementwise edge-weight difference x - y as a heterogeneous
transition network. Accepts:
Usage
plot_htna_diff(
  x,
  y = NULL,
  pos_color = "#009900",
  neg_color = "#C62828",
  group_colors = htna_palette,
  ...
)
Arguments
- x
One of: an htna network, a
net_permutationresult, or anet_permutation_group.- y
htna network (only used when
xis also an htna network).- pos_color
Edge colour for positive differences. Default
"#009900".- neg_color
Edge colour for negative differences. Default
"#C62828".- group_colors
Character vector of colours, one per actor group. Defaults to the built-in htna_palette.
- ...
Forwarded to the underlying splot dispatcher (
cograph::splot()orcograph::splot.net_permutation()).
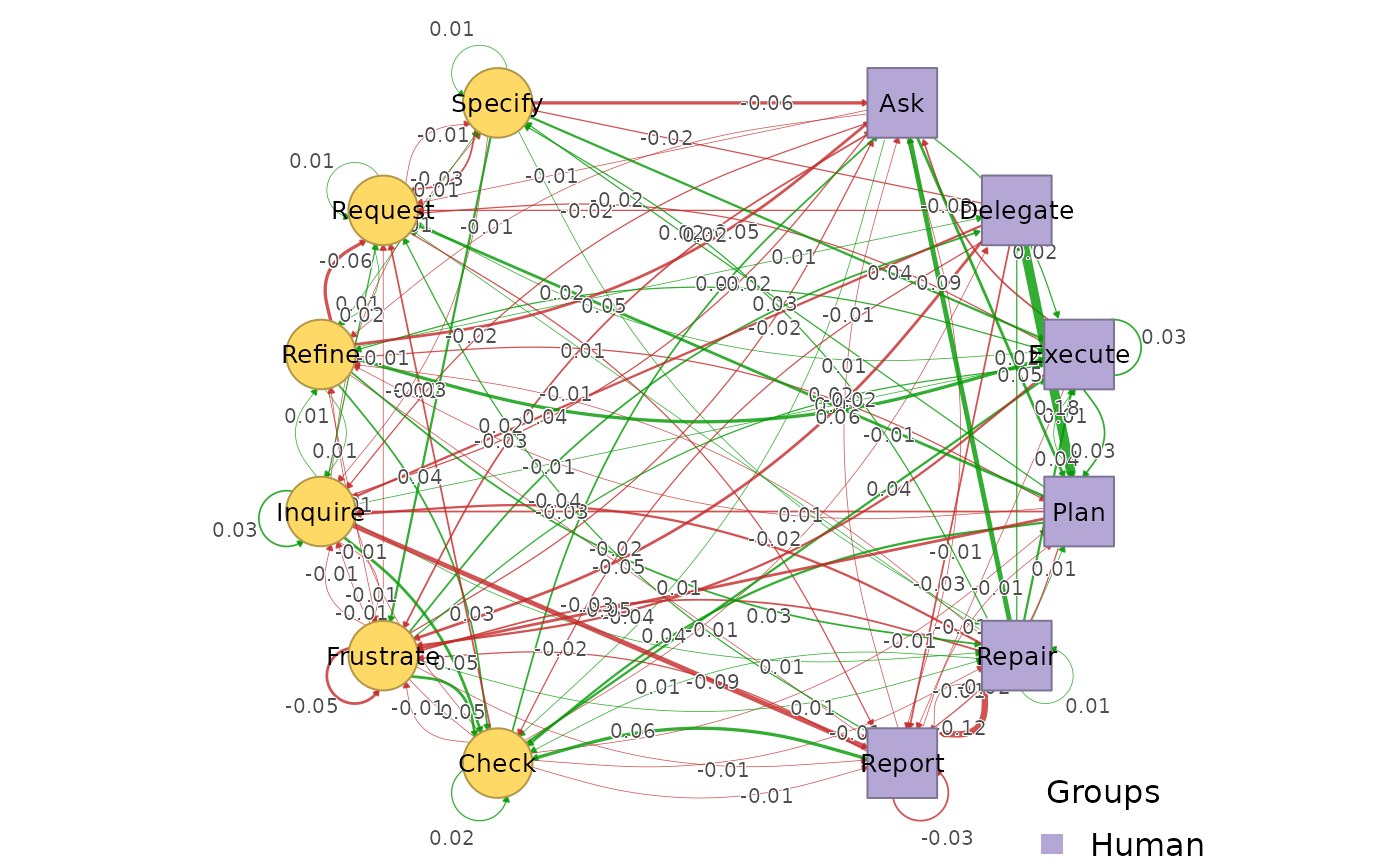
Details
Two htna networks (
x,y): plotsx - yviacograph::splot()with positive/negative edge coloring.A
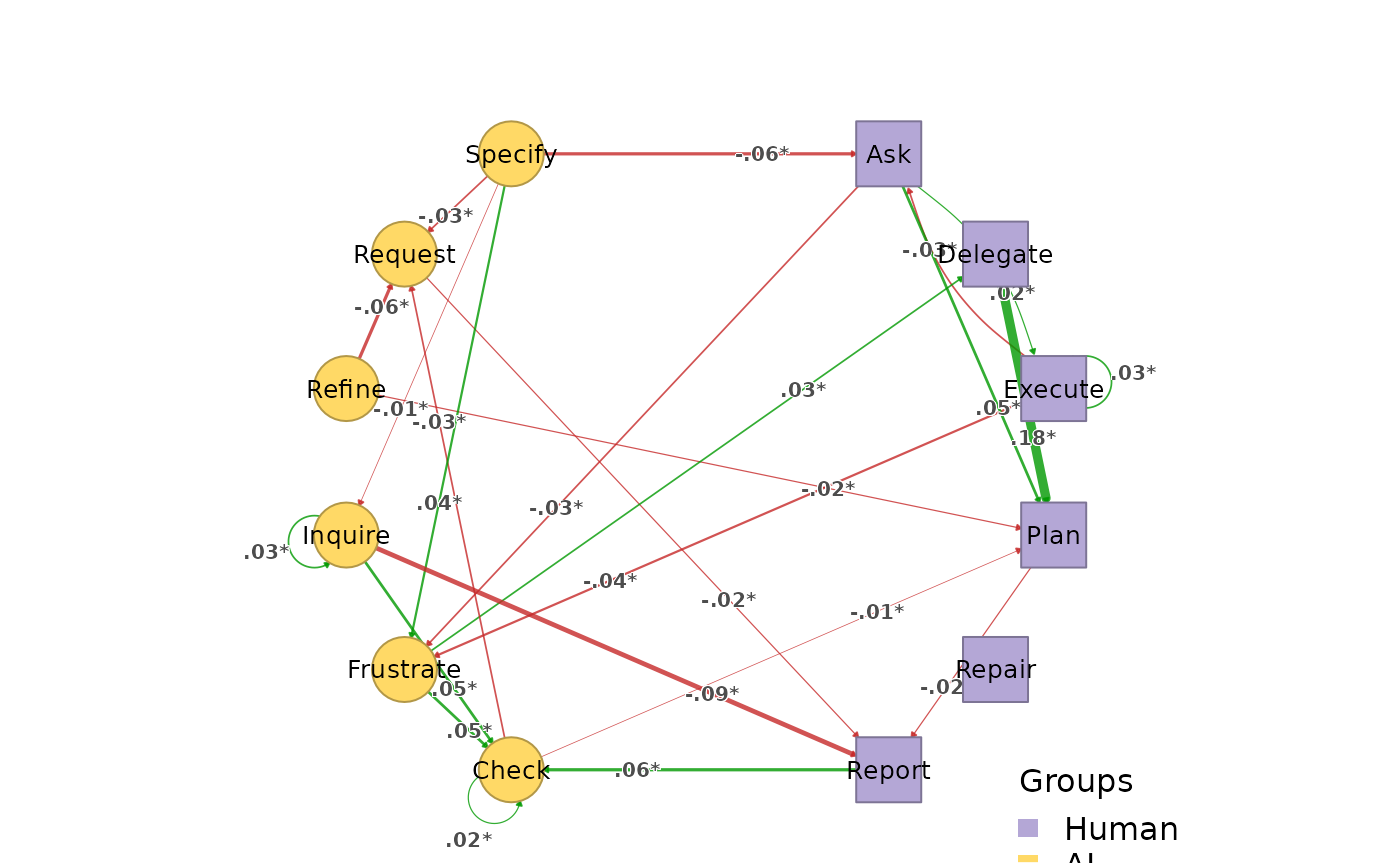
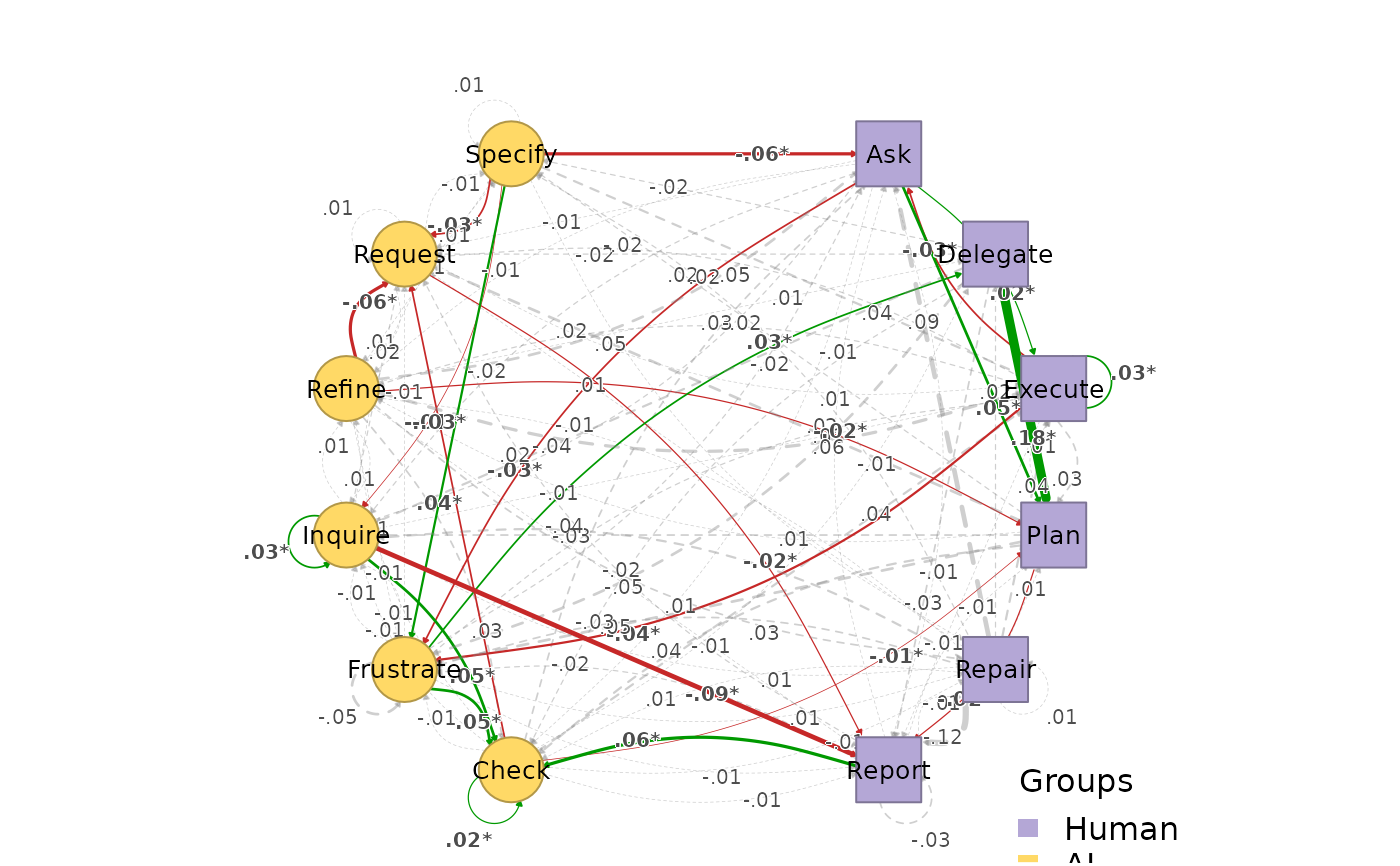
net_permutationresult: routes throughcograph::splot.net_permutation()so the significance overlay (significant pos/neg edges, dashed non-significant edges, stars) is drawn upstream.A
net_permutation_group: iterates over all pairwise comparisons and plots each (nopar(mfrow=...)management - user controls layout).
In all cases the layout, node colours and donut match plot_htna().
Examples
# \donttest{
data(human_ai)
grp <- build_htna(human_ai, actor_type = "actor_type", group = "phase")
#> Warning: A network with one long sequence is not recommended and can't be validated using bootstrap and other confirmatory testings.
#> Metadata aggregated per session: ties resolved by first occurrence in 'cluster' (24 sessions), 'actor_type' (9 sessions)
#> Warning: A network with one long sequence is not recommended and can't be validated using bootstrap and other confirmatory testings.
#> Metadata aggregated per session: ties resolved by first occurrence in 'session_date' (1 sessions), 'cluster' (18 sessions), 'actor_type' (15 sessions)
plot_htna_diff(grp$Early, grp$Late)
 perm <- permutation_htna(grp$Early, grp$Late, iter = 50)
plot_htna_diff(perm)
perm <- permutation_htna(grp$Early, grp$Late, iter = 50)
plot_htna_diff(perm)
 plot_htna_diff(perm, show_nonsig = TRUE)
 # }
# }