Plot a Complete VaSSTra Analysis
Arguments
- x
A
vasstraobject.- which
One of
"trajectories","states", or"sequences".- ...
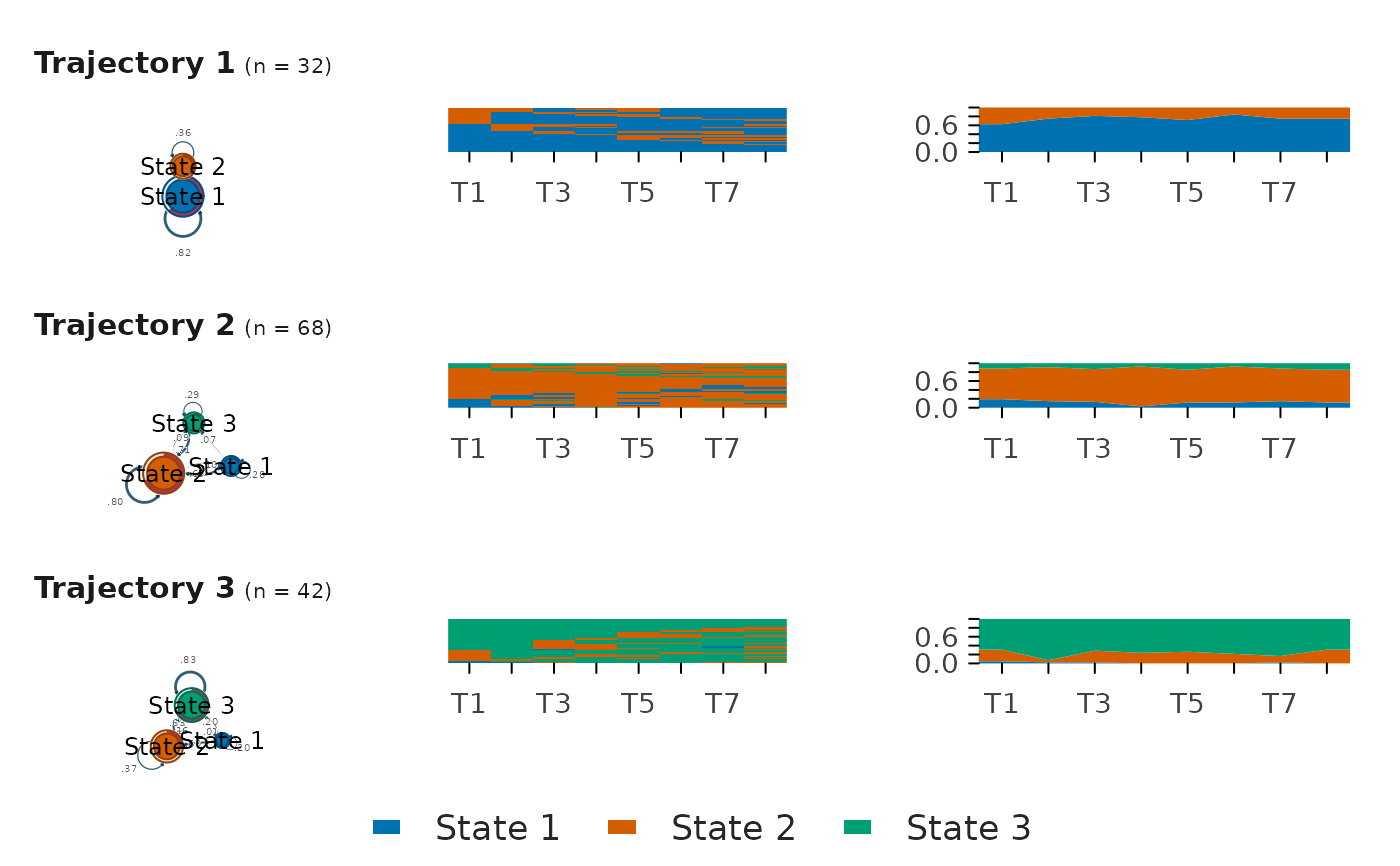
Passed to the selected step's plot method. Sequence and trajectory plots are rendered by Nestimate. For the trajectory step,
typeaccepts a vector of views (e.g.type = c("transition", "index", "distribution")) to draw a grid with one row per trajectory; seeplot.vasstra_trajectories().
Examples
data("engagement", package = "VaSSTra")
fit <- vasstra(engagement, n_states = 3, n_trajectories = 3)
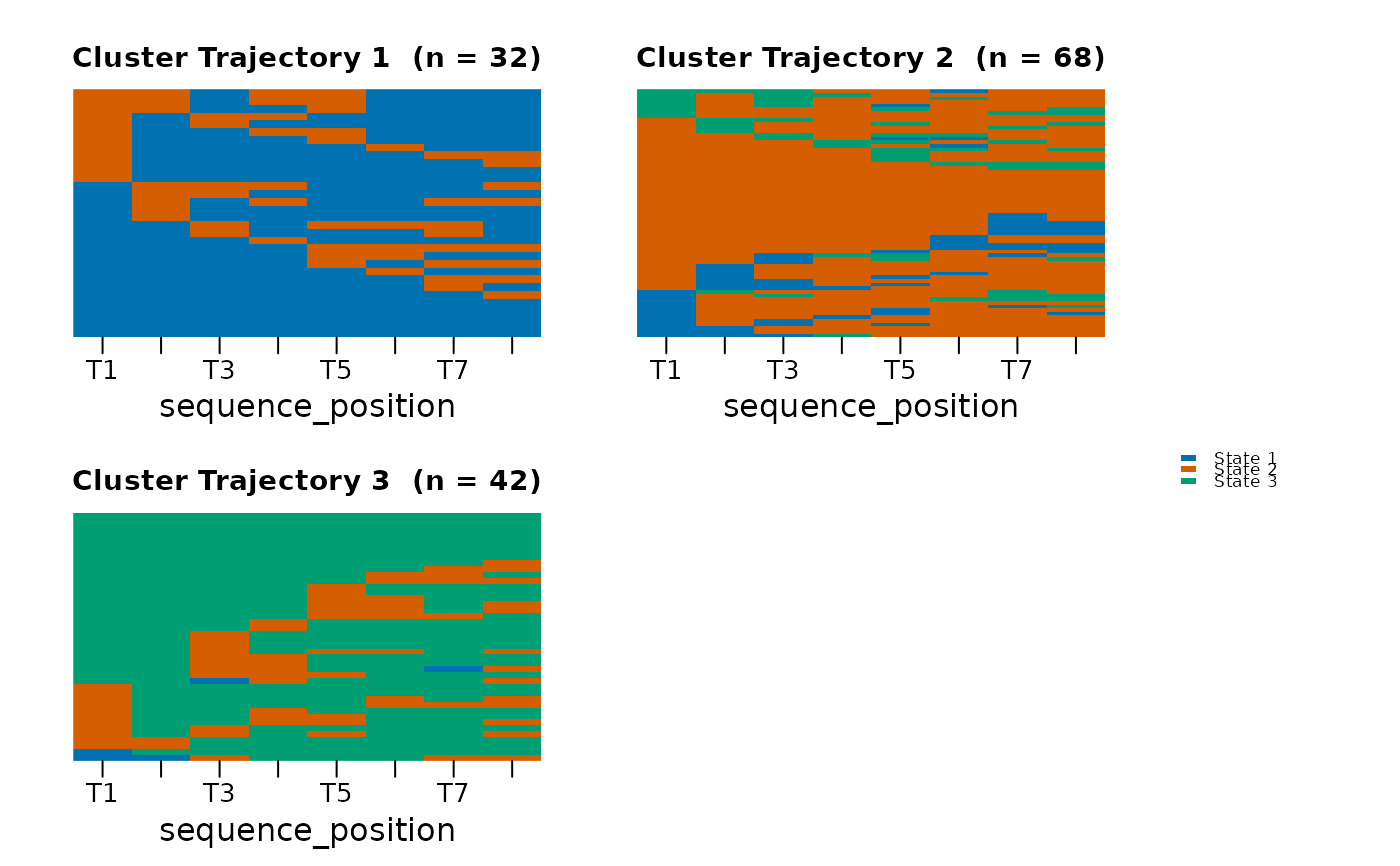
plot(fit)
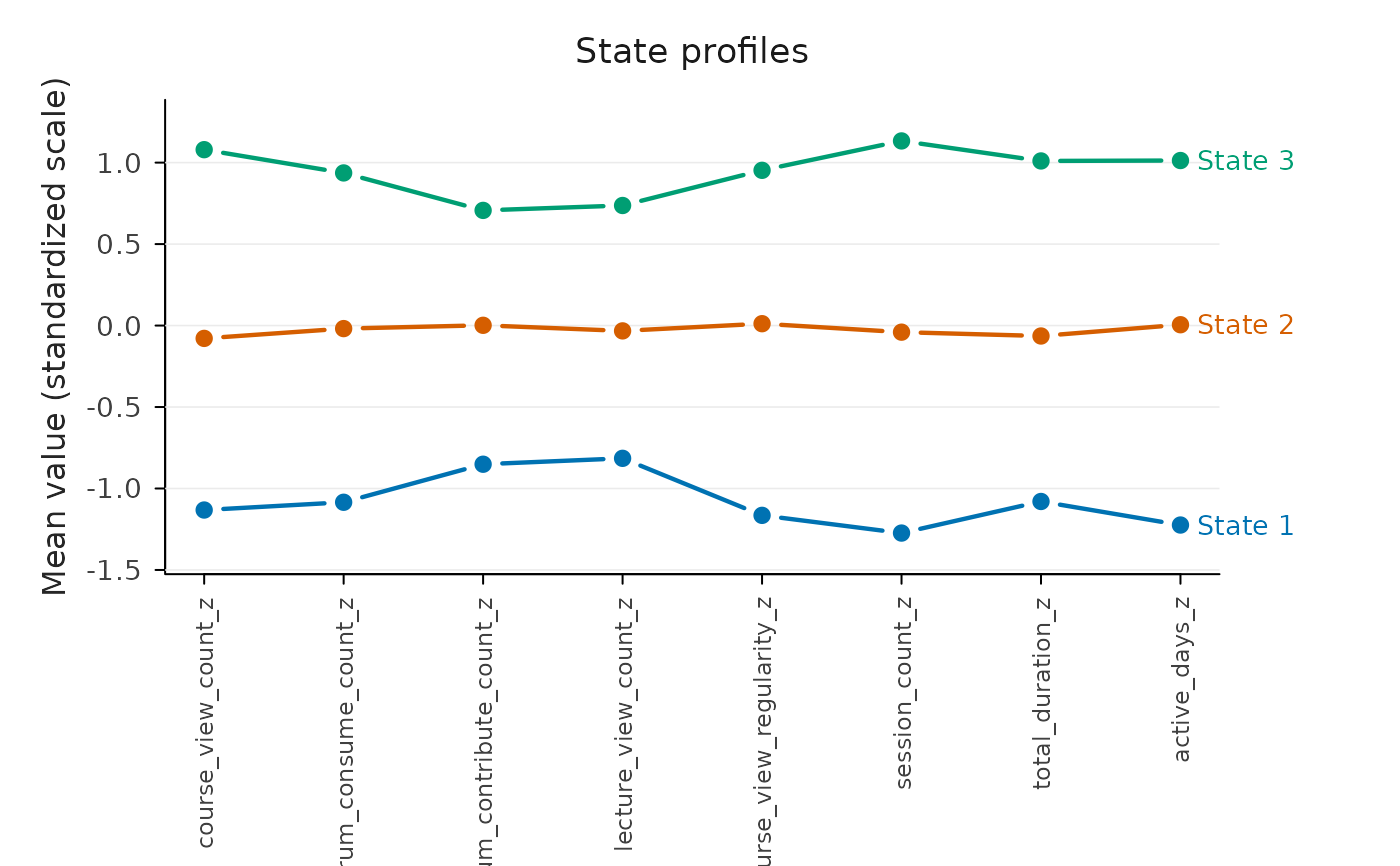
 plot(fit, which = "states", type = "profile")
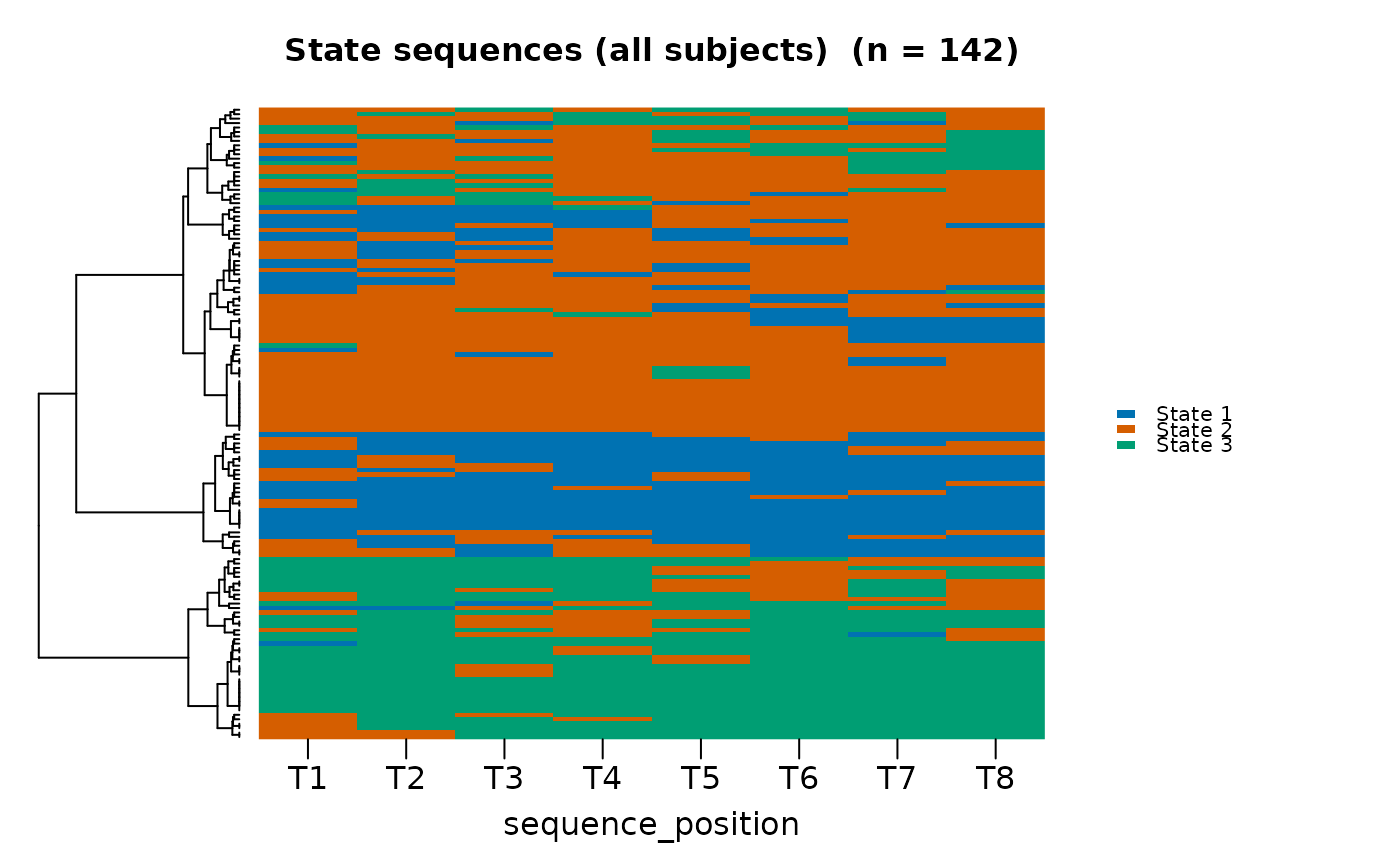
 plot(fit, which = "sequences")
 # \donttest{
if (requireNamespace("cograph", quietly = TRUE)) {
plot(fit, type = c("transition", "index", "distribution"))
}
# \donttest{
if (requireNamespace("cograph", quietly = TRUE)) {
plot(fit, type = c("transition", "index", "distribution"))
}
 # }
# }