Render a network with splot and overlay smooth blob
shapes highlighting node communities.
Usage
overlay_communities(
  x,
  communities,
  blob_colors = NULL,
  blob_alpha = 0.25,
  blob_linewidth = 0.7,
  blob_line_alpha = 0.8,
  ...
)
Arguments
- x
A network object passed to
splot:tna, matrix,igraph, orcograph_network.- communities
Community assignments in any format: a method name (e.g.,
"walktrap","louvain"), a numeric membership vector (e.g.,c(1, 1, 2, 2, 3)), a named list of character vectors, acograph_communitiesobject, or atna_communitiesobject.- blob_colors
Character vector of fill colors for blobs. Recycled if shorter than the number of communities.
- blob_alpha
Numeric. Fill transparency (0-1).
- blob_linewidth
Numeric. Border line width.
- blob_line_alpha
Numeric. Border line transparency (0-1).
- ...
Additional arguments passed to
splot.
Examples
if (FALSE) { # \dontrun{
mat <- matrix(runif(25), 5, 5,
dimnames = list(LETTERS[1:5], LETTERS[1:5]))
diag(mat) <- 0
overlay_communities(mat, list(g1 = c("A", "B"), g2 = c("C", "D", "E")))
} # }
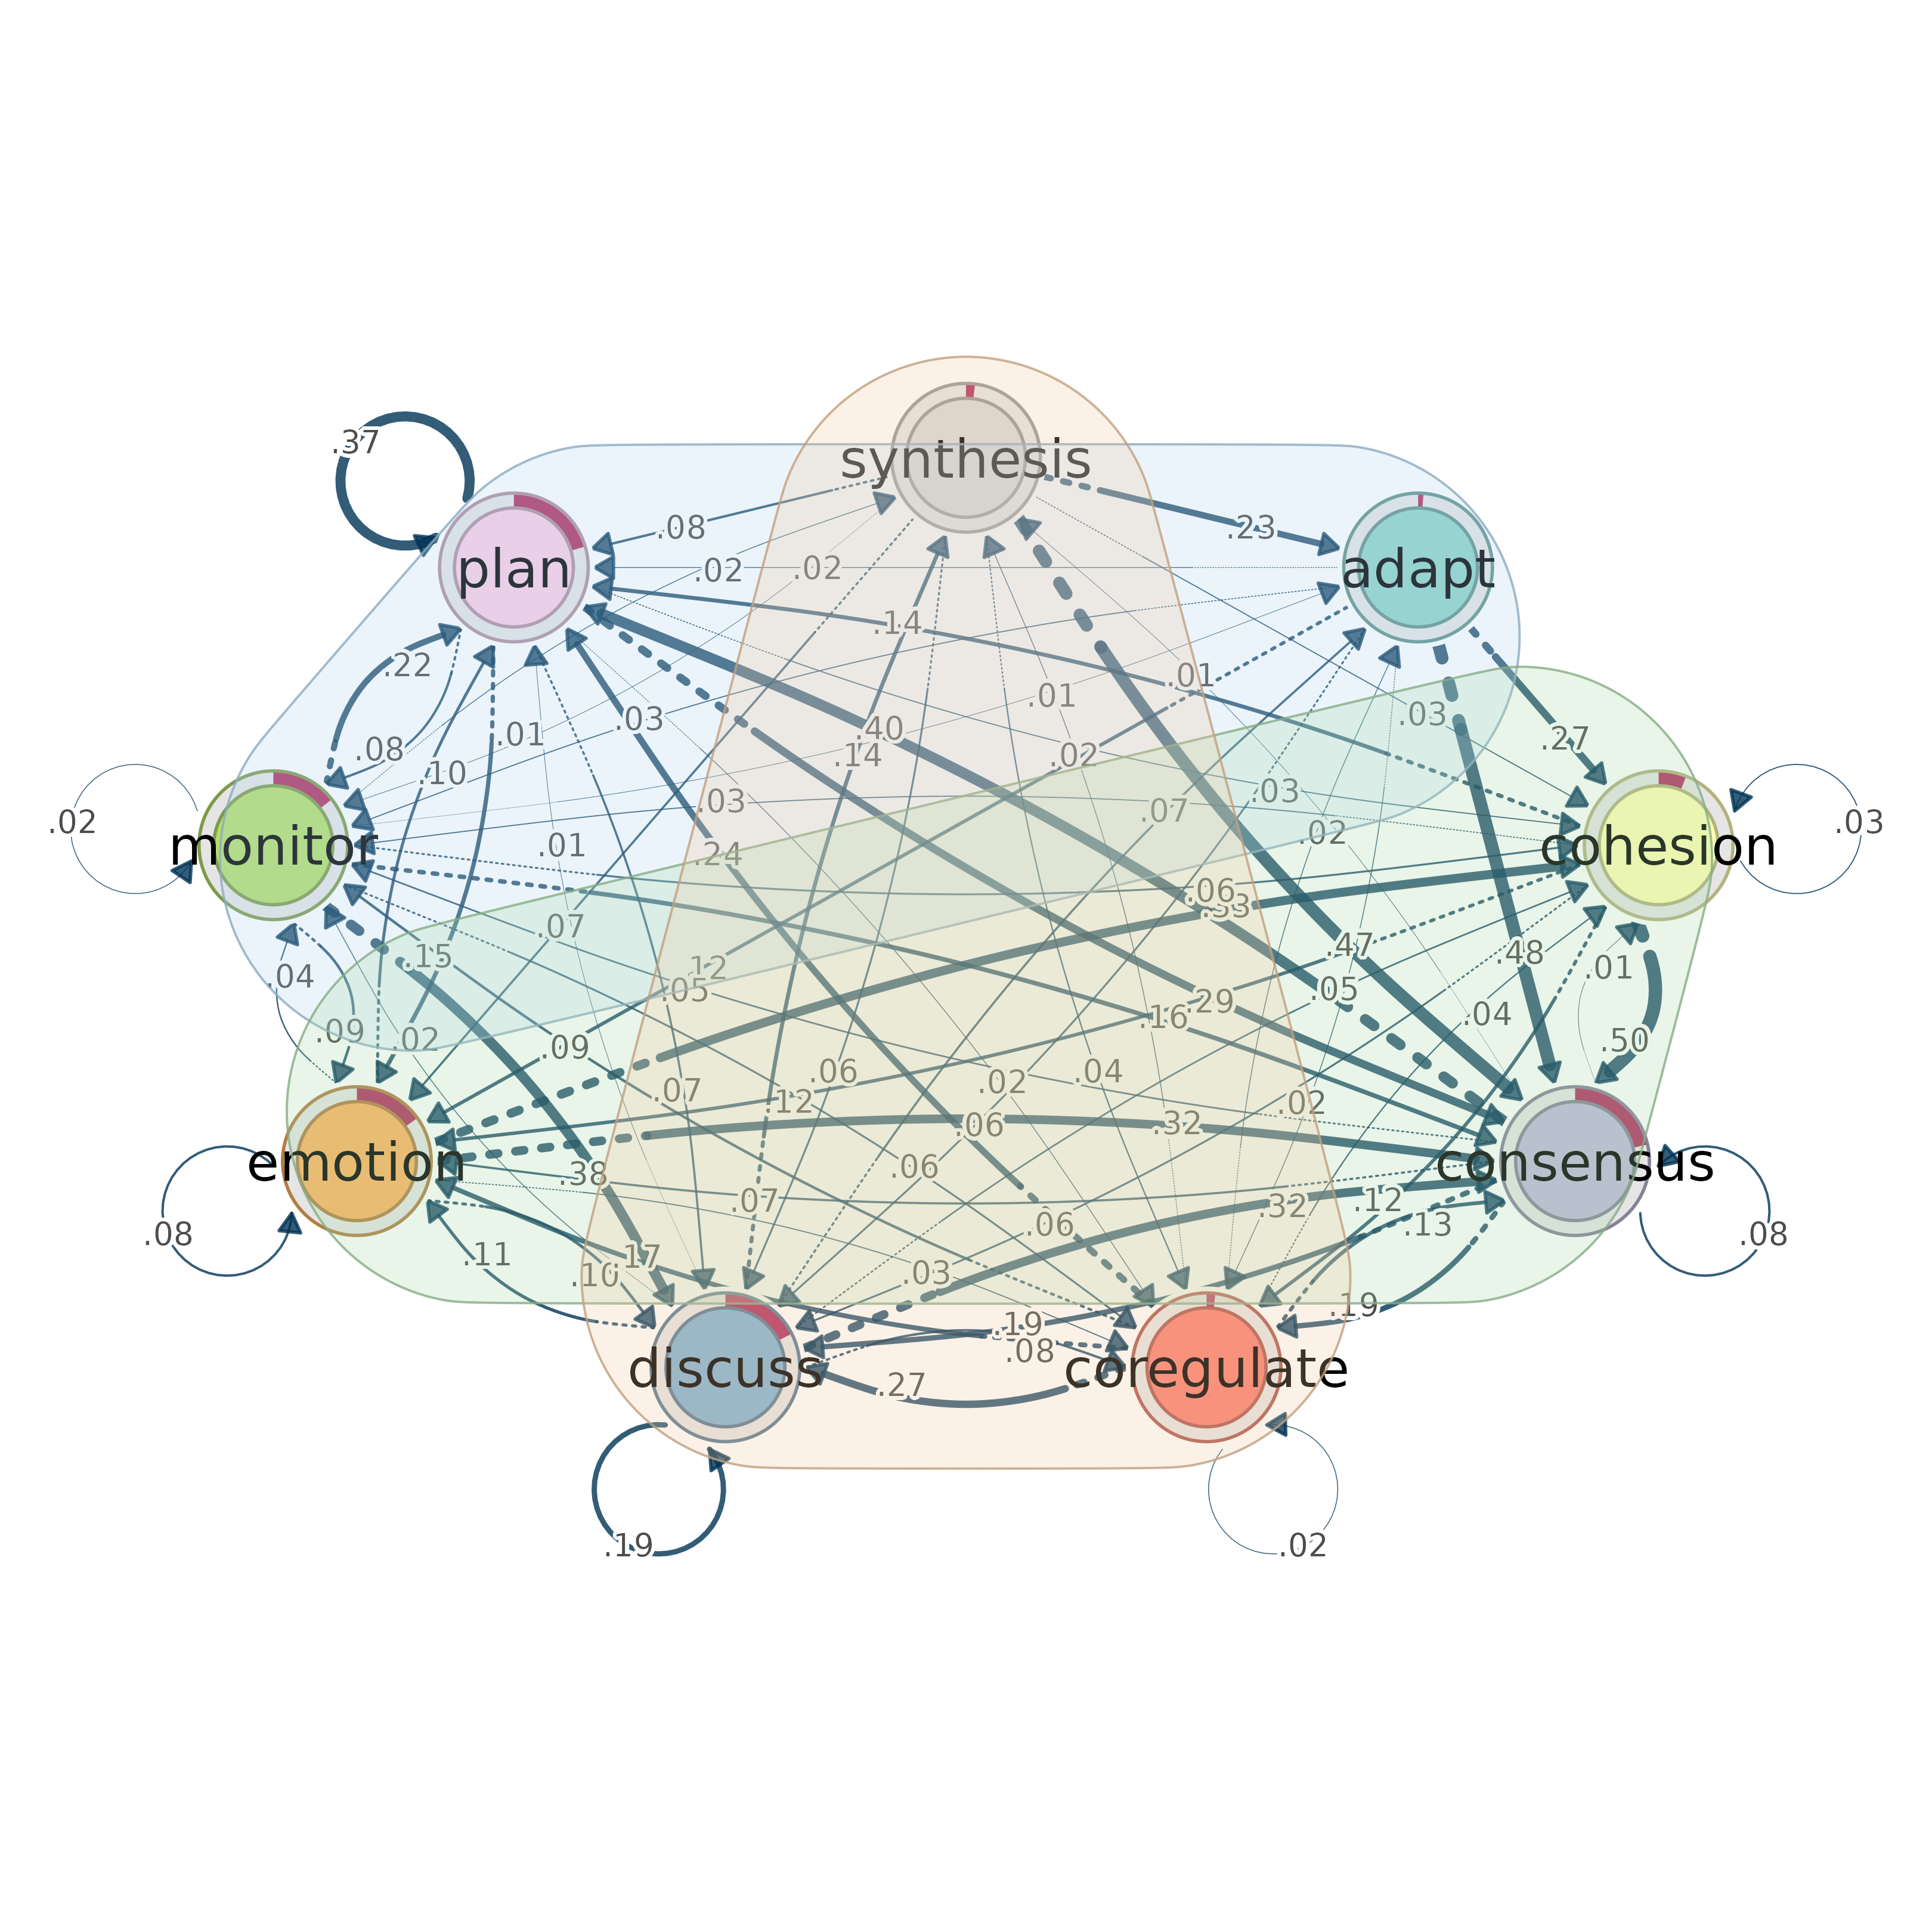
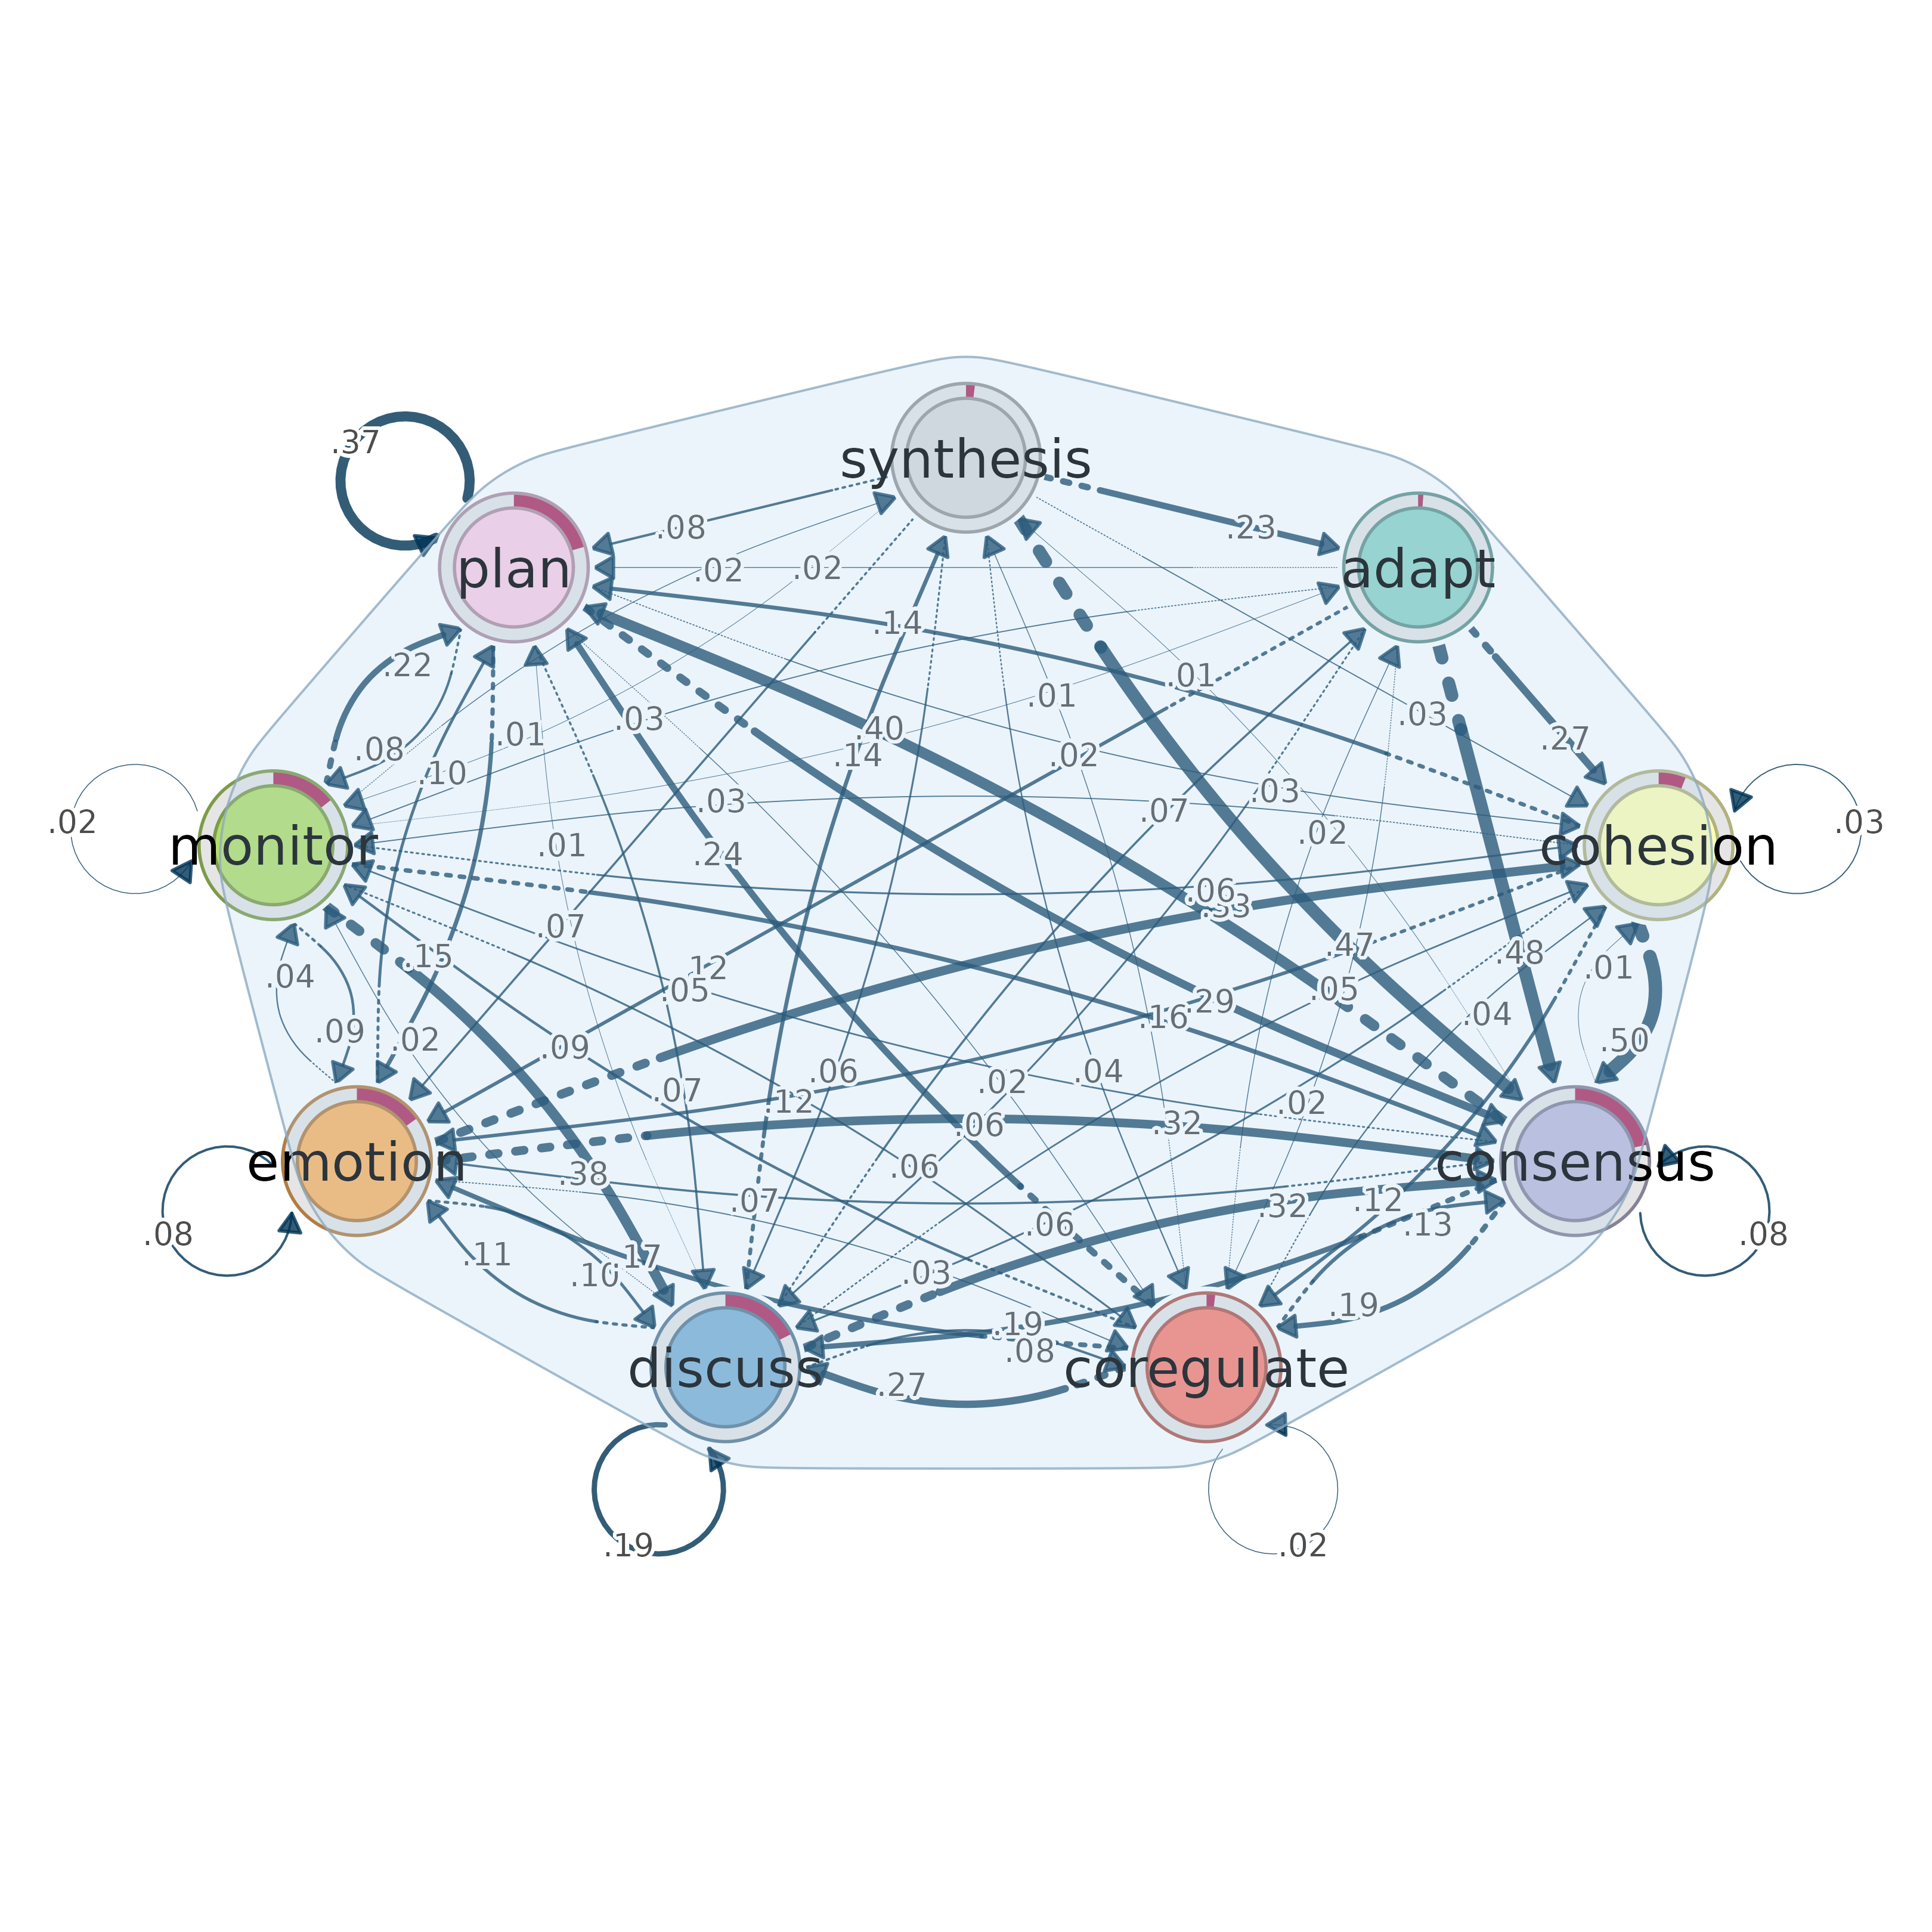
if (requireNamespace("tna", quietly = TRUE)) {
model <- tna::tna(tna::group_regulation)
# With a named list
overlay_communities(model, list(
Regulatory = c("plan", "monitor", "adapt"),
Social = c("cohesion", "emotion", "consensus"),
Task = c("discuss", "synthesis", "coregulate")
))
# With a cograph_communities object (infomap supports directed graphs)
comm <- cograph::communities(model$weights, method = "infomap")
overlay_communities(model, comm)
}