Create visualizations for motif analysis results including network diagrams of triads, bar plots of type distributions, and significance plots.
Usage
# S3 method for class 'cograph_motif_analysis'
plot(
  x,
  type = c("triads", "types", "significance", "patterns"),
  n = 20,
  colors = c("#2166AC", "#B2182B"),
  res = 72,
  node_size = 5,
  label_size = 7,
  title_size = 7,
  stats_size = 5,
  ncol = 5,
  legend = TRUE,
  color = "#800020",
  spacing = 1,
  combined = TRUE,
  ...
)
Arguments
- x
A
cograph_motif_analysisobject fromextract_motifs()- type
Plot type:
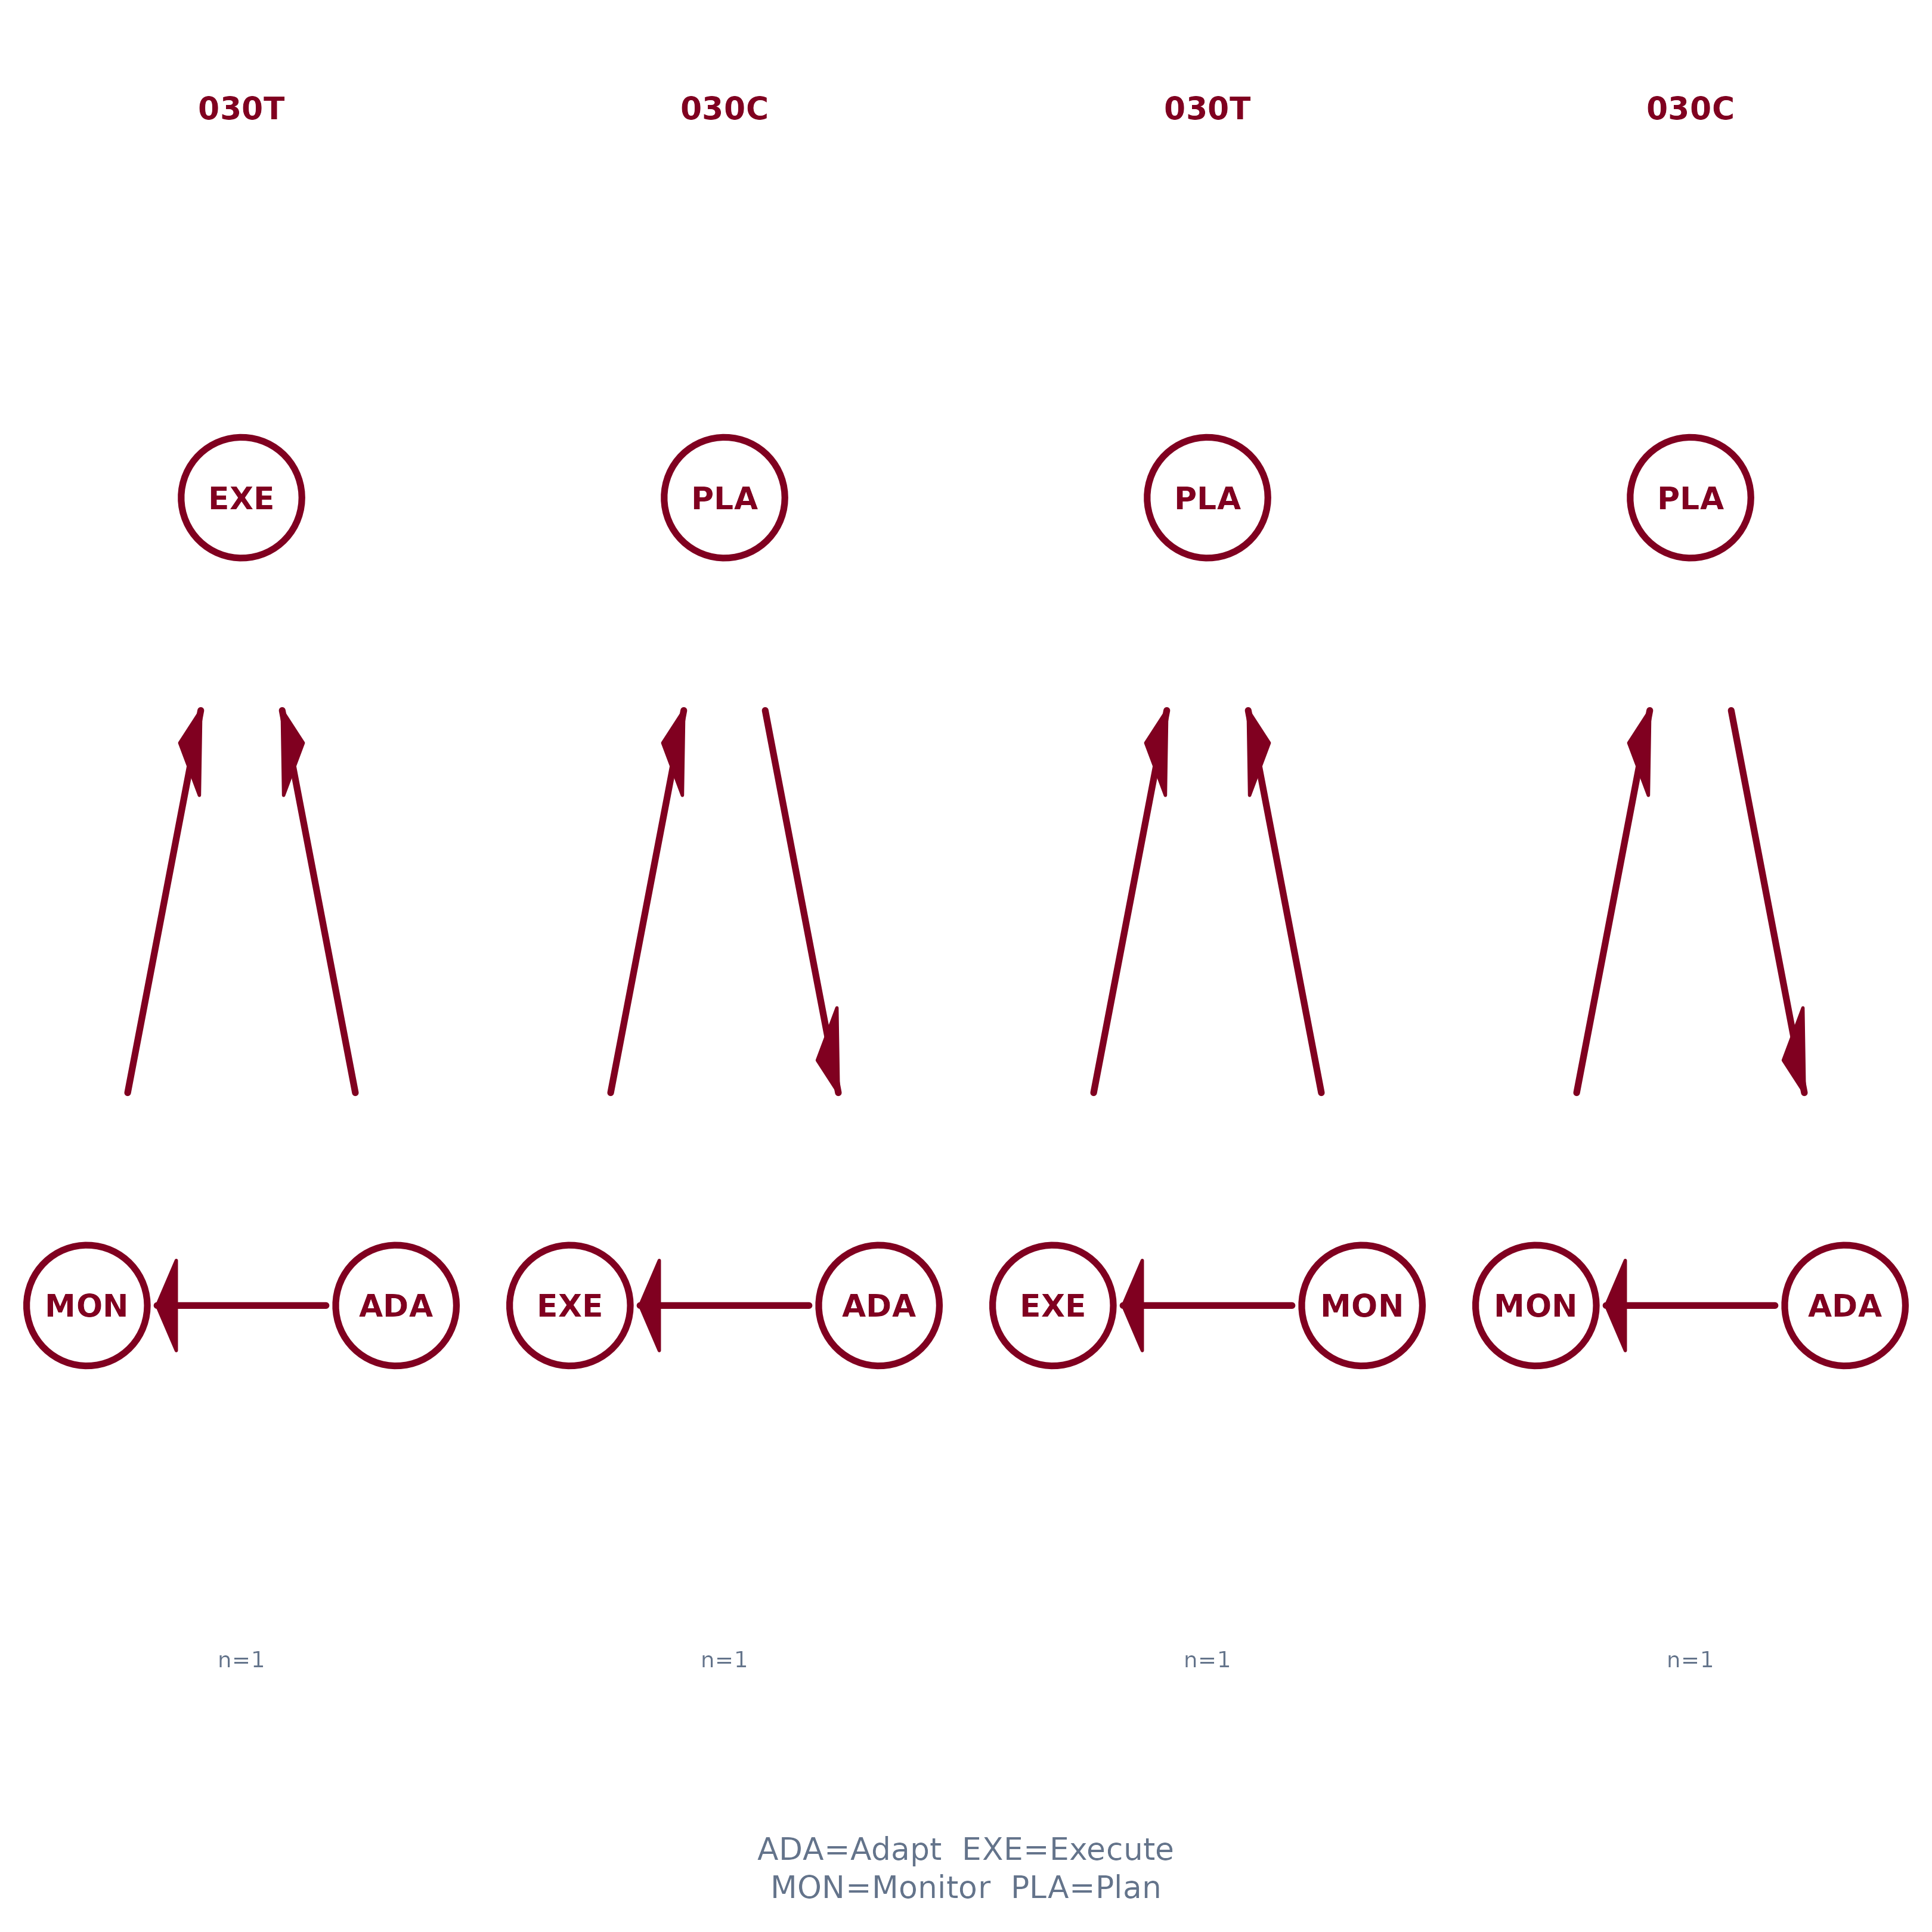
"triads"(default) Network diagrams of specific named triads, arranged in a grid. Each cell shows the three nodes and their edges.
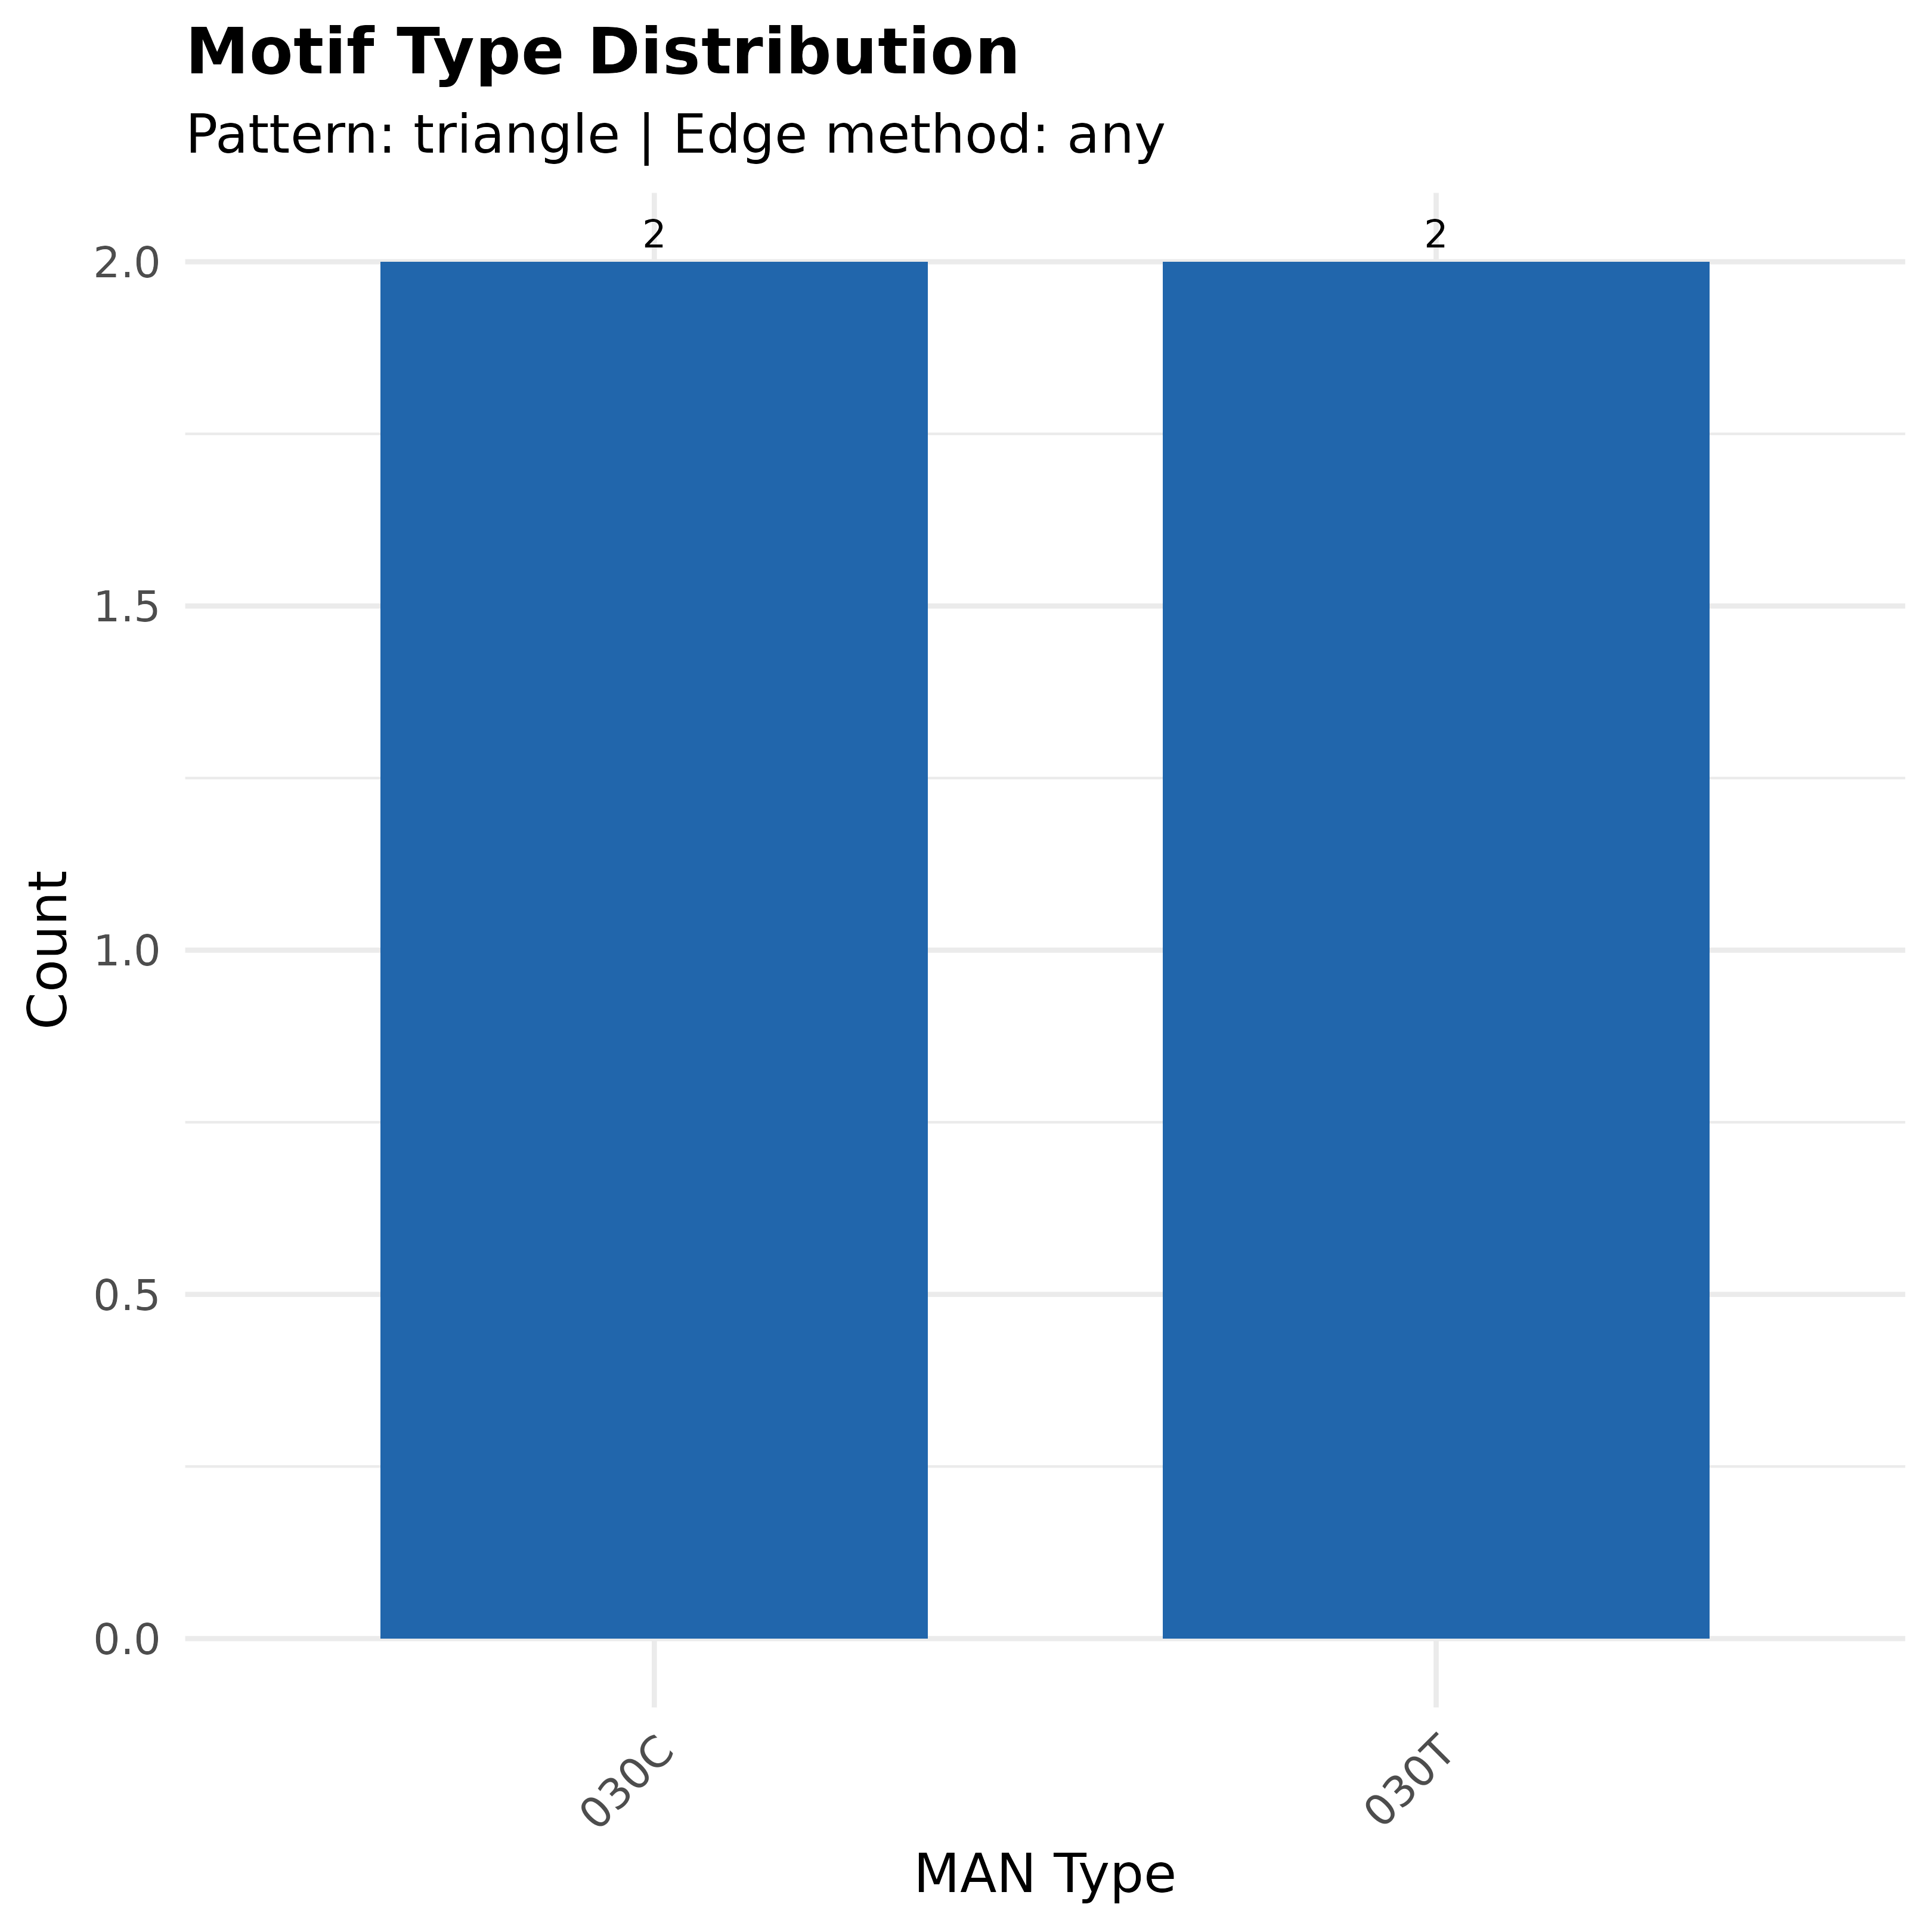
"types"Bar chart of MAN type frequencies.
"significance"Z-score plot showing over- and under-represented types. Requires
significance = TRUEinextract_motifs()."patterns"Abstract MAN pattern diagrams showing edge structure of each triad type without specific node labels.
- n
Number of triads/patterns to show. Default 20.
- colors
Two-element color vector mapped to a three-tone significance scale (used by
type = "significance"and bytype = "patterns"node fills):colors[1]fills items that are significantly under-represented (p < .05andz < 0);colors[2]fills items that are significantly over-represented (p < .05andz > 0); everything else is filled neutral grey ("#9E9E9E"). When significance was not run, patterns nodes usecolors[1]as a single fill. Defaultc("#2166AC", "#B2182B")(blue for under, red for over).- res
Resolution for scaling (kept for backwards compatibility). Default 72.
- node_size
Size of nodes in triad diagrams (1-10 scale). Default 5.
- label_size
Font size for node labels (3-letter abbreviations). Default 7.
- title_size
Font size for motif type title (e.g., "120C"). Default 7.
- stats_size
Font size for statistics text (n, z, p). Default 5.
- ncol
Number of columns in the plot grid. Default 5.
- legend
Show abbreviation legend at bottom? Default TRUE.
- color
Color for nodes, edges, and labels in triad diagrams. Default
"#800020"(maroon).- spacing
Spacing multiplier between grid cells (0.5-2). Default 1.
- combined
Logical: when TRUE (default) and
type = "patterns", arrange the per-motif panels in an internal grid viagraphics::par(mfrow=...). Set to FALSE to draw into a layout the caller has already configured (e.g. viapanel_layout()).- ...
Additional arguments (unused).
Value
Invisibly returns NULL for triad and pattern plots, or a ggplot2 object for types and significance plots.
See also
extract_motifs() for the analysis that produces this object,
motif_census() for statistical motif analysis
Other motifs:
extract_motifs(),
extract_triads(),
get_edge_list(),
motif_census(),
motifs(),
plot.cograph_motifs(),
subgraphs(),
triad_census()