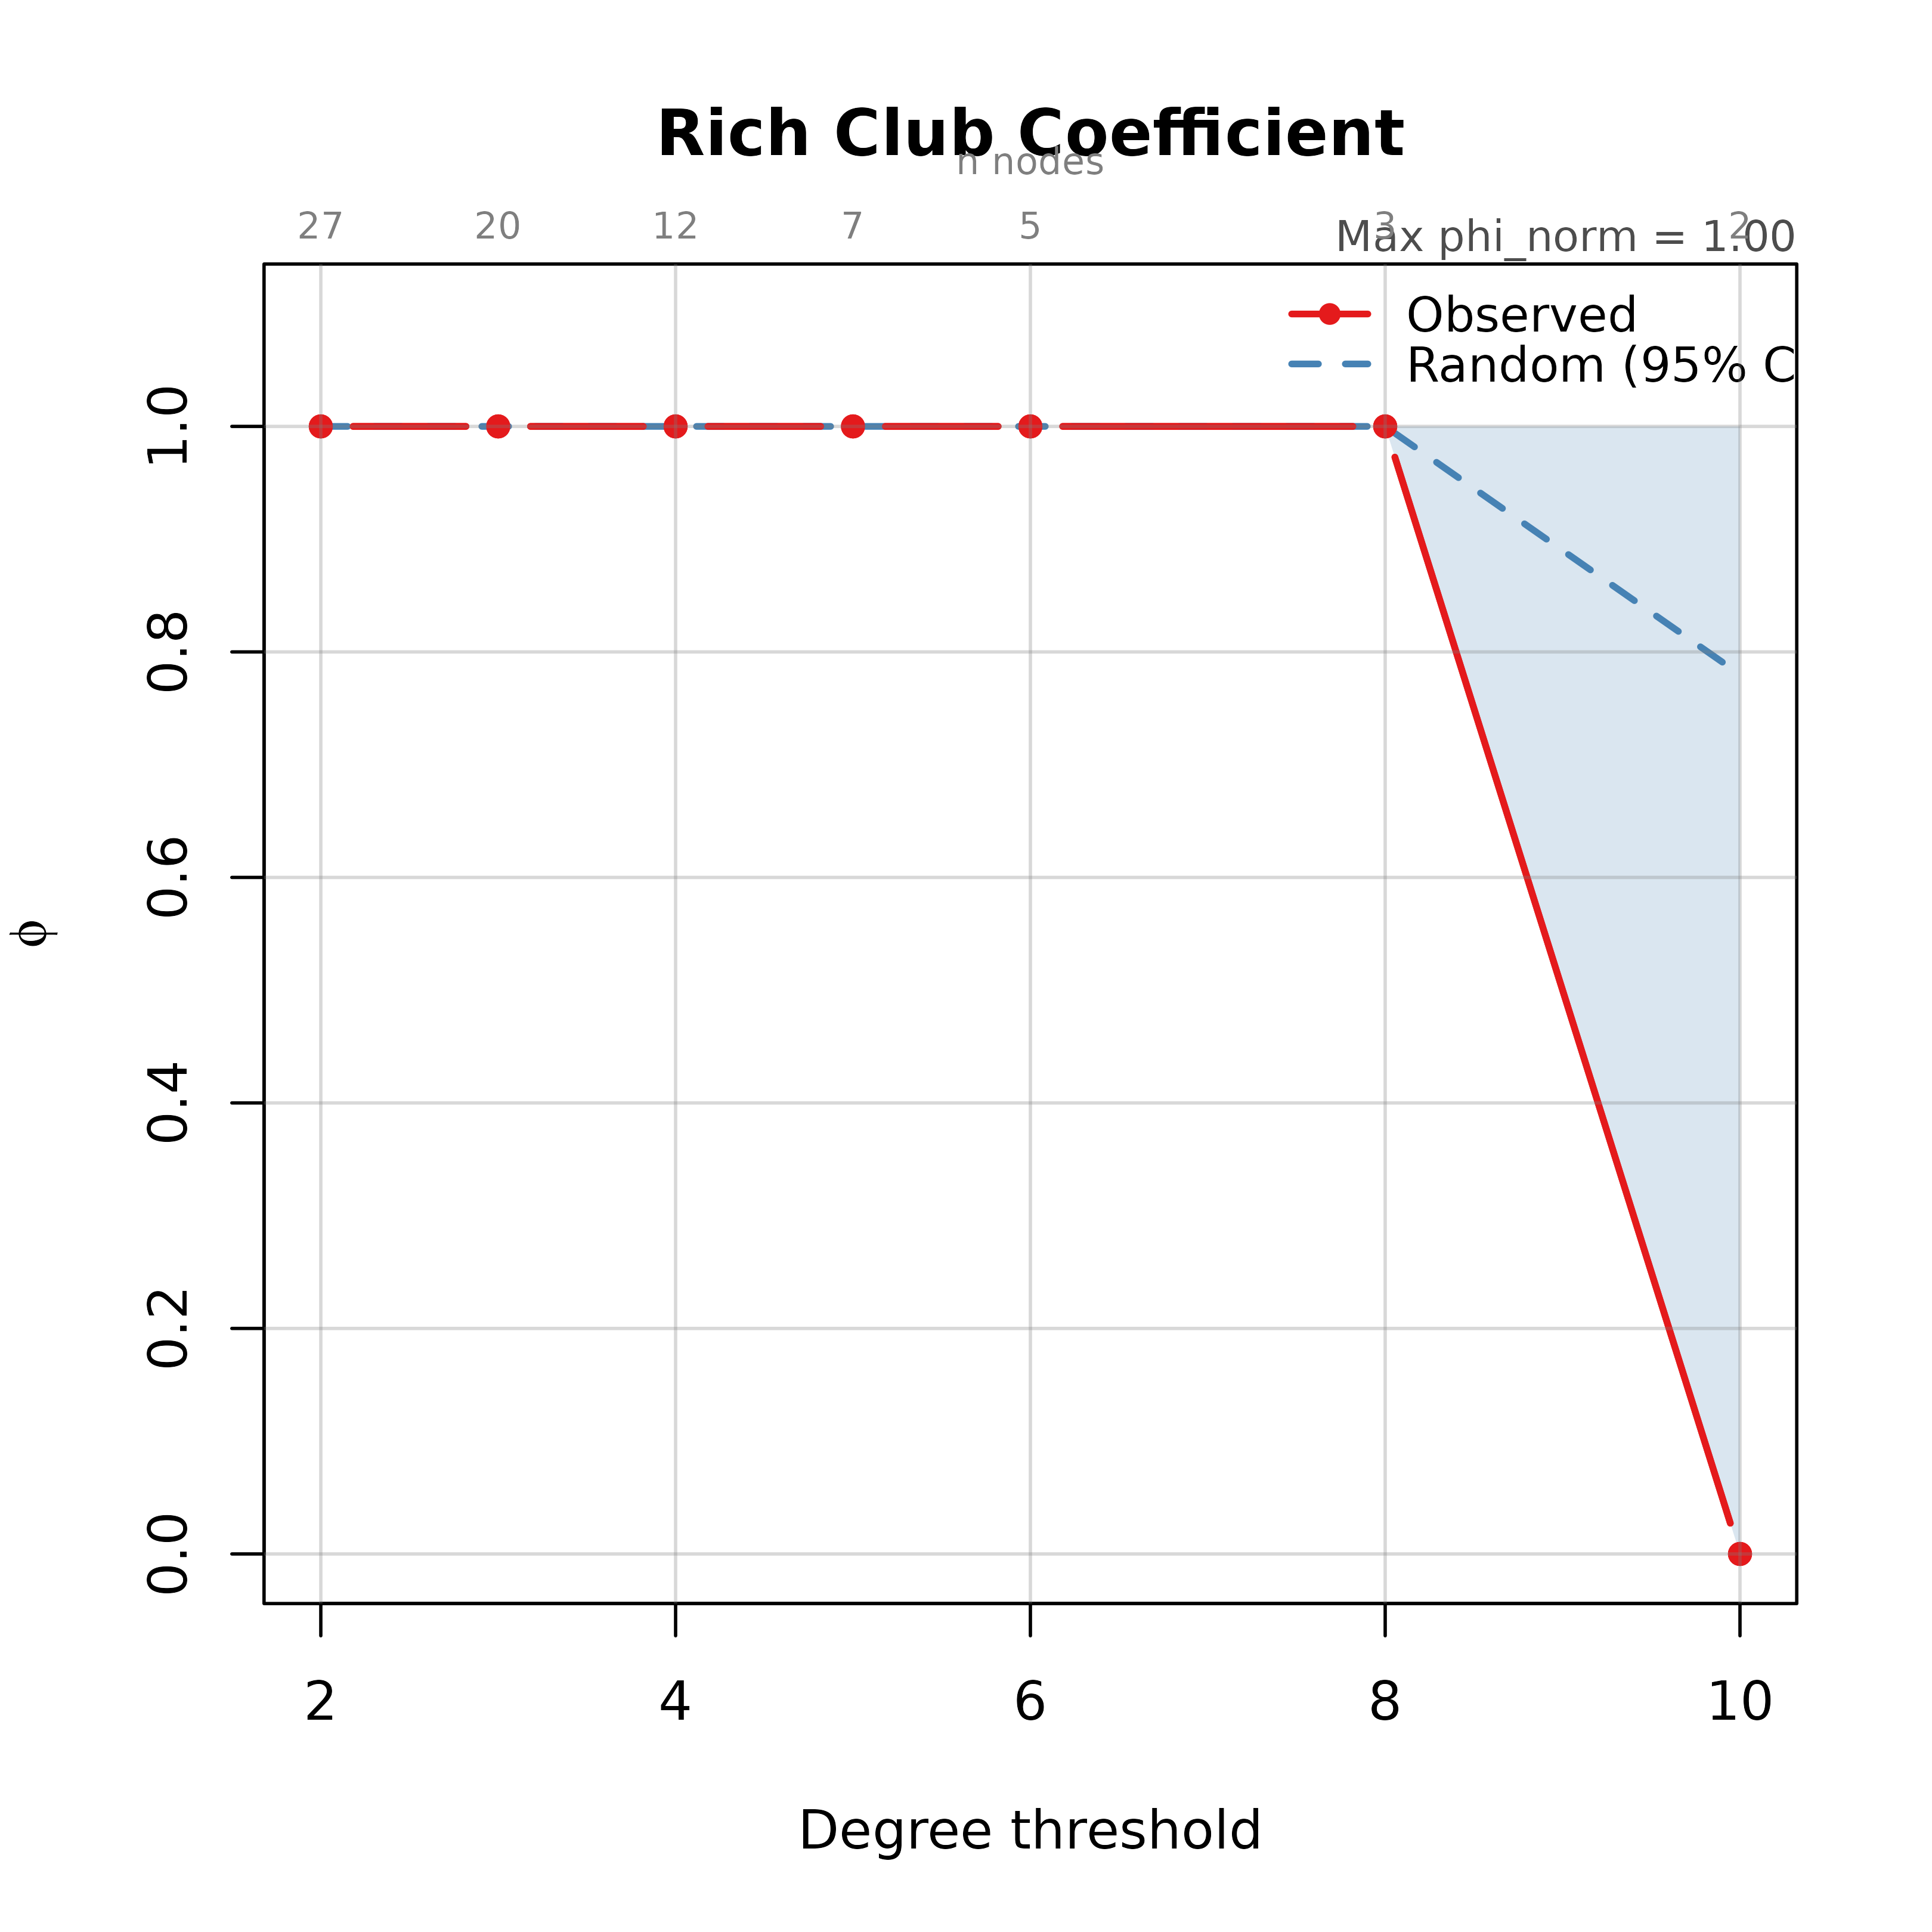
Two plot types: "curve" (default) shows the rich club coefficient
across thresholds with null model bands. "network" highlights rich
club members on the network at a given threshold.
Arguments
- x
A
cograph_rich_clubdata frame.- type
Character.
"curve"(default) or"network".- k
Numeric. For
type = "network", the degree/strength threshold to visualize. If NULL, uses the threshold with the highest phi_norm (or phi if not normalized).- col
Line/node color for rich club. Default
"#E41A1C".- ...
Additional arguments passed to
plot(curve) orsplot(network).