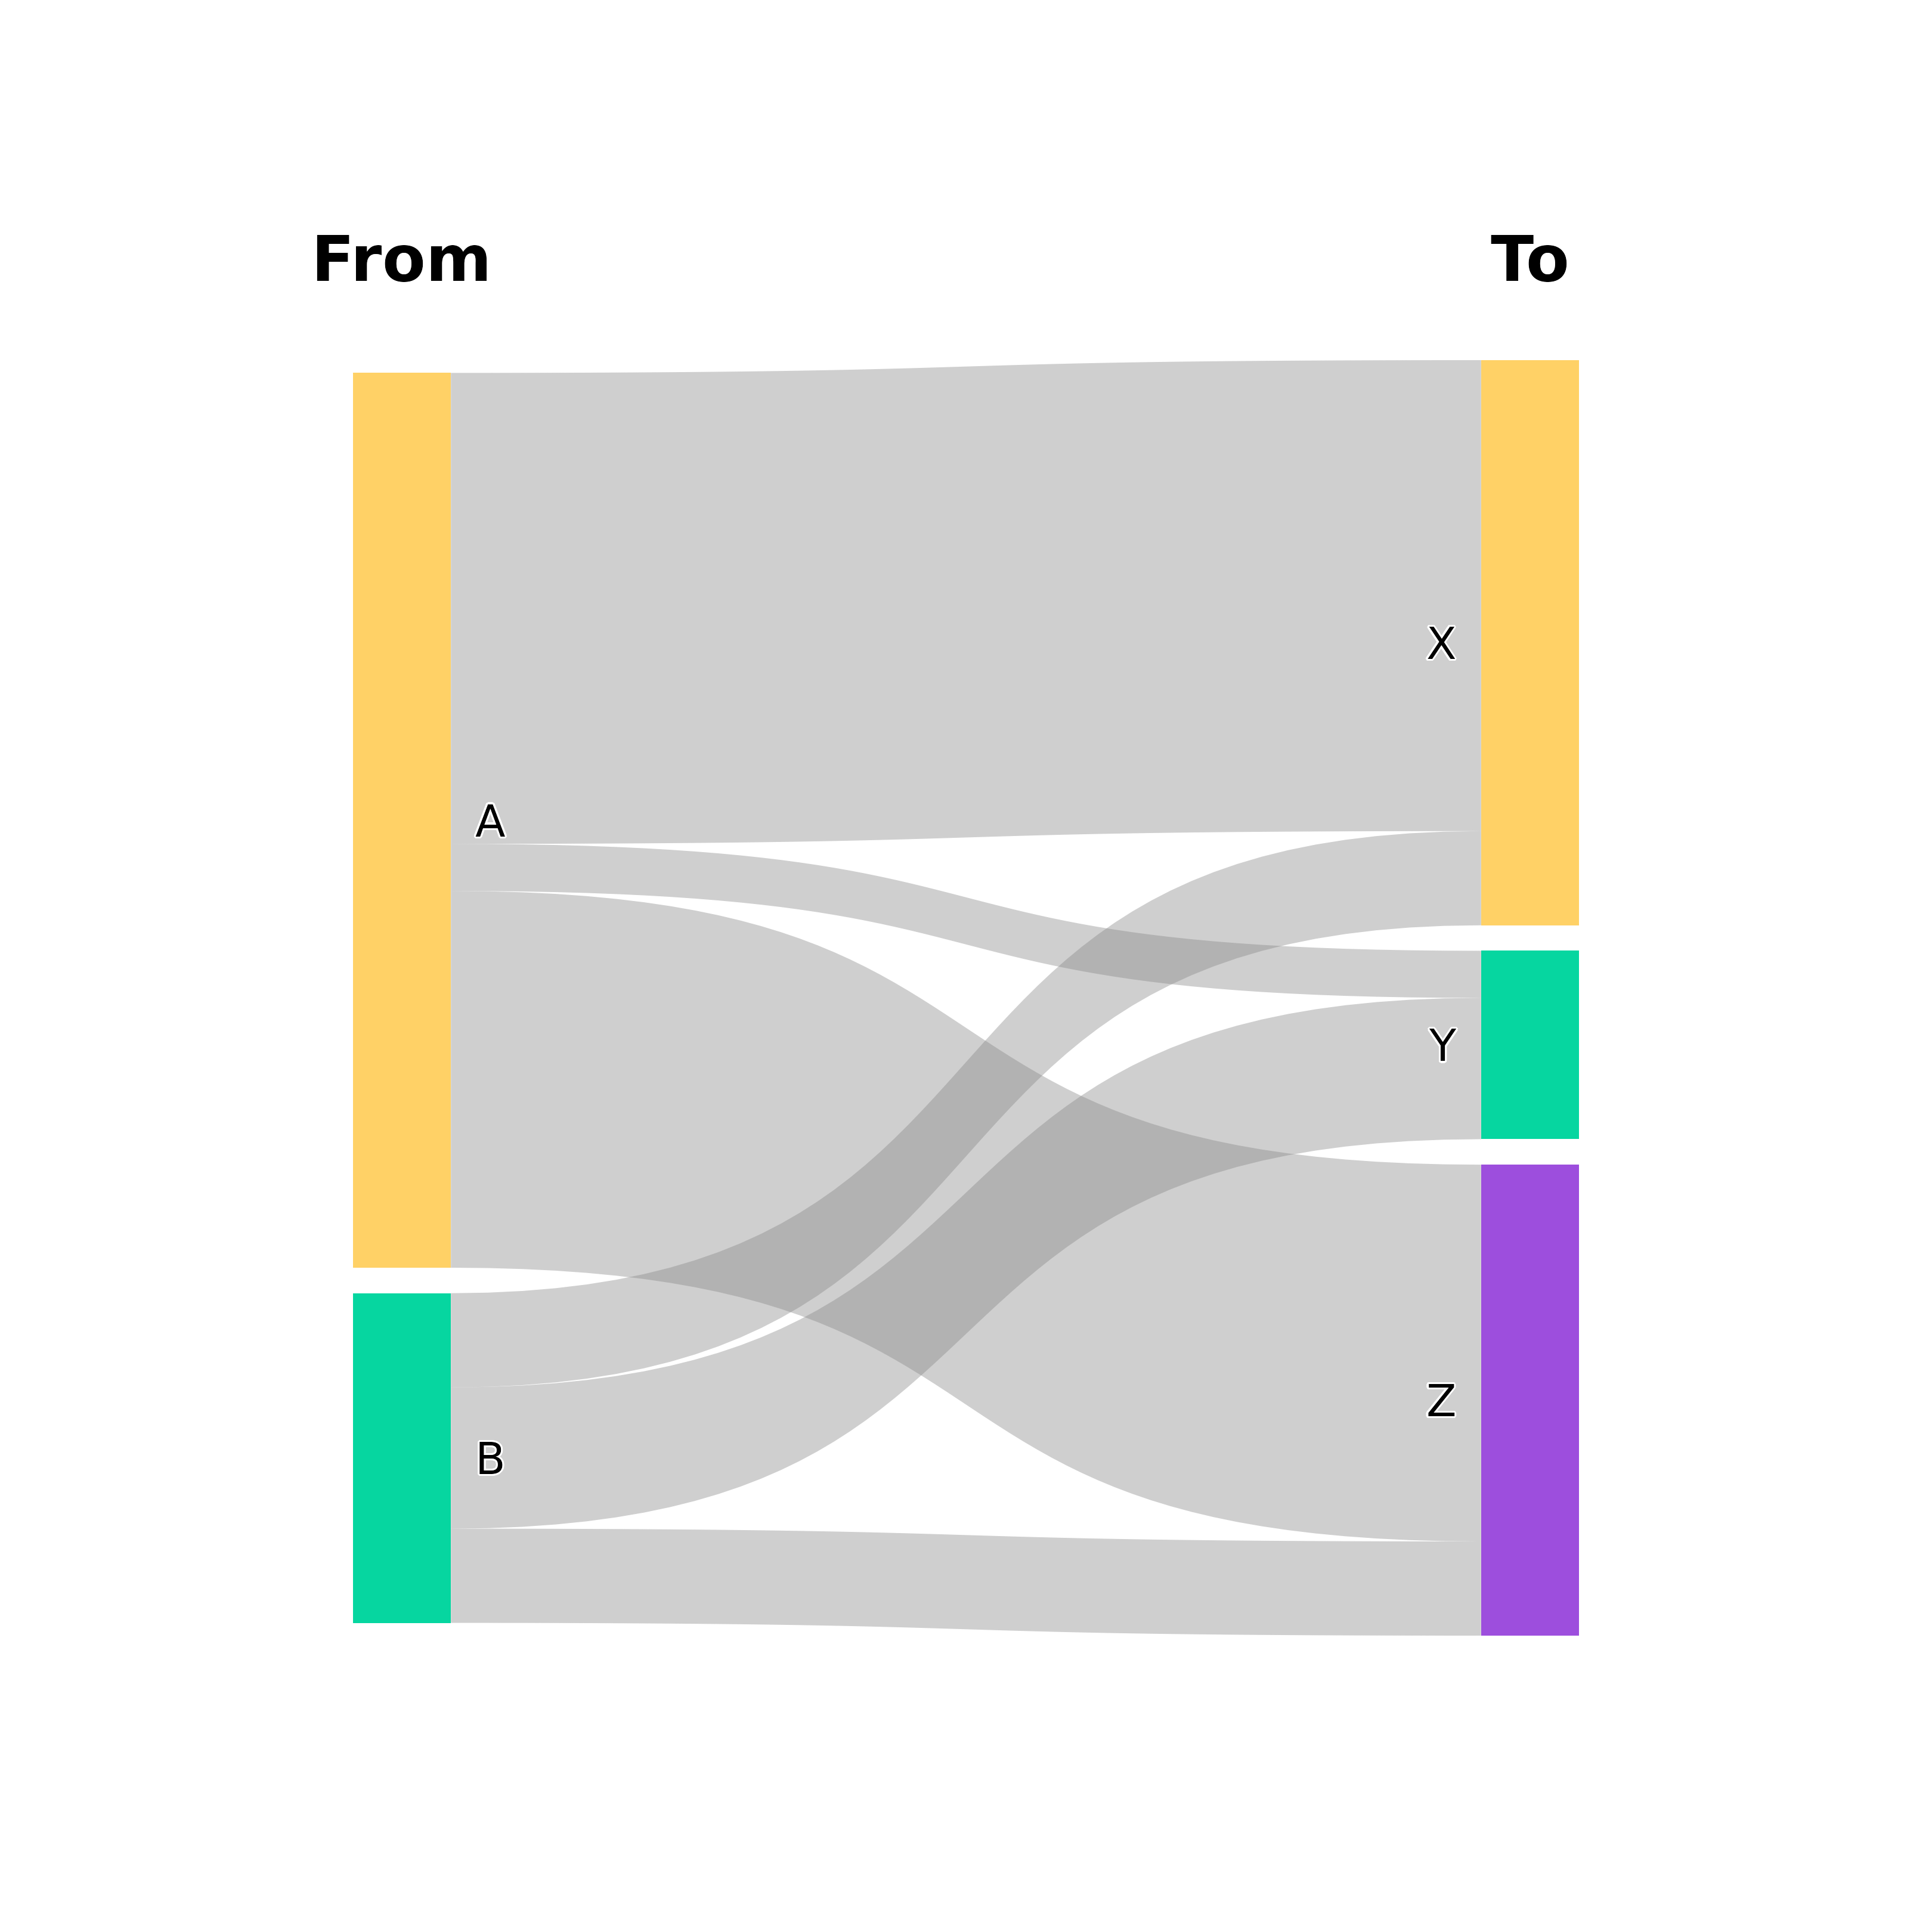
Creates an alluvial (Sankey) diagram of aggregated flows between states.
It calls plot_transitions() with track_individuals = FALSE.
Usage
plot_alluvial(
  x,
  from_title = "From",
  to_title = "To",
  title = NULL,
  from_colors = NULL,
  to_colors = NULL,
  flow_fill = "#888888",
  flow_alpha = 0.4,
  flow_color_by = NULL,
  flow_border = NA,
  flow_border_width = 0.5,
  node_width = 0.08,
  node_border = NA,
  node_spacing = 0.02,
  label_size = 3.5,
  label_position = c("beside", "inside", "above", "below", "outside"),
  label_halo = TRUE,
  label_color = "black",
  label_fontface = "plain",
  label_nudge = 0.02,
  title_size = 5,
  title_color = "black",
  title_fontface = "bold",
  curve_strength = 0.6,
  show_values = FALSE,
  value_position = c("center", "origin", "destination", "outside_origin",
    "outside_destination"),
  value_size = 3,
  value_color = "black",
  value_halo = NULL,
  value_fontface = "bold",
  value_nudge = 0.03,
  value_min = 0,
  show_totals = FALSE,
  total_size = 4,
  total_color = "white",
  total_fontface = "bold",
  conserve_flow = TRUE,
  min_flow = 0,
  threshold = 0,
  value_digits = 2,
  column_gap = 1
)
Arguments
- x
Input data in one of these formats:
A transition matrix (rows = from, columns = to, values = counts).
A vector of "before" states, with the vector of "after" states passed as the second argument (
from_title). Both vectors must have the same length, greater than 2, and their contingency table is computed.A data frame with two columns of raw observations, whose contingency table is computed.
A data frame with three or more columns of raw observations, one column per time point, plotted as a multi-step diagram.
A data frame with columns
from,toandcount.A list of matrices for multi-step transitions.
A
tnaobject. Its sequence data are used as a data frame of time points (rows with missing values are dropped), or its weight matrix when no sequence data are stored.
- from_title
Title for the left column. Default "From". For multi-step and individual-tracking plots, a vector with one title per column. Data frame input then uses the column names by default, and a vector shorter than the number of columns is replaced by "T1", "T2", ...
- to_title
Title for the right column. Default "To". Ignored for multi-step plots.
- title
Optional plot title.
- from_colors
Colors for the left-side nodes. In multi-step and individual-tracking plots, the colors of all states. Default NULL uses the built-in palette.
- to_colors
Colors for the right-side nodes in two-column plots. Default NULL uses the built-in palette.
- flow_fill
Fill color for flows. Default "#888888" (grey). In multi-step plots it is replaced by the state colors when
flow_color_byis set. Individual-tracking lines do not use it.- flow_alpha
Alpha transparency for flows. Default 0.4.
- flow_color_by
Color flows by state. Multi-step aggregate plots accept
"source"or"destination". Individual-tracking plots also accept"first"and"last". Default NULL usesflow_fill. Two-column aggregate plots ignore this argument.- flow_border
Border color for flows. Default NA (no border).
- flow_border_width
Line width for flow borders. Default 0.5.
- node_width
Width of node rectangles (0-1 scale). Default 0.08.
- node_border
Border color for nodes. Default NA (no border).
- node_spacing
Vertical spacing between nodes (0-1 scale). Default 0.02.
- label_size
Size of node labels. Default 3.5.
- label_position
Position of node labels: "beside" (default), "inside", "above", "below", "outside". In multi-step and individual-tracking plots, "beside" and "outside" label the first and last columns only. See
mid_label_positionfor middle columns.- label_halo
Logical: add a white halo around labels and column titles? Default TRUE.
- label_color
Color of state name labels. Default "black". Applied to multi-step and individual-tracking plots. Two-column aggregate plots use black external labels and white inside labels.
- label_fontface
Font face of state name labels ("plain", "bold", "italic", "bold.italic"). Default "plain". Applied to multi-step and individual-tracking plots.
- label_nudge
Distance between node edge and label (in plot units). Default 0.02. Used by multi-step and individual-tracking plots.
- title_size
Size of column titles. Default 5.
- title_color
Color of column title text. Default "black". Applied to multi-step and individual-tracking plots.
- title_fontface
Font face of column titles. Default "bold". Applied to multi-step and individual-tracking plots.
- curve_strength
Controls bezier curve shape (0-1). Default 0.6.
- show_values
Logical: show transition counts on flows? Default FALSE.
- value_position
Position of flow values: "center", "origin", "destination", "outside_origin", "outside_destination". Default "center". Individual-tracking plots use "center", "origin" and "destination".
- value_size
Size of value labels on flows. Default 3.
- value_color
Color of value labels. Default "black".
- value_halo
Logical: add halo around flow value labels? Default NULL uses
label_halo. Applied to multi-step and individual-tracking plots.- value_fontface
Font face of flow value labels. Default "bold". Applied to multi-step and individual-tracking plots.
- value_nudge
Distance of value labels from node edge when using "origin" or "destination" positions. Default 0.03.
- value_min
Minimum count to show a flow value label in multi-step and individual-tracking plots. Default 0 (show all). Two-column aggregate plots show every nonzero value label when
show_values = TRUE.- show_totals
Logical: show total counts on nodes? Default FALSE.
- total_size
Size of total labels. Default 4.
- total_color
Color of total labels. Default "white".
- total_fontface
Font face of total labels. Default "bold". Applied to multi-step and individual-tracking plots.
- conserve_flow
Logical. When TRUE (default), node heights on both sides of a two-column plot are proportions of the same total flow. When FALSE, each side is scaled to its own total. Ignored for multi-step and individual-tracking plots.
- min_flow
Minimum flow value to display in aggregate plots. Default 0 (show all).
- threshold
Minimum flow value to display in aggregate plots. Flows below
max(threshold, min_flow)are removed. Default 0.- value_digits
Number of decimal places for flow value labels and node totals. Default 2.
- column_gap
Horizontal spread of columns (0-1) for multi-step and individual-tracking plots. Default 1 uses the full width. Smaller values (e.g., 0.6) bring the columns closer together.