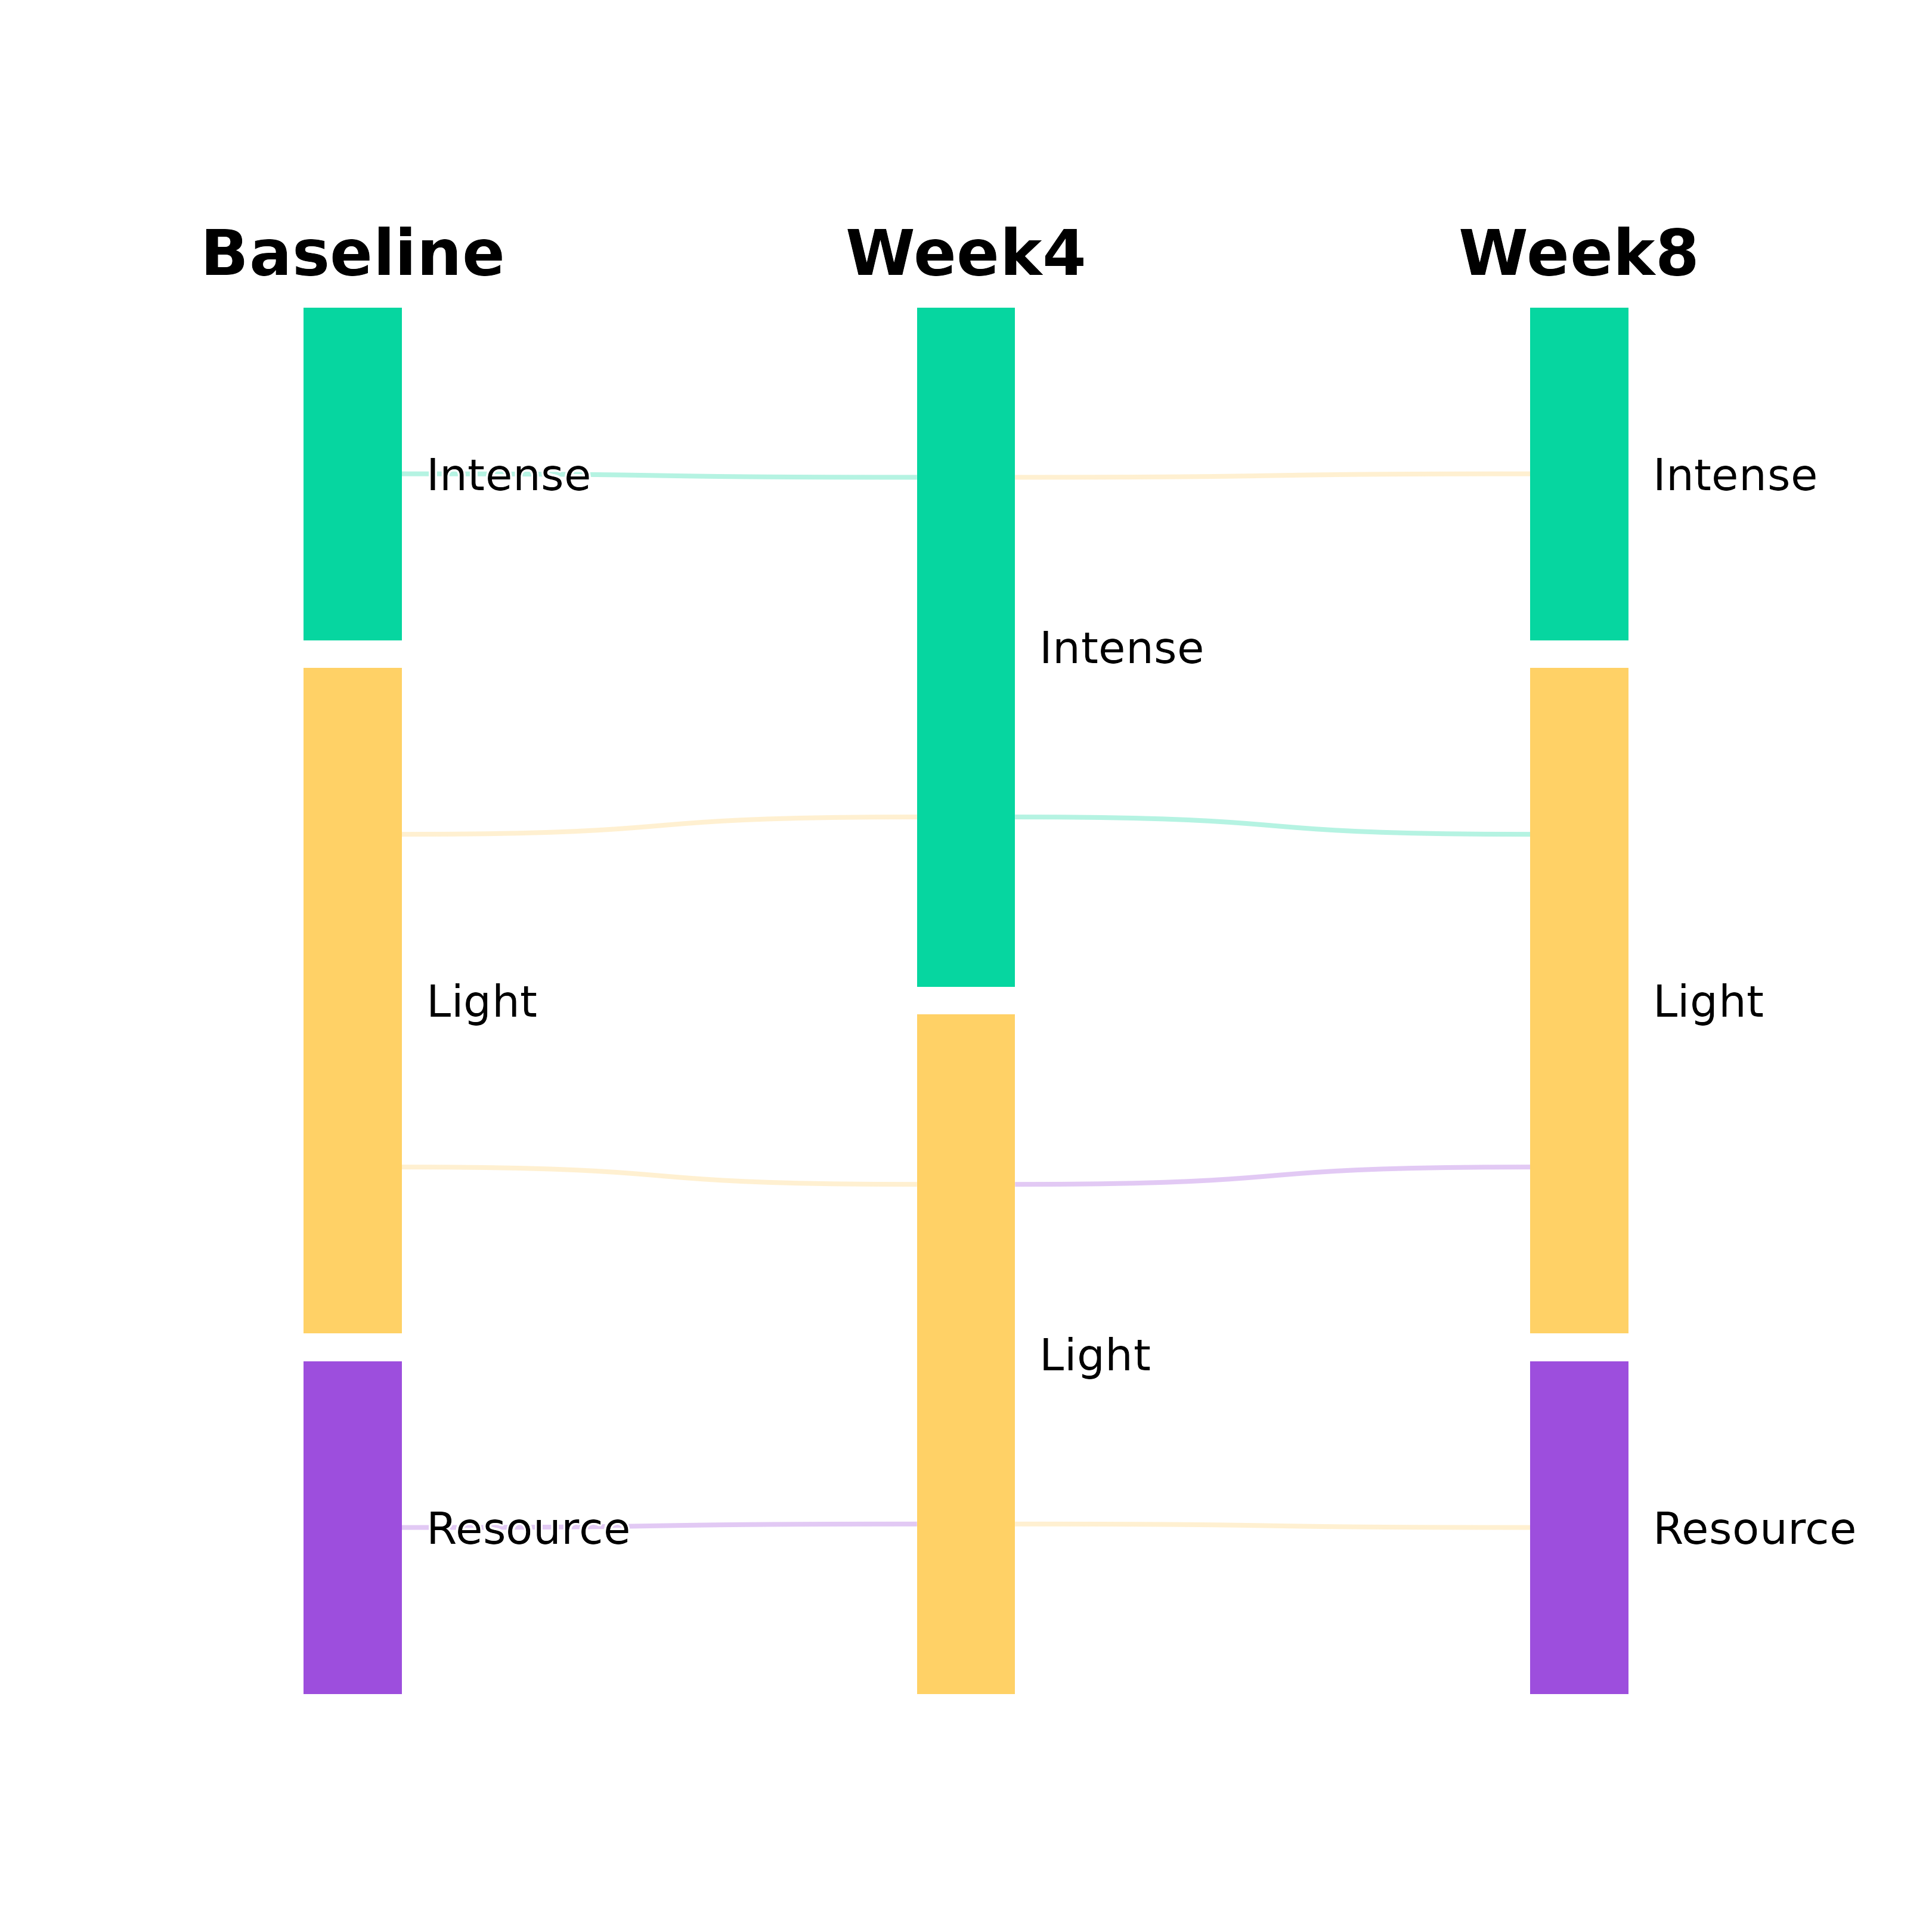
Creates an alluvial-style diagram in which each individual's trajectory is
plotted as a separate line. It calls plot_transitions() with
track_individuals = TRUE.
Usage
plot_trajectories(
  x,
  from_title = NULL,
  title = NULL,
  from_colors = NULL,
  flow_color_by = "first",
  node_width = 0.08,
  node_border = NA,
  node_spacing = 0.02,
  label_size = 3.5,
  label_position = c("beside", "inside", "above", "below", "outside"),
  mid_label_position = NULL,
  label_halo = TRUE,
  label_color = "black",
  label_fontface = "plain",
  label_nudge = 0.02,
  title_size = 5,
  title_color = "black",
  title_fontface = "bold",
  curve_strength = 0.6,
  line_alpha = 0.3,
  line_width = 0.5,
  jitter_amount = 0.8,
  show_totals = FALSE,
  total_size = 4,
  total_color = "white",
  total_fontface = "bold",
  show_values = FALSE,
  value_position = c("center", "origin", "destination"),
  value_size = 3,
  value_color = "black",
  value_halo = NULL,
  value_fontface = "bold",
  value_nudge = 0.03,
  value_min = 0,
  value_digits = 2,
  column_gap = 1,
  proportional_nodes = TRUE,
  node_label_format = NULL,
  bundle_size = NULL,
  bundle_legend = TRUE,
  bundle_legend_size = 3,
  bundle_legend_color = "grey50",
  bundle_legend_fontface = "italic",
  bundle_legend_position = c("bottom", "top")
)
Arguments
- x
Data frame with one column per time point and one row per individual trajectory, or a
tnaobject with sequence data. In a data frame, a missing value (NA) marks a time point at which the individual was not observed: no line enters or leaves that column for the individual, and the node sizes count the observed states only. Colors by"first"and"last"use the first and last observed states.- from_title
Column titles. Default
NULL, which uses the column names ofx. Pass a character vector to override them.- title
Optional plot title.
- from_colors
Colors for the left-side nodes. In multi-step and individual-tracking plots, the colors of all states. Default NULL uses the built-in palette.
- flow_color_by
Color trajectory lines by state. Supports
"source","destination","first","last", or NULL. Default"first".- node_width
Width of node rectangles (0-1 scale). Default 0.08.
- node_border
Border color for nodes. Default NA (no border).
- node_spacing
Vertical spacing between nodes (0-1 scale). Default 0.02.
- label_size
Size of node labels. Default 3.5.
- label_position
Position of node labels: "beside" (default), "inside", "above", "below", "outside". In multi-step and individual-tracking plots, "beside" and "outside" label the first and last columns only. See
mid_label_positionfor middle columns.- mid_label_position
Position of labels for intermediate (middle) columns in individual-tracking plots. Same options as
label_position. Default NULL useslabel_position.- label_halo
Logical: add a white halo around labels and column titles? Default TRUE.
- label_color
Color of state name labels. Default "black". Applied to multi-step and individual-tracking plots. Two-column aggregate plots use black external labels and white inside labels.
- label_fontface
Font face of state name labels ("plain", "bold", "italic", "bold.italic"). Default "plain". Applied to multi-step and individual-tracking plots.
- label_nudge
Distance between node edge and label (in plot units). Default 0.02. Used by multi-step and individual-tracking plots.
- title_size
Size of column titles. Default 5.
- title_color
Color of column title text. Default "black". Applied to multi-step and individual-tracking plots.
- title_fontface
Font face of column titles. Default "bold". Applied to multi-step and individual-tracking plots.
- curve_strength
Controls bezier curve shape (0-1). Default 0.6.
- line_alpha
Alpha for individual tracking lines. Default 0.3. When bundling is active, values up to 0.3 are raised to 0.9 and larger values are increased by 0.3, capped at 1.
- line_width
Width of individual tracking lines. Default 0.5. When bundling is active, widths range from
line_widthto twice that value according to the number of cases per line.- jitter_amount
Currently unused. Lines are spaced evenly within each node. Default 0.8.
- show_totals
Logical: show total counts on nodes? Default FALSE.
- total_size
Size of total labels. Default 4.
- total_color
Color of total labels. Default "white".
- total_fontface
Font face of total labels. Default "bold". Applied to multi-step and individual-tracking plots.
- show_values
Logical: show transition counts on flows? Default FALSE.
- value_position
Position of trajectory value labels:
"center","origin", or"destination". Default"center".- value_size
Size of value labels on flows. Default 3.
- value_color
Color of value labels. Default "black".
- value_halo
Logical: add halo around flow value labels? Default NULL uses
label_halo. Applied to multi-step and individual-tracking plots.- value_fontface
Font face of flow value labels. Default "bold". Applied to multi-step and individual-tracking plots.
- value_nudge
Distance of value labels from node edge when using "origin" or "destination" positions. Default 0.03.
- value_min
Minimum count to show a flow value label in multi-step and individual-tracking plots. Default 0 (show all). Two-column aggregate plots show every nonzero value label when
show_values = TRUE.- value_digits
Number of decimal places for flow value labels and node totals. Default 2.
- column_gap
Horizontal spread of columns (0-1) for multi-step and individual-tracking plots. Default 1 uses the full width. Smaller values (e.g., 0.6) bring the columns closer together.
- proportional_nodes
Logical: size nodes proportionally to counts in individual-tracking plots? When FALSE, all states in a column have equal height. Default TRUE.
- node_label_format
Format string for node labels with
{state}and{count}placeholders in individual-tracking plots, for example"{state} (n={count})". Default NULL (plain state name).- bundle_size
Controls line bundling for large datasets in individual-tracking plots. Default NULL (no bundling). A value of 1 or more sets the number of cases each line represents. A value in (0, 1) sets the fraction of the original number of lines to keep (e.g., 0.15 keeps about 15 percent). Paths with fewer than half the cases of one line are dropped.
- bundle_legend
Logical or character: show an annotation when bundling is active? Default TRUE shows "Each line ~ N cases". A string is used as custom text, with
{n}as the placeholder for the number of cases.- bundle_legend_size
Size of the bundle legend text. Default 3.
- bundle_legend_color
Color of the bundle legend text. Default "grey50".
- bundle_legend_fontface
Font face of the bundle legend text. Default "italic".
- bundle_legend_position
Position of the bundle legend: "bottom" (default) or "top".
Examples
df <- data.frame(
  Baseline = c("Light", "Light", "Intense", "Resource"),
  Week4    = c("Light", "Intense", "Intense", "Light"),
  Week8    = c("Resource", "Intense", "Light", "Light"))
plot_trajectories(df, flow_color_by = "first")