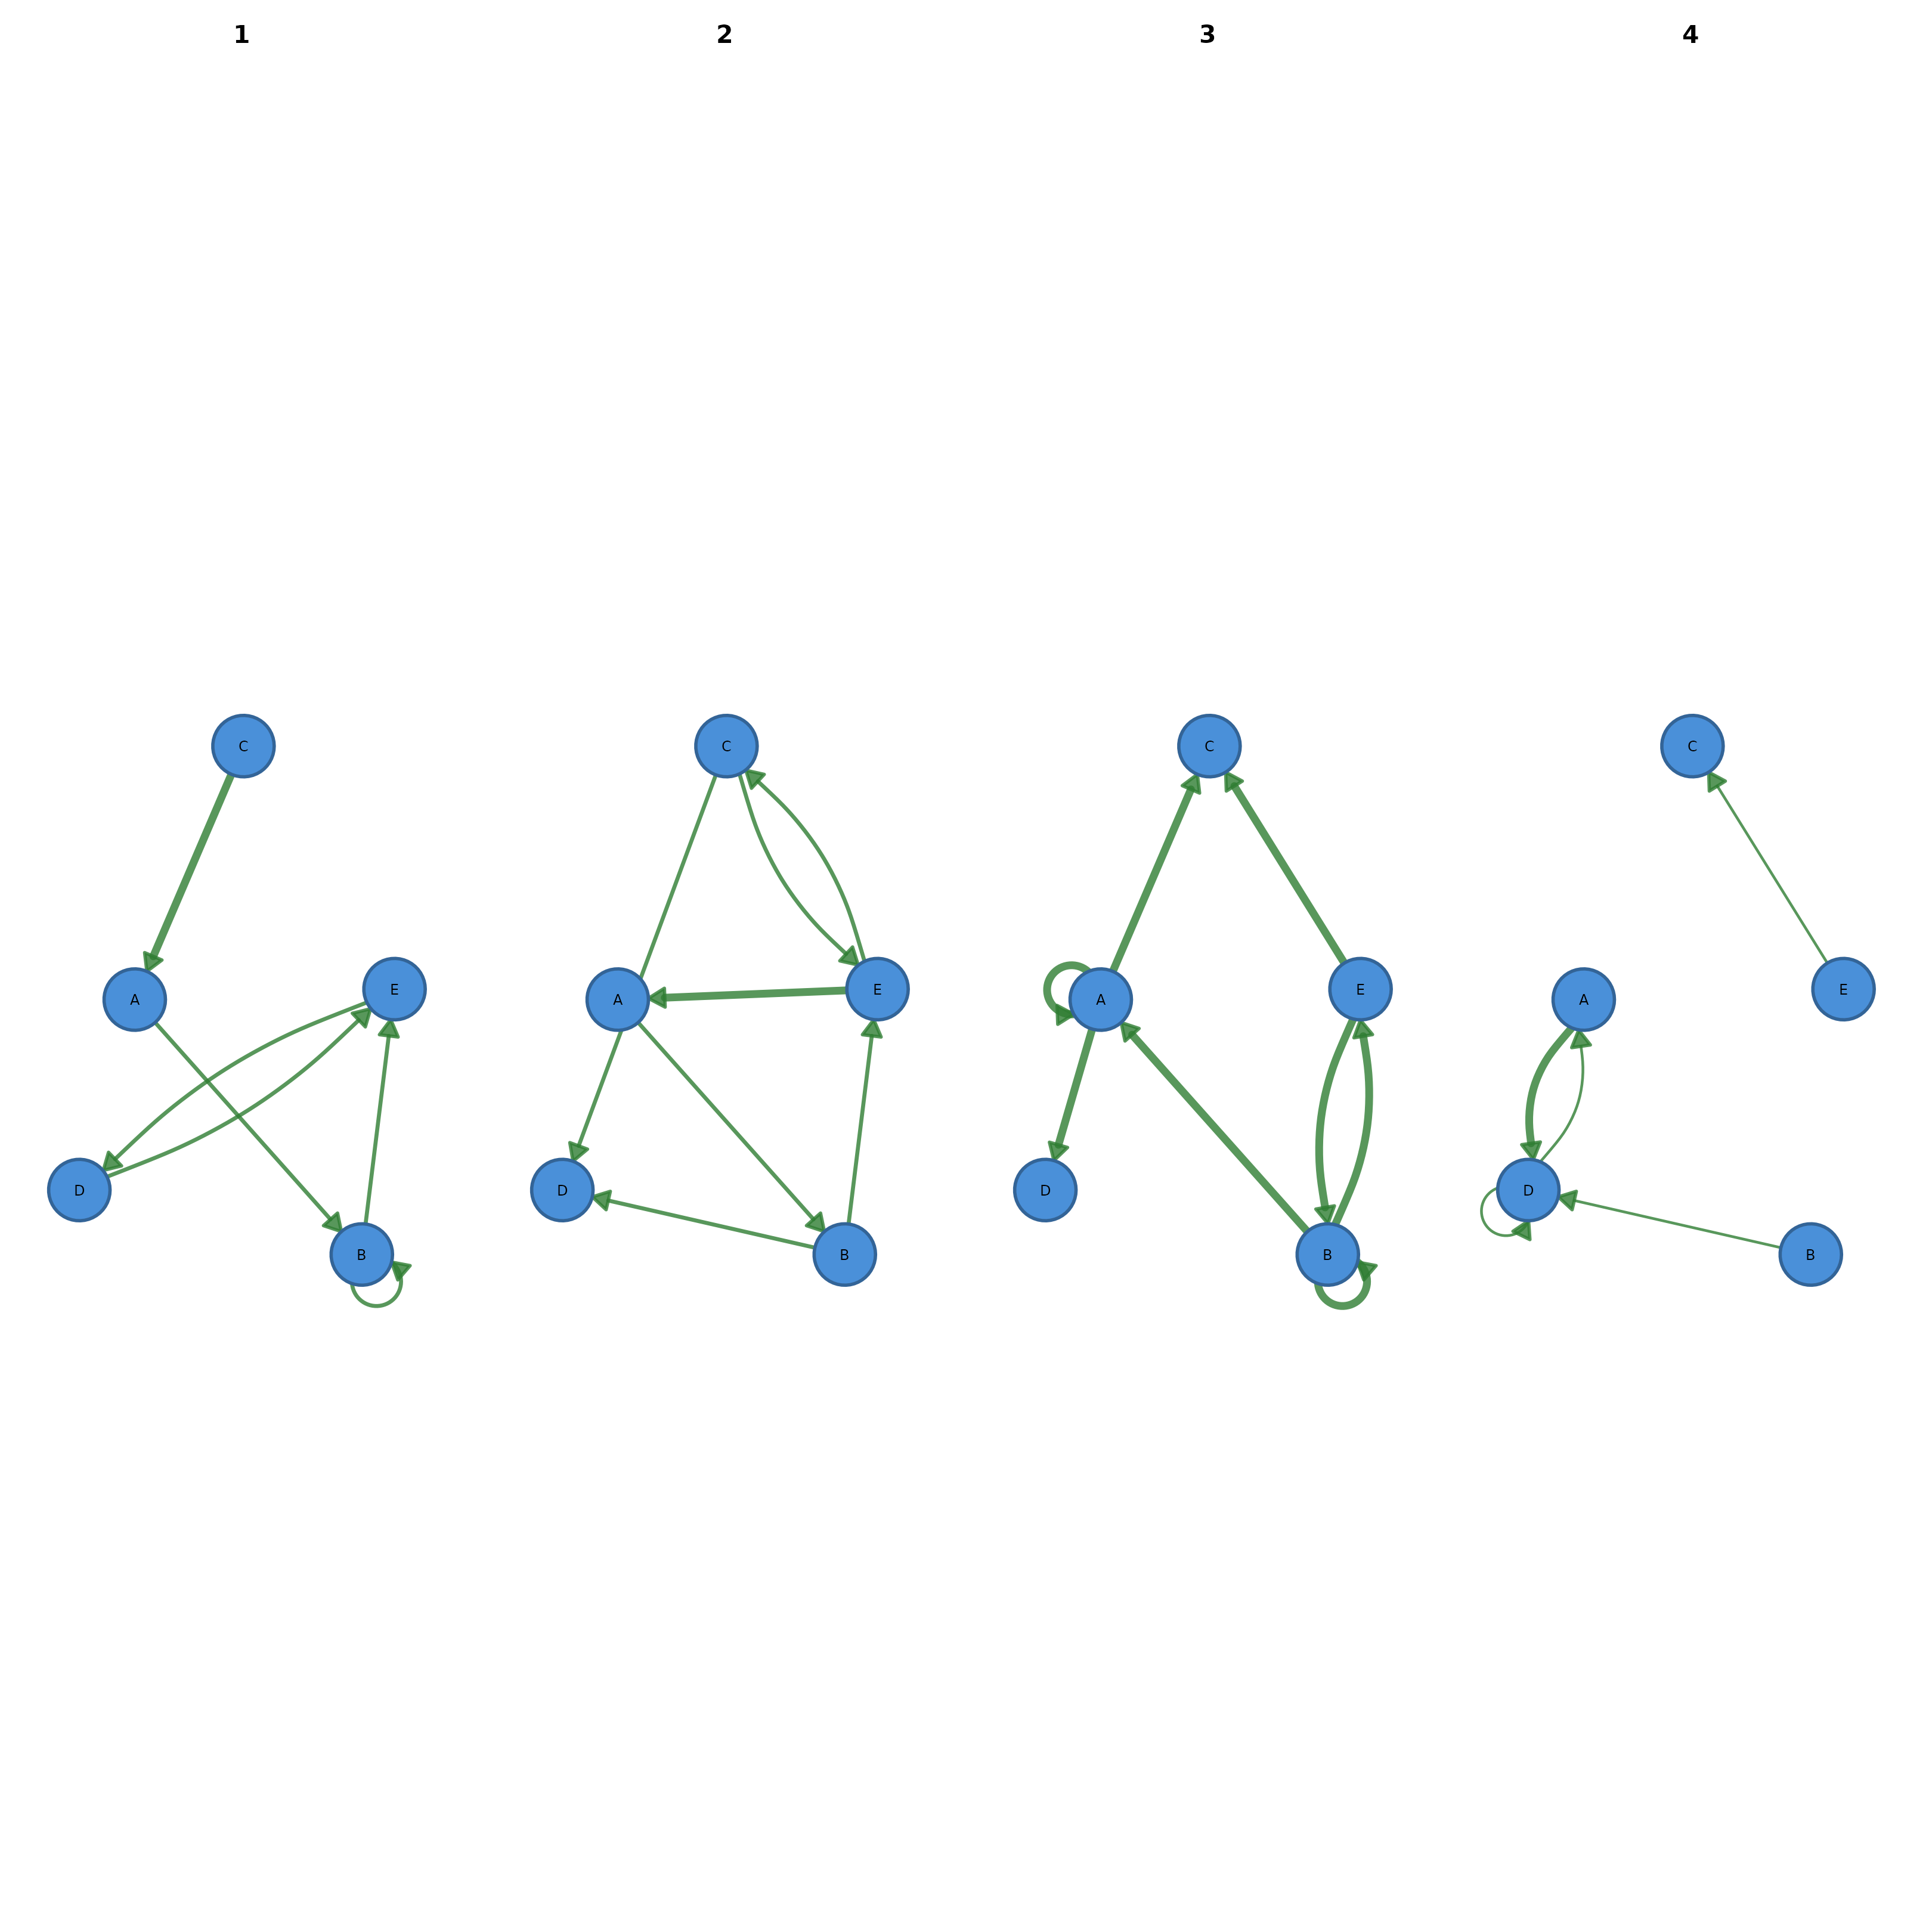
Displays a network at different time points side by side. Accepts an edge list data frame with a time column, or a pre-built list of networks. All panels share the same node layout for visual comparison.
Usage
plot_network_evolution(
  x,
  time = NULL,
  slices = NULL,
  cumulative = FALSE,
  labels = NULL,
  layout = "spring",
  ncol = NULL,
  node_size = 5,
  seed = 42,
  combined = TRUE,
  ...
)
Arguments
- x
An edge list data frame with columns
from,to, and a time column, OR a list of network objects (matrices, igraph, etc.).- time
Character. Name of the time/group column in
x. Ignored ifxis a list.- slices
Integer or NULL. Number of equal-width time bins. Default NULL uses unique values of the time column.
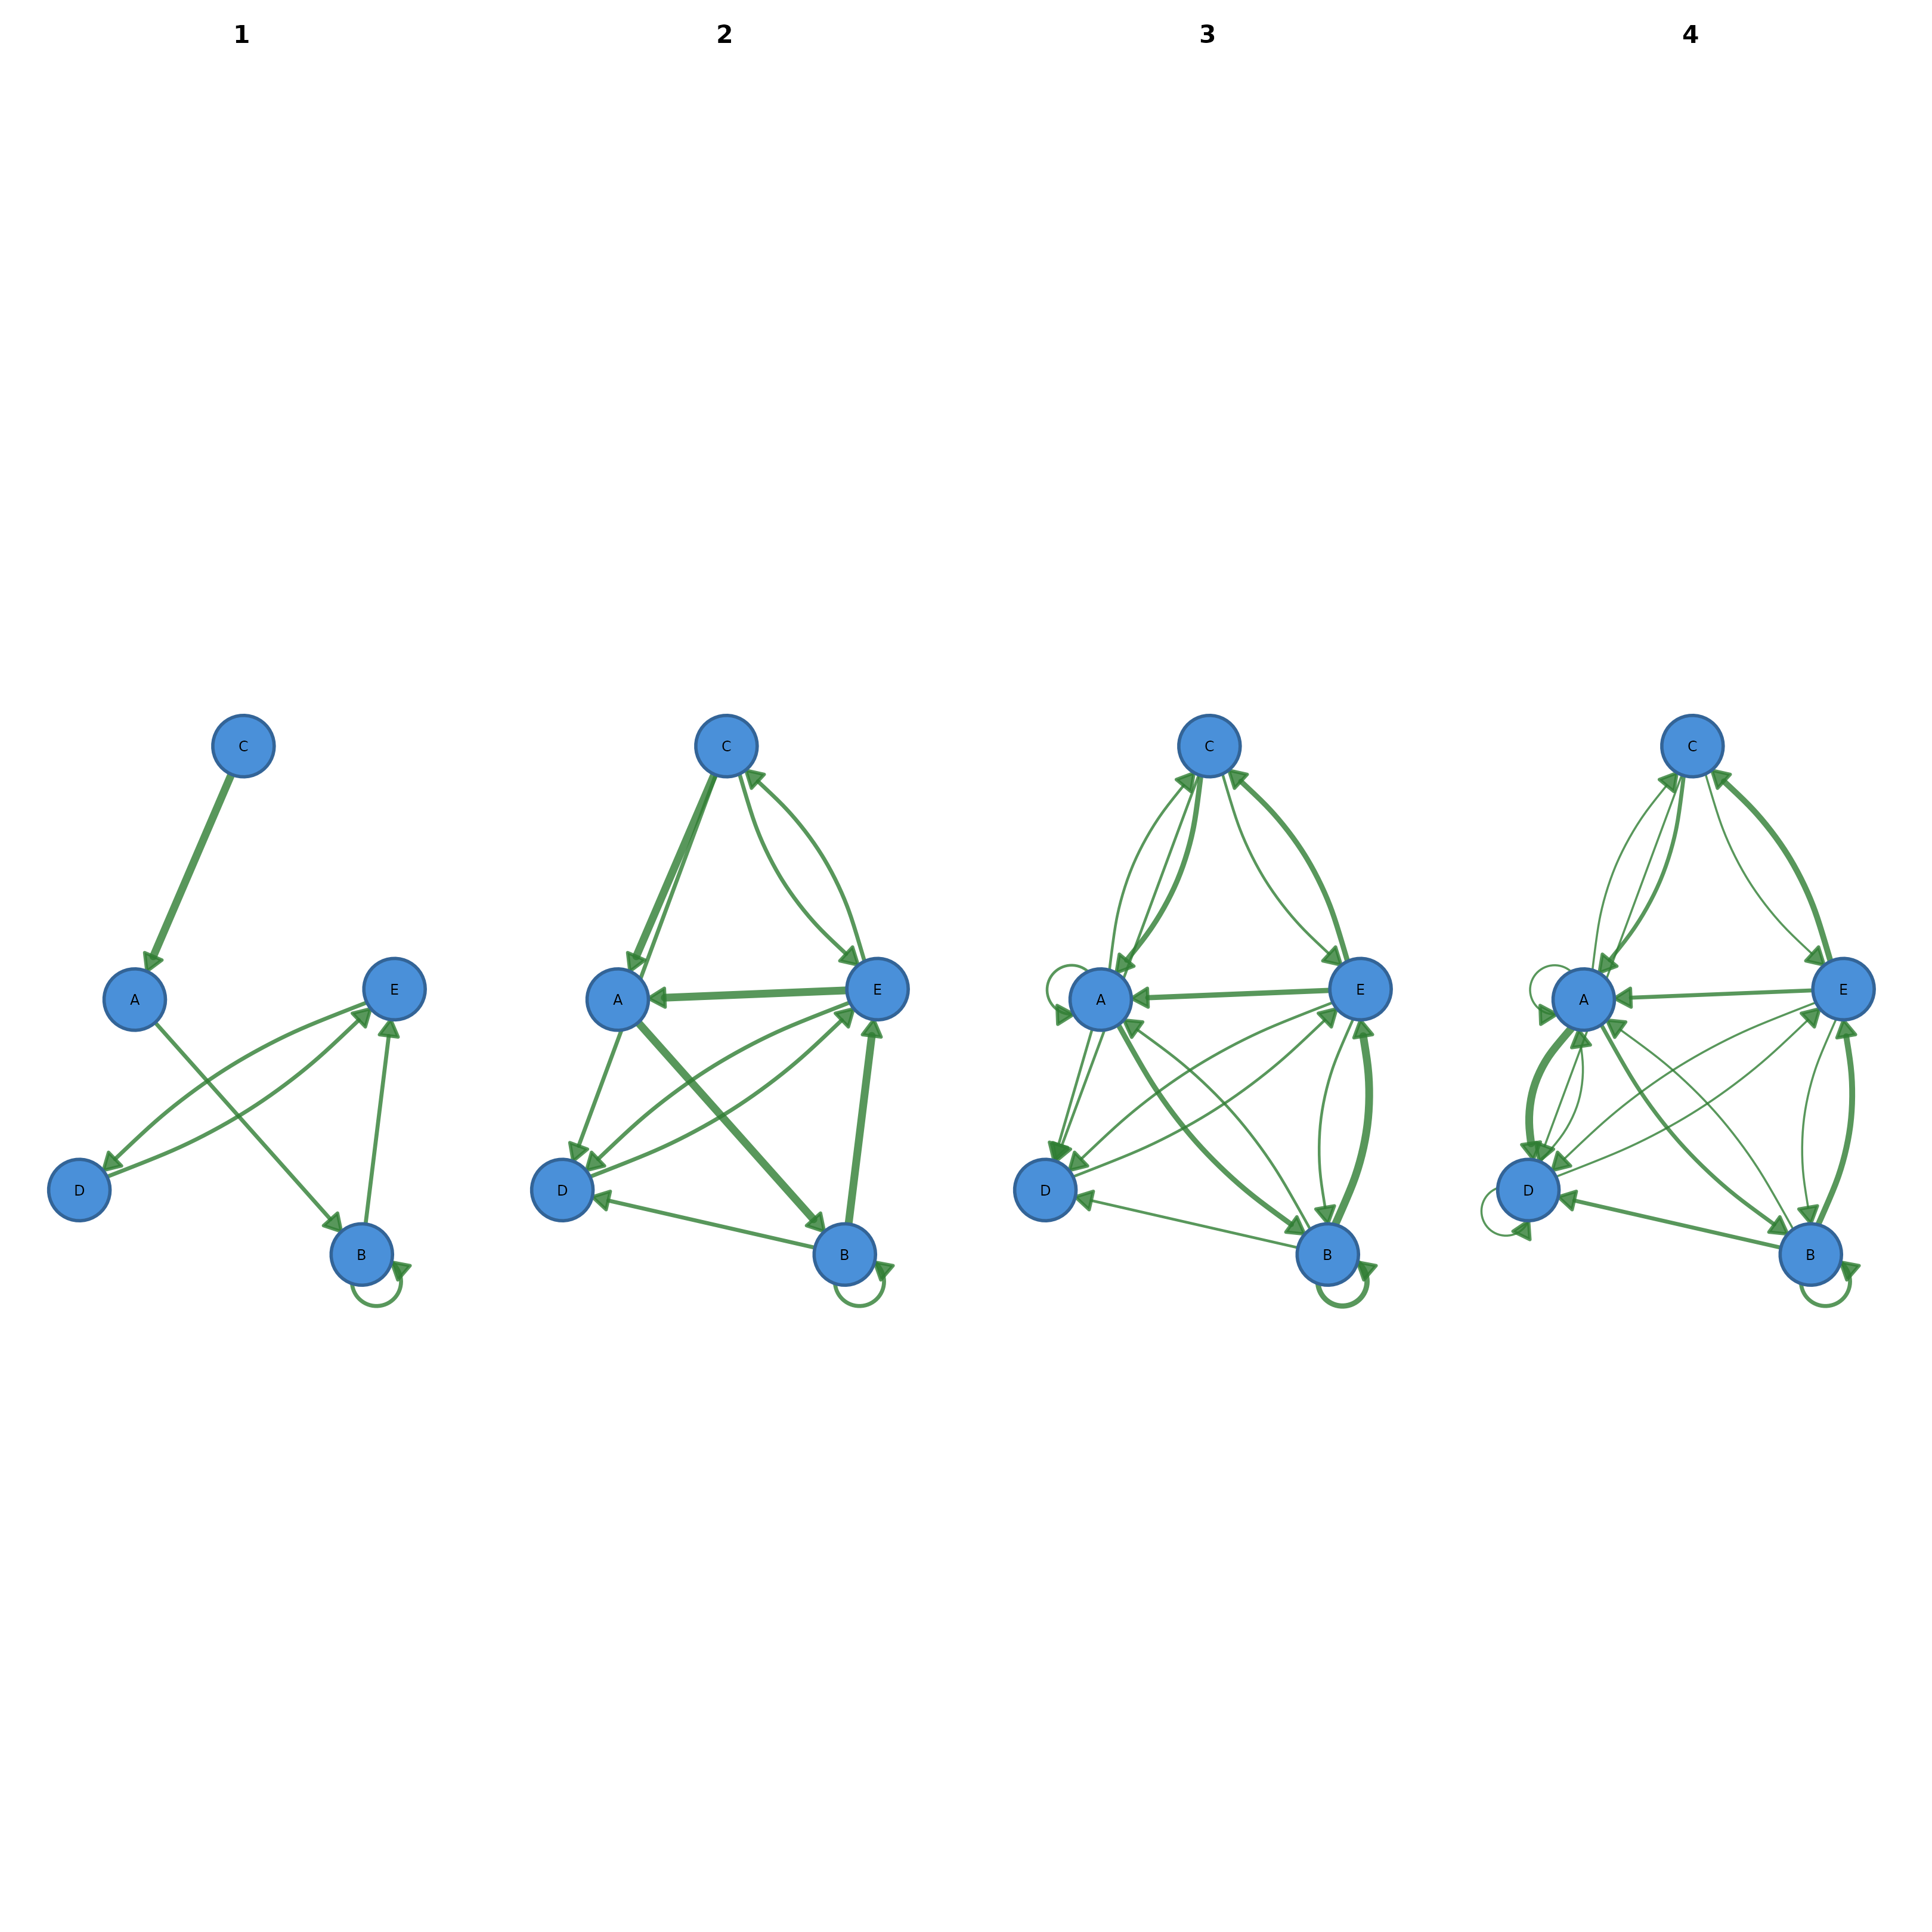
- cumulative
Logical. If TRUE, each panel shows all edges up to that time point (growing network). If FALSE (default), each panel shows only edges from that period.
- labels
Character vector of panel labels. Default NULL (auto from time values).
- layout
Layout specification. Default
"spring".- ncol
Integer. Grid columns. Default auto.
- node_size
Numeric. Default 5.
- seed
Integer or NULL. Default 42.
- combined
Logical: when TRUE (default), arrange period panels in an internal grid via
graphics::par(mfrow=...). Set to FALSE to draw into a layout the caller has already configured (e.g. viapanel_layout()).- ...
Additional arguments passed to
splot.
Examples
set.seed(1)
edges <- data.frame(
  from = sample(LETTERS[1:5], 30, replace = TRUE),
  to   = sample(LETTERS[1:5], 30, replace = TRUE),
  week = sample(1:4, 30, replace = TRUE))
cograph::plot_network_evolution(edges, time = "week")

cograph::plot_network_evolution(edges, time = "week", cumulative = TRUE)