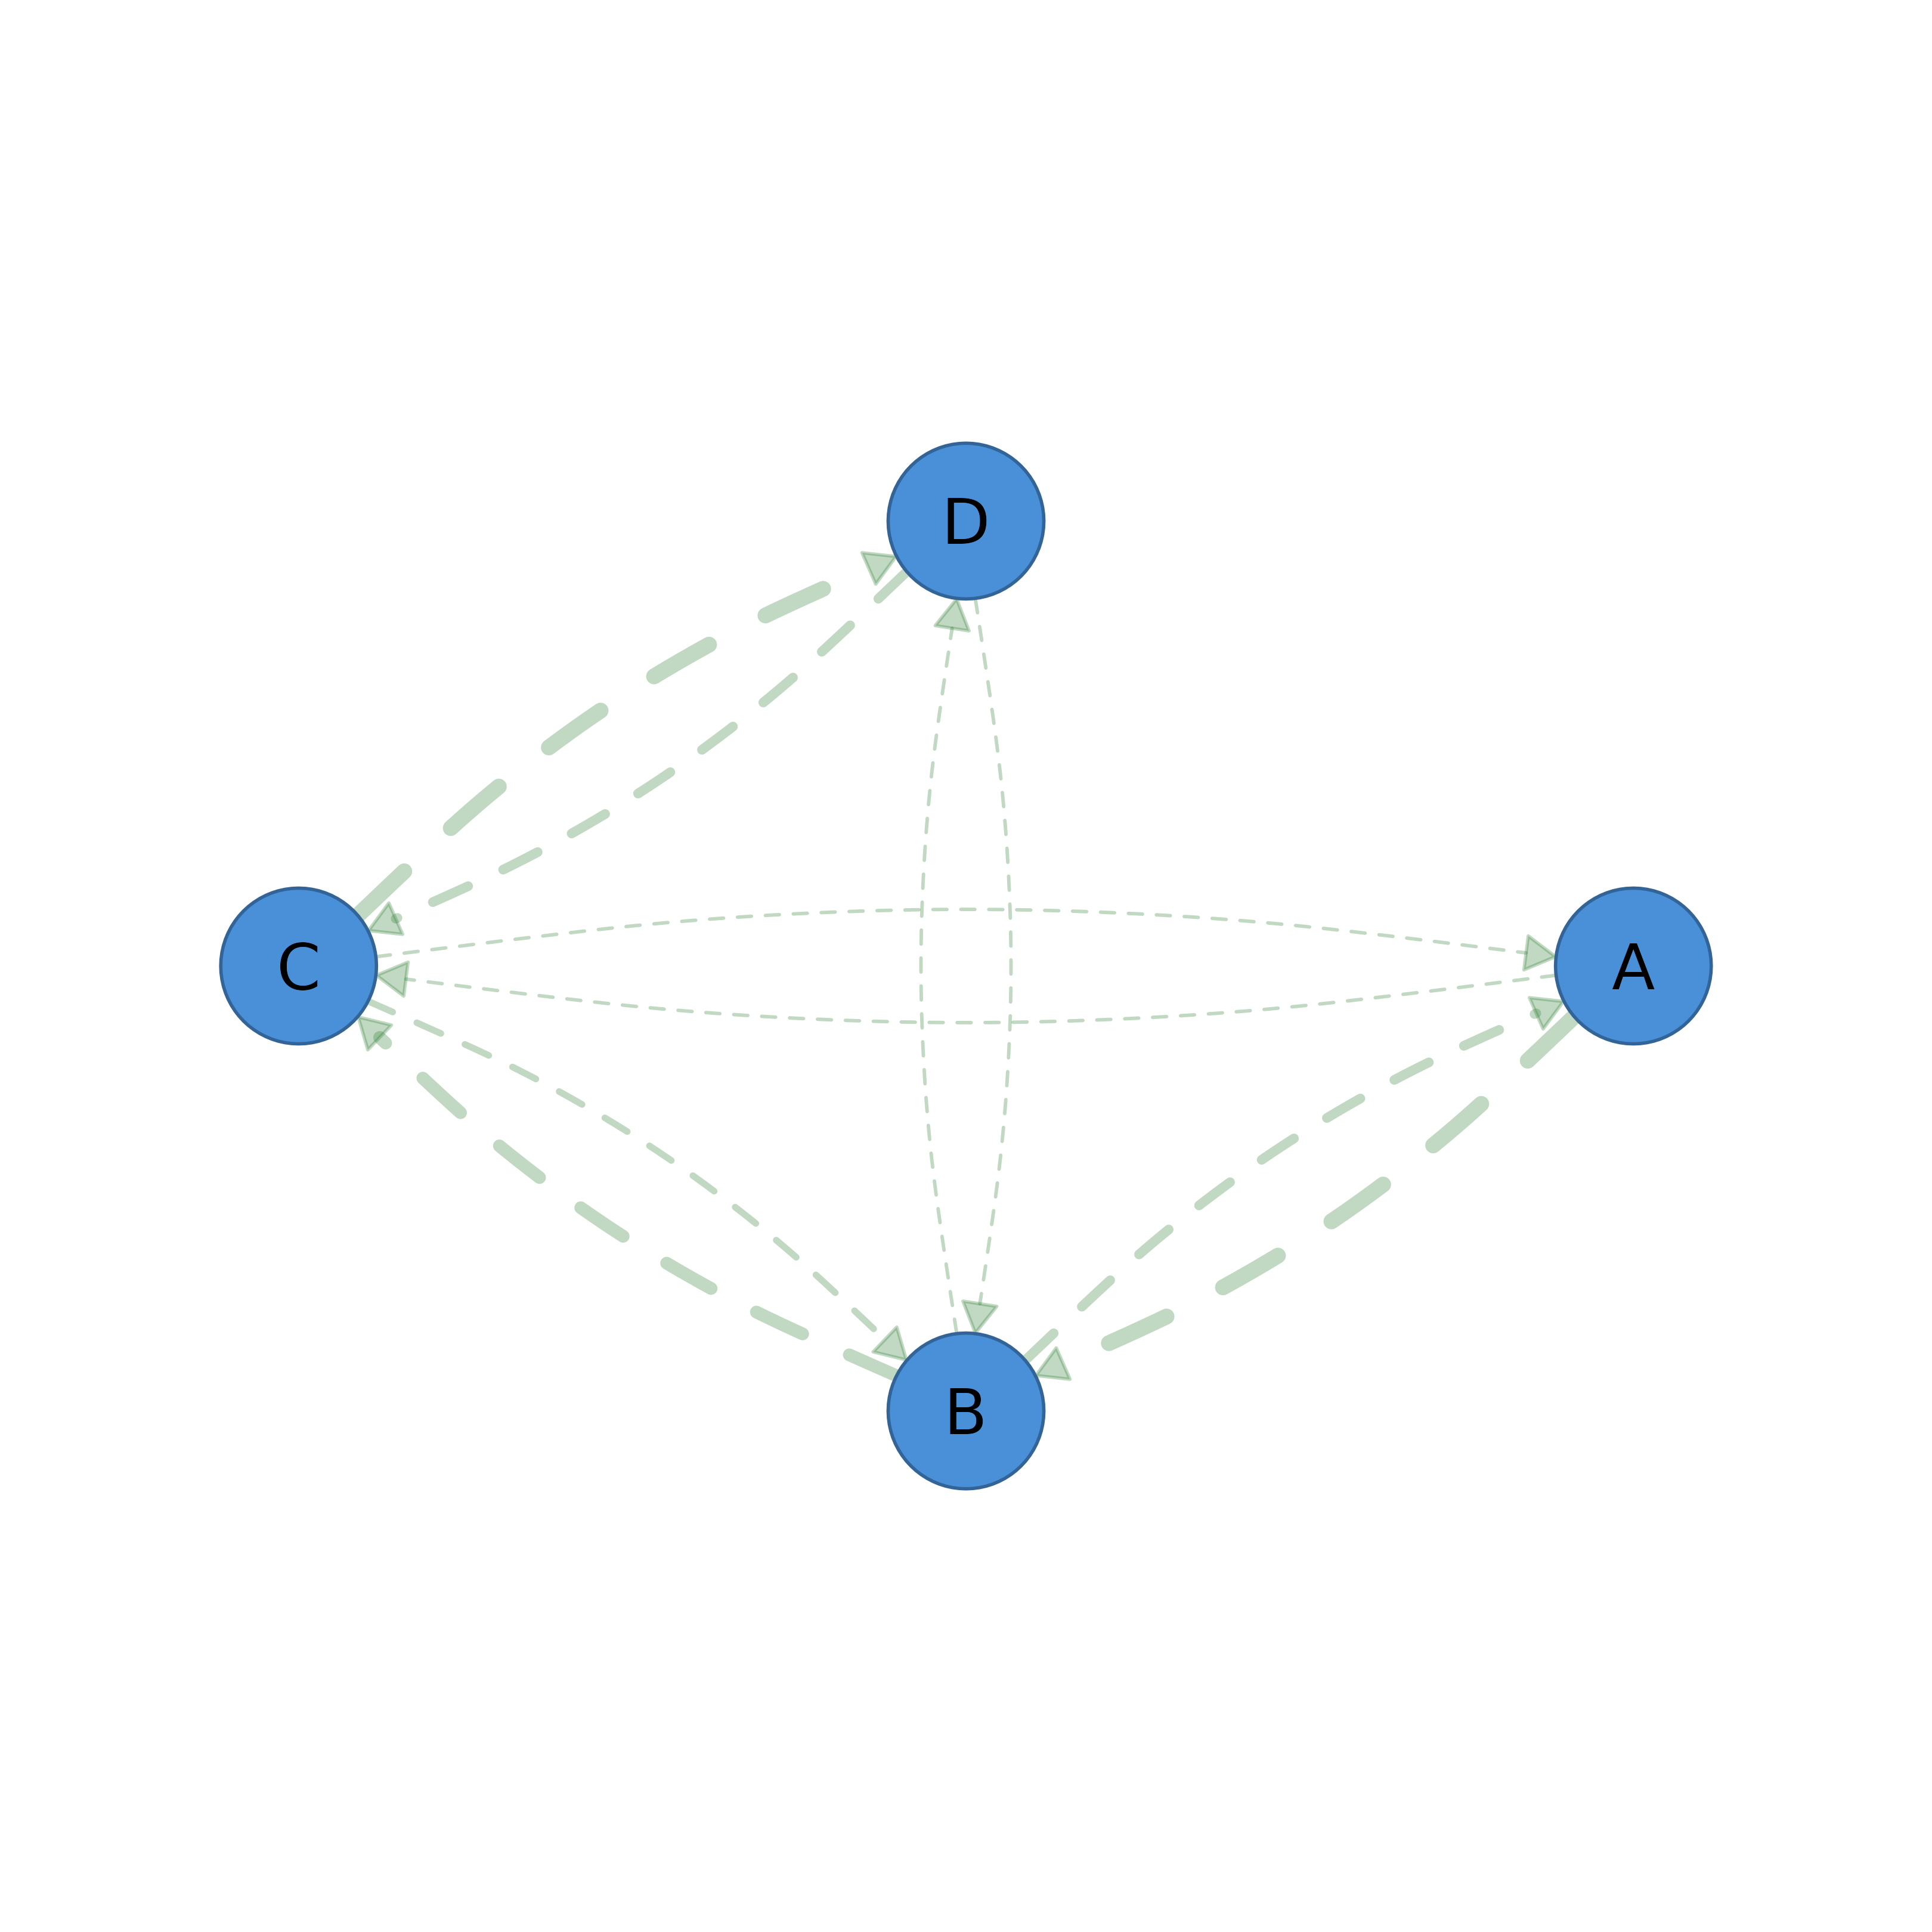
Plot Disparity Results with splot
Usage
splot.tna_disparity(
  x,
  show = c("styled", "backbone", "full"),
  edge_style_sig = 1,
  edge_style_nonsig = 2,
  alpha_nonsig = 0.3,
  ...
)
Arguments
- x
A tna_disparity object.
- show
What to display: "styled" (default), "backbone", "full".
- edge_style_sig
Line style for backbone edges. Default 1 (solid).
- edge_style_nonsig
Line style for non-backbone edges. Default 2 (dashed).
- alpha_nonsig
Alpha for non-backbone edges. Default 0.3.
- ...
Additional arguments passed to splot.
Value
Invisibly returns the value from the underlying splot
call. Called primarily for the side effect of producing a plot.